Comparison based Performance Analysis of
UDP/CBR and TCP/FTP Traffic under AODV
Routing Protocol in MANET
Ritika Sharma
Pursuing M.Tech, Dept. of ECEAITR, Mangaliya Square Indore, MP, India
Kamlesh Gupta
Associate Prof., Dept. ofECEAITR, Mangaliya Square Indore, MP, India
ABSTRACT
The transmission of information in a MANET relies on the performance of the traffic scenario (application traffic agent and data traffic) used in a network. The traffic scenario determines the reliability and capability of information transmission, which necessitates its performance analysis. The objective of this paper is to compare the performance of TCP/FTP and UDP/CBR traffic in AODV routing protocol generally implemented in a mobile ad hoc environment. An empirical study has been done using NS-2. Exhaustive simulations have been done to analyze results, which are evaluated for performance metrics, such as throughput, packet delivery ratio and average end to end delay. The effect of variations in simulation time, number of nodes, and speed of mobile nodes on the network performance is analyzed over a wide range of their values. It is observed that the TCP/FTP offers a far better performance for throughput than UDP/CBR; in case of PDR, former offers an almost constant trend, whereas the latter shows highly varying (rising and falling) trends in all the three aforementioned scenarios. The average end to end delay of latter is lesser than former. The results follow these trends over a wide range of simulation parameters.
General Terms
Mobile ad hoc network (MANET), topology, protocol, routing, performance metrics
Keywords
MANET, TCP/FTP, UDP/CBR, AODV, routing protocol, NS-2, throughput, packet delivery ratio, average end to end delay.
1.
INTRODUCTION
A Mobile Ad Hoc Network (MANET) is a wireless network comprising wireless mobile nodes communicating with one another for some ad hoc purpose. In such networks, there is no fixed infrastructure available; therefore, they are well suited for the infrastructureless environments such as earthquake prone areas, battlefield applications, virtual classrooms, and many emergency services [3, 8]. In such scenarios, MANET’s features like mobile nodes, abruptly changing topology, no physical network boundary, communication with the nodes within wireless range, support the need of communication. The MANET imposes several challenges for communication, out of which one of the important challenges is to provide secure and efficient routing of data in the network [1, 2, 3, 4, 5]. So, there is a great need to develop dynamic and efficient routing protocols, which can ensure efficient and secure routes
for communication. The main objective of this paper is to carry out the performance evaluation of an Ad hoc On demand Distance Vector (AODV) routing protocol for Transmission Control Protocol/File Transmission Protocol (TCP/FTP) and User Datagram Protocol/Constant Bit Rate (UDP/CBR) traffic types, subjected to three varying parameters; simulation time, number or density of node, speed of mobile nodes. These scenarios are tested by exhaustive simulations performed on Network Simulator- Version 2 (NS-2) and the conclusions are drawn based on performance metrics, such as, throughput, packet delivery ratio, and average end to end delay, to evaluate the performance.
2.
RELATED WORK
simulation or run time of a network, number or density of mobile nodes, and speed of mobile nodes. These variations are made on a wide range of their values; exhaustive simulations are done to provide clear trends for performance metrics like, throughput, packet delivery ratio and average end-to-end delay. All these parameters forming a simulation environment provides basis to verify various characteristics offered by two aforementioned traffic scenarios.
3.
AODV ROUTING PROTOCOL
The following sections focus on the basic features and functionality that the AODV routing protocol employs to service in a MANET. This may help to get a clear understanding of the routing scheme, which indirectly governs the transmission capability of a network [2, 4, 10, 12, 14, 16, 18].
3.1
Basic Features
The basic features are mentioned below:
(a) AODV routing protocol belongs to the category of reactive or on demand routing protocols. In such protocols, the nodes do not update their routing tables periodically, unless new routes are demanded by any network node. (b) Stimulated by the above feature, such protocols are not suitable for the networks that are highly dynamic, prone to frequent and unpredictable changes.
(c) AODV routing protocol does not initiate route discovery of its own, unless it is requested by some other node that is willing to transmit any data.
(d) In AODV, the life of the routes in routing table of the nodes is until the routes are no longer needed in the network, i.e., if the routes are not used for a specified period of time, they are discarded.
(e) AODV routing protocol offers route to the destination “on-demand”.
(f) Here any of the source nodes willing to communicate with the destination node of the network to which it has no route information, so it has to make route discovery before making any transmission.
(g) The route discovery and route maintenance which are the two main responsibilities of AODV routing protocol are done by the use of three types of control messages; Route Request (RREQ), Route Reply (RREP), Route Error (RERR) messages.
(h) From the available choices of route, the sender selects the one offering the shortest path to the destination. If one or more routes are of equal length, then it selects the one offering minimum traffic.
(i) AODV employs destination number as the requested node identity to find routes to the destination. This number is mentioned in the RREQ control message.
(j) Bandwidth in AODV is mainly consumed during the starting of any transmission, but not during the entire transmission.
3.2
Functionality
The basic functionality that needs to be understood is the route discovery mechanism employed in AODV. The routes to the destination are traced by using three control messages namely RREQ or query message, RREP and RERR message. These three are explained as follows:
(a) RREQ Control Message: AODV starts discovering routes with the RREQ messages. The source node in the network broadcasts or floods these RREQ messages to its neighbouring nodes. The RREQ messages will be propagated in the network in the aforementioned manner at every node, until the destination node in the network is found. The destination will be checked for matching the destination identity or destination sequence number attached in the RREQ message.
(b) RREP Control Message: Once a node matches the destination sequence number, the destination node generates a RREP message and replies the source with the same, through the same route by which the destination was traced.
(c) RERR Control Message: These messages are generated and propagated through the network in the event of link failures occurring in two possibly encountered scenarios; first, link failure during the transmission of RREP messages and second, link failure in the active route during the course of data transmission. In both the cases the RERR message is generated by a node encountering link failure.
4.
PERFORMANCE METRICS
The performance of any system needs to be evaluated on certain criteria, these criteria then decide the basis of performance of any system. Such parameters are known as performance metrics [10, 13, 14, 16, 18]. The three types of performance metrics used to evaluate performance of TCP/FTP and UDP/CBR in this paper are described below:
4.1
Throughput
The throughput is the measure of how fast we can actually send data through the network. It is the measurement of number of packets that are transmitted through the network in a unit of time. It is desirable to have a network with high throughput.
Throughput R
st sp
P
t t
Where, PR – Received Packet Size, tst – Start Time, tsp – Stop
Time.
Unit – Kbps (Kilo bits per second)
4.2
Packet Delivery Ratio (PDR)
It is the ratio of number of packets received at the destination to the number of packets generated at the source. A network should work to attain high PDR in order to have a better performance. PDR shows the amount of reliability offered by the network.
PDR= R 100
G
N X N
Where, NR – Number of Received Packets, NG – Number of
Generated Packets
Unit – Percentage ratio (%).
4.3
Average End – to – Delay
This is the average time delay consumed by data packets to propagate from source to destination. This delay includes the total time of transmission i.e. propagation time, queuing time, route establishment time etc. A network with minimum average end to end delay offers better speed of communication.
Average End - to - End Delay=tPR tPS
Unit – Milli Seconds (ms).
5.
DATA TRAFFIC /APPLICATION
TRAFFIC TYPES
Data and traffic agent that takes the responsibility to transport the data in the network are of different types and offer different characteristics in the network [10, 17, 18]. It is necessary to understand the characteristics and therefore the performance to find the suitability of each type in a network. The two types of data/traffic agent types used in the network are as follows:
5.1
TCP/FTP
In such a traffic scenario, TCP represents the data type and FTP represents the application traffic agent of any application which transports TCP data. Here TCP is a transport layer protocol and FTP is an application layer protocol. This scenario offers connection oriented transmission environment, where communication occurs in phases, namely, connection establishment, data transmission, connection termination. The three basic characteristics offered are:
(a) Reliable: TCP/FTP offers reliable communication, as it offers guaranteed delivery of data by employing the acknowledgements which guarantees the delivery of data at a destination. In case acknowledgements are not received till the timeout period, retransmissions are made to ensure the delivery of data at the receiver. We can say that positive acknowledgements, timeouts, and retransmissions are required to guarantee the delivery of data in a network.
(b) Bi-directional: Here in TCP/FTP, in one direction i.e. the forward direction, the sender transmits the data and in the other direction i.e. the reverse direction, the receiver acknowledges the sender by transmitting acknowledgements. So, in this way bi-directional communication occurs.
(c) Conforming: The network while working with TCP/FTP, offers conforming nature. The network is conforming in the context of transmissions as it offers both flow and congestion control. Flow control by preventing overflow of recipient buffer, and congestion control by keeping the track of acknowledgements, time outs, and retransmissions.
5.2
UDP/CBR
This type of traffic implies data of UDP type and application traffic agent is CBR. Here, the former is a transport layer protocol and latter is application layer protocol. It offers transmission of data at constant bit rate and does not communicate in phases, and traffic moves in one direction from source to destination without any feedback from destination. It offers three basic characteristics mentioned below:
(a) Unreliable: The network is quiet unreliable as it does not set up communication in phases and does not rely on acknowledgements to recover the lost messages. The sender node does not take the responsibility of the successful delivery of data.
(b) Unidirectional: As no acknowledgements are transmitted from receiver, only one way communication is done i.e. on the forward link. The destination does not send any data packet to the receiver, therefore it offers unidirectional traffic.
(c) Predictable: The UDP/CBR has predictable nature of transmission, as it offers constant bit rate, fixed and known packet size, fixed and known packet interval, and fixed and known packet stream duration.
6.
SIMULATION ENVIRONMENT
The operating system that is used to support the simulation described in this paper is Linux (Ubuntu 10.10). The simulation tool is Network Simulator-2 (NS-2.34), which is a discrete event simulator. This simulator needs operating system that supports g++ system files, that is offered by Linux or UNIX and not by windows which on the other side supports .exe system file. Linux is used; as it offers both graphical user interfaces (GUI) and command line interface (CLI), whereas UNIX offers only CLI. The simulation of a MANET is done for AODV routing protocol, and the impact of variation in the parameters like, simulation time, number of nodes, and speed of mobile nodes are observed on the network.
7.
SIMULATION MODELS
There are three simulation models specified in this paper. These models specify the various parameters and their values that are used for TCP/FTP and UDP/CBR connection environment for the three aforementioned variations.
7.1
Simulation Model I: Varying Simulation
Time
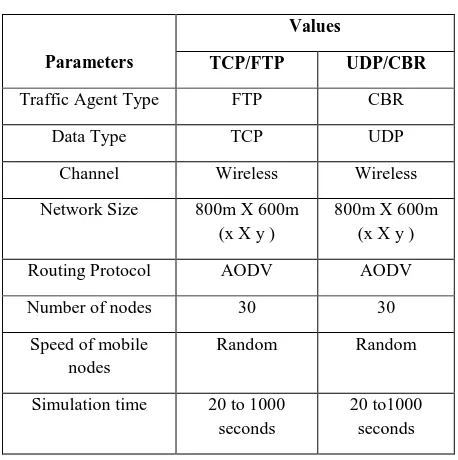
[image:3.595.314.543.397.627.2]The following table 1 specifies the parameters used for varying simulation time network model.
Table 1. Parameters for Model I
Parameters
Values
TCP/FTP UDP/CBR
Traffic Agent Type FTP CBR
Data Type TCP UDP
Channel Wireless Wireless
Network Size 800m X 600m (x X y )
800m X 600m (x X y )
Routing Protocol AODV AODV
Number of nodes 30 30
Speed of mobile nodes
Random Random
Simulation time 20 to 1000 seconds
20 to1000 seconds
7.2
Simulation Model II: Varying Number of
Nodes
Table 2. Parameters for Model II
Parameters
Values
TCP/FTP UDP/CBR
Traffic Agent Type FTP CBR
Data Type TCP UDP
Channel Wireless Wireless
Network Size 800m X 600m (x X y )
800m X 600m (x X y )
Routing Protocol AODV AODV
Number of nodes 10 to 100 10 to 100 Speed of mobile
nodes
33.33 m/sec. Or 120 km/hr
33.33 m/sec. Or 120 km/hr Simulation time 1000 seconds 1000 seconds
7.3
Simulation Model III: Varying Speed
of Mobile Nodes
[image:4.595.314.549.130.487.2]The following table specifies the parameters used for varying speed of mobile nodes implemented in this network model to test the performance of the network. These are provided in Table 3 which is given below:
Table 3. Parameters for Model III
Parameters
Values
TCP/FTP UDP/CBR
Traffic Agent Type FTP CBR
Data Type TCP UDP
Channel Wireless Wireless
Network Size 800m X 600m (x X y )
800m X 600m (x X y )
Routing Protocol AODV AODV
Number of nodes 30 nodes 30 nodes Speed of mobile
nodes
5.55 m/sec or 20 km/hr to 33.33
m/sec or 120 km/hr
5.55 m/sec or 20 km/hr to 33.33 m/sec or
120 km/hr Simulation time 1000 seconds 1000 seconds
8.
EXPERIMENTAL RESULTS AND
OBSERVATIONS
The following tables show the observations taken for the various variations, and their effect on the three performance metrics for both TCP/FTP, and UDP/CBR. The results are provided through graphs plotted as Performance metrics vs. varying parameters (e.g. Throughput vs. Simulation time).
8.1
Observation Table I
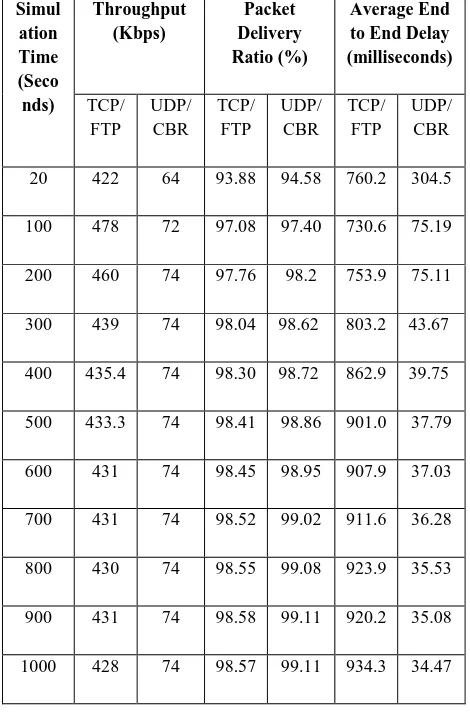
The observations obtained by implementing model I for the two traffic scenarios is provided in Table 4.
Table 4. Observations for Varying Simulation Time
Simul ation Time (Seco nds)
Throughput (Kbps)
Packet Delivery Ratio (%)
Average End to End Delay (milliseconds)
TCP/ FTP
UDP/ CBR
TCP/ FTP
UDP/ CBR
TCP/ FTP
UDP/ CBR
20 422 64 93.88 94.58 760.2 304.5
100 478 72 97.08 97.40 730.6 75.19
200 460 74 97.76 98.2 753.9 75.11
300 439 74 98.04 98.62 803.2 43.67
400 435.4 74 98.30 98.72 862.9 39.75
500 433.3 74 98.41 98.86 901.0 37.79
600 431 74 98.45 98.95 907.9 37.03
700 431 74 98.52 99.02 911.6 36.28
800 430 74 98.55 99.08 923.9 35.53
900 431 74 98.58 99.11 920.2 35.08
1000 428 74 98.57 99.11 934.3 34.47
[image:4.595.53.287.413.684.2]8.1.1
Result I: Throughput vs. Simulation Time
The following Figure 1 shows the response of throughput expressed in kbps against varying simulation time in seconds for the two traffic scenarios obtained by table 4.Fig. 1: Graph of Throughput vs. Simulation Time
0 100 200 300 400 500
20 100 200 300 400 500 600 700 800 900 1000
TCP/FTP
UDP/CBR
Simulation Time (s)
T
h
ro
u
g
h
p
u
t
(in
k
b
p
[image:4.595.313.547.557.727.2]8.1.2
Result II: Packet Delivery Ratio vs.
Simulation Time
[image:5.595.314.549.87.422.2]Based on the observations of table 4, the response of packet delivery ratio in % against varying simulation time in seconds is shown in Figure 2.
Fig. 2: Graph of Packet Delivery Ratio vs. Simulation Time
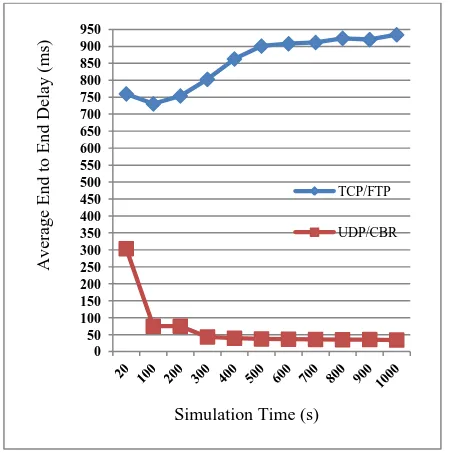
8.1.3
Result III: Average End- to- End Delay vs.
Simulation Time
[image:5.595.51.285.132.353.2]Based on the observations of table 4, the response of average end – to – end delay in ms against varying simulation time in seconds is shown in Figure 3.
Fig. 3: Graph of Average End – to – End Delay vs. Simulation Time
8.2
Observation Table II
[image:5.595.52.277.454.684.2]The observations taken on implementing model II for the two traffic scenarios is provided in Table 5. The results are based on these observations.
Table 5. Observations for Varying Number of Nodes
Num ber of node
s
Throughput (Kbps)
Packet Delivery Ratio
(%)
Average End to End Delay (milliseconds)
TCP/ FTP
UDP/ CBR
TCP/ FTP
UDP/ CBR
TCP/ FTP
UDP/ CBR
10 476 46 97 99 500 20
20 580 90 97 98 646 40
30 445 130 95 94 913 140
40 472 157 94 87 950 302
50 380 166 92 74 1116 1140
60 991 140 97 51 362 3330
70 853 125 97 40 387 4600
80 1000 119 97 33 536 4440
90 917 122 96 32 460 5745
100 926 100 96 23 412 5588
8.2.1
Result I: Throughput vs. Number of Nodes
The following Figure 4 shows the response of throughput expressed in kbps against number of nodes for the two traffic scenarios obtained by table 5.Fig. 4: Graph of Throughput vs. Number of Nodes
91 92 93 94 95 96 97 98 99 100
20 100 200 300 400 500 600 700 800 900 1000
TCP/FTP
UDP/CBR
0 50 100 150 200 250 300 350 400 450 500 550 600 650 700 750 800 850 900 950
TCP/FTP
UDP/CBR
40 100 160 220 280 340 400 460 520 580 640 700 760 820 880 940 1000
10 20 30 40 50 60 70 80 90 100 TCP/FTP
UDP/CBR
T
h
ro
u
g
h
p
u
t
(in
k
b
p
s)
Number of nodes Simulation Time (s)
P
ac
k
et
De
li
v
ery
Ra
ti
o
(%
)
A
v
era
g
e
En
d
t
o
E
n
d
De
lay
(
ms
)
[image:5.595.311.553.491.722.2]8.2.2
Result II: Packet Delivery Ratio vs. Number
of Nodes
Based on the observations of table 5, the response of packet delivery ratio in % against varying number of nodes is shown in Figure 5.
Fig. 5: Graph of Packet Delivery Ratio vs. Number of Nodes
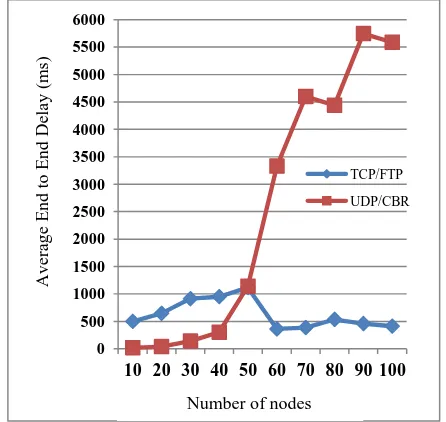
8.2.3
Result III: Average End – to – End Delay vs.
Number of Nodes
Based on the observations of table 5, the response of average end – to – end delay in ms against varying number of nodes is shown in Figure 6.
[image:6.595.52.291.134.336.2]Fig. 6: Graph of Average End – to – End Delay vs.
Number of Nodes
8.3
Observation Table III
The observations provided below are obtained by number of exhaustive simulations done to obtain a clear trend of the performance in a network. On the basis of these observations the response of the performance against the varying parameter for the two traffic scenarios is plotted. The observations are taken for the three performance metrics; throughput, packet delivery ratio and average end - to - end delay. The
observations taken on implementing model III for the two traffic scenarios is provided below in Table 6.
Table 6. Observations for Varying Speed of Mobile Nodes
Speed of mobile
nodes (m/sec.
Or km/hr)
Throughput (Kbps)
Packet Delivery Ratio (%)
Average End to End Delay (milliseconds
)
TCP /FTP
UD P/C BR
TCP /FT
P
UDP/ CBR
TCP /FT P
UDP/ CBR
5.33 or 20 464 68 98 94 727 189
11.11 or 40
430 72 97 97 790 55
16.66 or 60
405 73 97 98 951 62
22.22 or 80
397 69 96 94 803 164
27.77 or 100
448 71 97 96 780 73
33.33 or 120
383 70 96 95 887 205
8.3.1
Result I: Throughput vs. Speed of Mobile
Nodes
The following Figure 7 shows the response of throughput expressed in kbps against speed of mobile nodes for the two traffic scenarios obtained by table 6.
Fig. 7: Graph of Throughput vs. Speed of Mobile Nodes
20 25 30 35 40 45 50 55 60 65 70 75 80 85 90 95 100
10 20 30 40 50 60 70 80 90 100 TCP/FTP
UDP/CBR
P
ac
k
et
De
li
v
ery
Ra
ti
o
(%
)
Number of nodes
0 500 1000 1500 2000 2500 3000 3500 4000 4500 5000 5500 6000
10 20 30 40 50 60 70 80 90 100 TCP/FTP
UDP/CBR
0 50 100 150 200 250 300 350 400 450 500
20 40 60 80 100 120
TCP/FTP
UDP/CBR
Number of nodes
Av
era
g
e
E
n
d
to
En
d
De
lay
(
m
s)
Speed of mobile nodes (km/hr) (km/hr) (km/hr)
T
h
ro
u
g
h
p
u
t
(k
b
p
[image:6.595.55.278.420.631.2]8.3.2
Result II: Packet Delivery Ratio vs. Speed of
Mobile Nodes
[image:7.595.52.281.133.333.2]Based on the observations of table 6, the response of packet delivery ratio in % against varying speed of mobile nodes is shown in Figure 8.
Fig. 8: Graph of Packet Delivery Ratio vs. Speed of Mobile Nodes
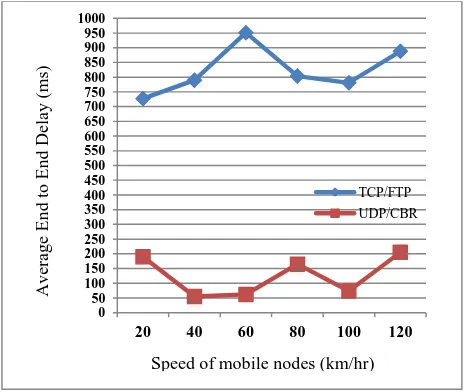
8.3.3
Result III: Average End – to – End Delay vs.
Speed of Mobile Nodes
Based on the observations of table 6, the response of average end – to – end delay in ms against varying speed of mobile nodes is shown in Figure 9.
Fig. 9: Graph of Average End – to – End Delay vs. Speed of Mobile Nodes
9.
CONCLUSIONS AND FUTURE
SCOPE
The conclusions presented in this paper compare the two traffic scenarios that are TCP/FTP and UDP/CBR, implemented in the network under test. To find the suitability from these two available traffics in a network in various environments, the results are compared and necessary conclusions are made. The paper is concluded on the basis of
performance offered by the traffic patterns for the three performance metrics considered. The various conclusions drawn from various experiments, observations, and analysis done in the paper are as follows:
Throughput: Out of the two traffic types i.e. TCP/FTP and UDP/CBR, the former one provides far better performance than the latter. This proves that the network working with AODV provides better efficiency with TCP/FTP than UDP/CBR.
Packet Delivery Ratio (PDR): Although the PDR of UDP/CBR has greater maximum and minimum values than TCP/FTP, the latter offers almost a constant trend, whereas, the former offers highly varying (rising and falling trends), in all the three scenarios. Therefore, TCP/FTP is more reliable than UDP/CBR.
Average End to End Delay: The UDP/CBR offers lesser, average end to end delay, than TCP/FTP, therefore better speed of transmission, but as an exception in the scenario of number of nodes, as the density of nodes increases, the average end – to - end delay also increases and the speed of transmission decreases. For future extensions in this work, the concept can be used with various variants of TCP to give a comprehensive performance analysis for various other reactive protocols and performance metrics.
10.
REFERENCES
[1] Panagiotis Papadimitratos and Zugmunt J. Haas, “Secure routing for Mobile Ad Hoc Networks”, In Proceedings of the SCS Communication Networks and Distributed Systems Modeling and Simulation Conference (CNDS-2002), San Antonio, TX, January 27-31, 2002.
[2] Sunil Taneja and Ashwani Kush, “A Survey of Routing Protocols in Mobile Ad Hoc Networks”, International Journal of Innovation, Management and Technology, Vol. 01, No. 03, August 2010, 279-285.
[3] GS. Mamatha and Dr. S.C. Sharma, “Analyzing MANET Variations, Challenges, Capacity and Protocol Issues”, International Journal of Computer Science and Engineering Survey (IJCSES), Vol. 1, No.1, August 2010, 14-21.
[4] G. Vijaya Kumar, Y Vasudev Reddyr, Dr. M. Nagendra, “Current Research Work on Routing Protocols for MANET: A Literature Survey”, International Journal on Computer Science and Engineering, Vol. 02, No. 03, 2010, 706-713.
[5] Jun-Zhao Sun, “Mobile Ad Hoc Networking: An Essential Technology for Pervasive Computing”, Info-Tech and Info-net, 2001. Proceedings. ICII 2001- Beijing.2001 International conference, 2001, Vol. No. 03, 316-321.
[6] Imrich Chlamtac, Marco Conti, Jennifer J-N Liu, “Mobile Ad Hoc Networking-Imperatives and Challenges”, Elsevier, 2003, 13-64.
[7] Priyanka Goyal, Vinti Parmar, Rahul Rishi, “MANET: Vulnerabilities, Challenges, Attacks, Applications”, International Journal of Computational Engineering & Management, Vol. 11, January 2011, 32-37.
[8] Jiazi YI, “A Survey on the Applications of MANET”, Polytech’ Nantes, February 2008.
[9] A Rahim, I Ahmed, Z S Khan, M Sher, M Shoaib, A Javed, R Mahmood, “A Comparative Study of Mobile and Vehicular Ad Hoc Networks”, International Journal
90 91 92 93 94 95 96 97 98 99 100
20 40 60 80 100 120
TCP/FTP
UDP/CBR
Speed of mobile nodes (km/hr)
P
ac
k
et
De
li
v
ery
Ra
ti
o
(%
)
0 50 100 150 200 250 300 350 400 450 500 550 600 650 700 750 800 850 900 950 1000
20 40 60 80 100 120
TCP/FTP UDP/CBR
Speed of mobile nodes (km/hr)
Av
era
g
e
En
d
to
En
d
De
lay
(m
[image:7.595.53.288.435.631.2]of Recent Trends in Engineering, Vol. 02, No. 04, November 2009. 195-197.
[10] Bijan Paul, Md. Ibrahim, Md. Abu Naser Bikas, “Experimental Analysis of AODV & DSR over TCP & CBR Connections with Varying Speed and Node Density in VANET”, International Journal of Computer Applications, Vol. 24, No. 4, June 2011.
[11] Muhammad Inayat Ullah, Nasir Nawaz, “Measuring the Effect of CBR and TCP Traffic Models over DYMO Routing Protocol”, Global Journal of Computer Science and Technology, Vol. 11 Issue 14.
[12] Md. Monzur Morshed, Meftah Ur Rahman, Md. Rafiqul Islam: An Empirical Study of UDP (CBR) Packet Performance over AODV Single & Multi-Channel Parallel Transmission in MANET. CoRR abs/1109.6502 (2011)
[13] Vikas Singla, Ajay Kumar, Rakesh Singla, “CBR and TCP Based Performance Comparison of Various Protocols of MANET: A Review”, National Journal on Advances in Computing and Management, Vol. 1, No. 2, October 2010.
[14] Deepti Verma, Deepika Chandrawanshi, “Comparative Performance Evaluation of AODV over CBR and TCP Traffic”, IJCST, Vol. 2, Issue 2 June 2011.
[15] V.R. Sarna Dhulipala, R.M. Chandrasekran, R. Prabakaran, “Timing Analysis and Repeatability Issues of Mobile Ad Hoc Networking Applications Traffic”, International Journal of Recent Trends in Engineering, Vol.1, No.1 May 2009.
[16] Ajay Kumar, Ashwani Kumar Singla, “Performance Evaluation of MANET routing protocols on the basis of TCP Traffic pattern”, International Journal of Information Technology Convergence and Services (IJITCS), Vol. 1, No. 5, October 2011.
[17] Thomas Clausen, Philip Jacquet, Laurent Viennot, “Comparative Study of CBR and TCP Performance of MANET Routing Protocols”, Mindpass Center for Distributed Systems.