5
VIII
August 2017
Estimation of Atmospheric Cloud Cover Using
Total Sky Imager
G.SandhyaKumari¹, A.Lasmika², T.Nirmala³
¹Dept of ECE, Sri Padmavati Mahila Visvavidyalayam (SoET), Tirupati, A.P.517502
2,3Assistant Professor, Dept. of ECE, Sri Padmavati Mahila Visvavidyalayam (SoET), Tirupati, A.P.517502
Abstract: The aim of the work is to carry out image processing of the images captured by the TSI 440A located at NARL, Gadanki to estimate the fractional cloud cover. The total sky imager-440A, basically consists of a convex mirror on top of which a CCD camera is located to capture the images of hemispherical sky. The visible image captured by the total sky imager can be separated into red, green and blue images. Further, the pixels with a red-to-blue ratio greater than 0.5 are classified as cloudy and lower than 0.5 are classified as cloud free. The threshold value of 0.5 (R/B ratio) has been arrived based on manual inspection of twenty number of training images with cloud and clear conditions. Finally, the pixels are counted separately with r/b ratio less than 0.5 as cloud free, above 0.6 as opaque clouds and r/b ratio between 0.5 and 0.6 as thin clouds. Before the sky cover is estimated the images were masked for peripheral appearance using circular cropping technique. In addition to this, shadowband, rod assembly and sun spot is removed using threshold values. Overall objective of the work is to develop dedicated software for the detection of cloud cover and cloud type. However, the work carried out in the present project is a kick start towards envisaging the comprehensive software development. The robust ness of the algorithm development here will be tested with more number of training images in future.
Keywords: Total sky imager, Post Processing, Circular Cropping, Shadowband removal, Sun intensity dot masking, Fractionalsky cover
I. INTRODUCTION
Atmospheric Clouds are the only visible components of the Earth’s Atmosphere which covers nearly one third of the globe at any given instant of time. Mainly consists of water vapour condensed either in the form of liquid or ice crystal plays key role in the Earth’s radiative budget, hydrological cycle, and large-scale dynamics and further in climate change. Atmospheric clouds interact with radiation in two ways. They reflect the incoming solar radiation back to space thereby cooling the Earth’s surface also known as the cloud albedo effect. Secondly, Clouds absorb, reradiate the outgoing longwave radiation back to the Earth surface, thus acts as a blanket in the trapping the outgoing radiation, resulting in to the warming at Earth’s surface also known as cloud greenhouse effect. The latent heat released and absorbed in the formation and dissipation of the cloud drives the large-scale circulations in the atmosphere. As a result of the variety of phenomena played by clouds as discussed, it’s studies have received significant attention in the field of atmospheric sciences.
A physical parameter widely used by the scientific community to quantify the presence of cloud in the sky is called as “Cloud Fraction”. The cloud fraction is defined as the fractional area of sky covered by the cloud in the vicinity of observation/observer. Conventionally clouds are mapped by human observer by visual inspection. The hemispherical sky above the observer is essentially divided in to eight parts also called Okta. Further, cloud presence in each segment of the okta is accounted in estimating a number representing the cloud fraction of the hemispherical sky.
In the present scenario satellites are widely used in estimation of global distribution of cloud fraction. Here, the cloud fraction is defined as the ratio of number of cloudy pixels to the total number of pixels in the field of view of the satellite.
II. OBJECTIVE
fraction. Sky imager is an automated ground based instrument used in obtaining instantaneous cloud fraction during day time with high temporal and areal resolution. The working principle and technical details of the instrument are provided in the section 3. The raw images are post processed using codes developed in MATLAB. The major steps carried out include circular cropping of images, removal of shadow band (noise removal). Finally, the cloud fraction is estimated based on the intensity of red and blue colour pixel data extracted from the images is described in the section post processing of images. Overall scientific work is summarised in the section4.
III. INSTRUMENT
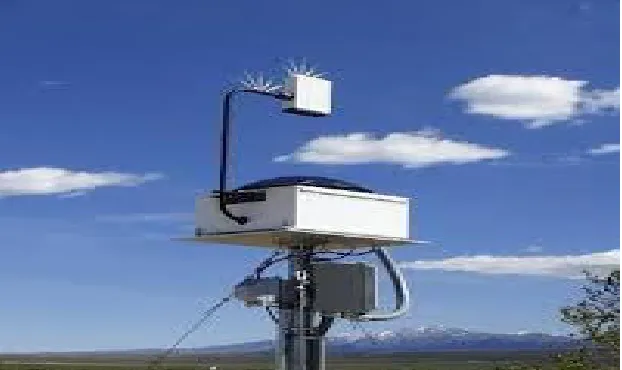
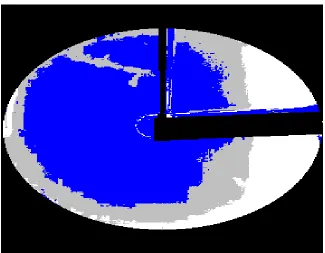
[image:3.612.188.499.313.498.2]Total Sky Imager (TSI) 400A commercialised by Yankee Environmental Systems, USA is shown in figure.1. The instrument is deployed in the campus of National Atmospheric Research Laboratory (NARL), Gadanki for continuous day-time cloud observations. The main components of the instrument are the imager (a CCD camera), metallic coated plate (acts a mirror in reflecting the view of hemispherical sky above) and the control unit (consisting of hardware for rotating the mirror, capturing and processing the sky images). A shadow band fixed on the mirror tracks the sun (with mirror rotation) to avoid direct exposure of the camera optics to the reflection from the Sun. The imager captures the sky condition based on the time interval customised by the user. These images are processed either real time or offline (batch processing) using TSI manager software to retrieve cloud fraction and clear sky fraction. An example raw image is shown in figure.1a and corresponding processed image in figure. 1b. More details of the instrument can be found in the long et. al., 2006 or in the instrument manual available at www.yesinc.com.
Figure.1 Total Sky Imager 440A developed by YES Inc., Ltd., USA.
[image:3.612.217.468.528.709.2]Figure 1b: Processed image(png format)
A. Post Processing of Images
1) Objective: As detailed in previous sections TSI manager software hosts sophisticated algorithm to process the captured images in to information. However, this software does not provide the information such as the cloud type (low, middle and high cloud). The TSI manager processed images are not view angle corrected. That is, there is slight difference in the view angle between two adjacent pixels recorded by the imager. Also, software retrievals needs to be cross verified for their robustness as the cloud cover estimation is mainly based on the threshold values. Therefore, a dedicated algorithm (using MATLAB) is planned for post processing of the TSI captured raw images to retrieve cloud fraction and cloud type. In a step forward in this direction, only 20 images have been post processed and cloud fraction is estimated in the present project work.
Further, the robustness of the algorithm will be checked with more number of images and information and cloud type will also be retrieved in future studies. However, the outcomes from this project are sufficient to kick start the overall objective of envisaging a dedicated software for post processing TSI images.
B. Separation of RGB Images
In TSI imager software, fractional sky cover is estimated based on the threshold values on thin, opaque, clear and sunny conditions also called the sky filter. The sky filter plays crucial role in the outcome from the processed images. In general, the users are allowed to adjust the sky filter before they make the system run on real time image processing option. These sky filter window consists of few parameters to be mentioned. The ration of clear to thin cloud, thin to opaque cloud and the sunny condition. By default, the sequence of inputs is 40, 60 and 100 respectively. However, users are advised to revisit the numbers for their observational site by carefully looking in to the captured images.
Figure.2 Separation of r g b images from the raw(jpeg) image
C. Circular Cropping of Raw Images
The images captured by the imager contain information surrounding the mirror in addition to the hemispherical sky reflection from mirror. Since this information does not represent the hemispherical sky it has to be removed before the image is analyzed for the r/b ratio. This is done through the circular cropping procedure. The centre of the image and the radius of the circle are provided as input to the program used to do the circular cropping. Based on this input, the code generates a circle and the image portion with in the circle is only considered while the outer edges are completely ignored.
TSI manager software also does the same job before it estimates the actual cloud fraction. However, they crop the image based on the field of view or solar zenith angle. Usually, this value is mentioned in the software by the user under the input item “Analyze the region of sky within xx degree of solar zenith angle”. The default value is 85 degree and the 80 degrees of solar zenith angle is equivalent to the field of view of 100 deg.
In the present study we have cropped the images with x=242, y=316 as centre and 195 as radius of the circle. This cropping correspond to the approximately the 80 degree of solar zenith angle. In this manner we have not only cropped the portion of captured image immediately out of the mirror reflection but also the portion of the image close to the horizon as the data from these part of the image is prone to bias also incorporates nearby obstacles in the field of view at horizon. The dark portion of the image shown in figure.3 indicates the removal of outer edges of the image after circular cropping.
Figure.3 Raw image and its circularly cropped image
D. Shadow Band Removal
The Second and most important noise in the captured image is the shadowband and arm. These two portion needs to be removed as they occupy significant number of pixels in the image and if overlooked generate significant bias in the retrieved cloud fraction. Shadowband and arm were also removed by the TSI manager software. However, there are no details available in the literature or in
red green
manual on how they have been removed. The imager resting arm location in the image is fixed. However, the location of the shadowband is not fixed. It keeps on rotating while tracking the sun. Therefore, it is difficult to remove an object from image which is changing it’s position with time. However, we have explored couple of edge detection techniques to detect the edges of the shadowband. Though we were able to detect the shadow band the techniques were also detecting the edges of the clouds. Therefore, the edge detection techniques were really not helpful in this regard.
E. Edge Detection Techniques
To the raw jpeg image, we applied edge detection operators like log edge detection operator, sobel edge detection operator, canny edge detection operator and zero cross edge detection operator. when compared to all other operators sobel operator only highlights the boundary of shadow band pixels some part of cloudy pixels which have the high intensity and the supporting rod of a shadowband .we applied edge detection techniques to the raw jpeg cloud image to analyse the possibility of removing the shadow band and the supporting rod. The edge detectors displays the image matrix with a binary format of ones and zeros. so, based on this we can detect the pixels of shadow band and rod and at the same time we can remove it. But with these images it is not possible to calculate the fractional sky cover with the sobel edge detector image and with any type of edge detection images.
Figure.4 Application of edge detection operators to the cloud images F. Threshold Technique
The edge detection techniques helps to detect and to remove the shadow band pixels region and the region of rod which supports the shadow band, but it is not possible to calculate the fractional sky cover with that edge detection images as it detects the edges of the clouds also.
G. Masking of Shadow Band Pixels
By detecting the threshold value of red, green and blue pixels at shadow band region of an each individual image collected by the total sky imager, we can define the threshold mask .In our images the threshold values for red ,green and blue pixels at shadow band region is detected which are at a range of greater than or equal to 60 for red pixel, greater than or equal to 100 for green pixel and greater than or equal to 120 for blue pixel. With this threshold values of blue, green and read pixel intensity we could able to clearly
log zerocross
with this threshold technique we were not able to pick the sun spot as properly. It may be due to the reason that the sun spot and it’s surrounds will have very high intensity. Therefore, we had to make a separate threshold value set of blue, green and red for the sun spot and it’s surroundings.
Figure.5 shadow band masking
H. Sun intensity Dot Masking
With the values above 230, 230 and 240 for red, blue and green respectively, we could able to detect the boundaries of the sun spot and surrounding high intensity regions as shown in figure. Further, these pixels are ignored by making them as NaNs.
Figure.6 sun intensity dot masking
I. Fractional Sky Cover
As discussed above the images were first circularly cropped and shadow band assemblies were masked before the sky cover is estimated. Further, the unmasked pixels are evaluated for r/b ratio. The pixels with r/b ration less than 0.5, above 0.6 and between 0.5 and 0.6 are counted separately for each image. The ratio of number of pixels with r/b less than 0.5 to the total number of pixels is represented as cloud free fraction. Similarly, the ratio between pixels with r/b above 0.6 to the total number of pixels is represented as opaque cloud fraction and finally the ratio between number of pixels with r/b ratio between 0.5 and 0.6 to the total number of pixels is represented as thin cloud fraction. For each image, thin, thick (opaque) and cloud free fraction is estimated. These results were compared well with the TSI manager software retrievals.
IV. SUMMARY
ground based instrument is recommended for continuous and consistent cloud observations. Moreover, ground based instruments are more reliable than satellite borne cloud observations.
A dedicated day time automated cloud monitoring instrument is discussed in the present work. Observations from total sky imager (TSI-440A; YES Inc. Ltd., USA) deployed at NARL, Gadanki are utilized in the analysis. The TSI Sky imager consists of a mirror, detector and CPU captures the sky condition in required time intervals and process with TSI manager software (patented software comes with the instrument used in captured, processing or post processing of the sky images) provides the instantaneous sky condition in terms of clear, thin and thick cloud fraction. However, the TSI manger software has to be tested for robustness as it mainly depends on the customized inputs. Also, the software does not provide the cloud type and does not account for view angle correction. Therefore, dedicated software using MATLAB code is planned to be developed using the MATLAB. A step forward in this direction, 20 training images has been analyzed in the project work and cloud fraction is also retrieved. The steps followed in the development of the algorithm are described in the below.
Step.1. Manually check the each raw image among 20 trained images to identify the threshold r/b value for the cloud free, thin cloud and thick cloud regions.
A. Step.2. Load any raw image captured by TSI.
B. Step.3. Apply circular cropping technique to crop square image in to circular image C. Step.4. Masking of shadow band and arm rest
D. Step.5. Masking of sun spot and associated bright region around the sun
E. Step.6. counting the final un masked pixels of the image for r/b values less than 0.5 and greater than 0.6 and between these two values for calculating the cloud free fraction, thick cloud fraction and thin cloud fraction respectively.
V. CONCLUSION
It is to be noted that, the threshold values of r/b ratio manually estimated here is a simplest method for cloud classification. However, this threshold values may change with solar zenith angle, distance of the pixel from the center of the image and from the sun. During the conditions of haze, for pixels located close to the horizon may be considered as cloud with high r/b values. TSI manger software evaluates the image above 80 solar zenith angle of 160 degree field of view. In the present study we have cropped the image with radius which will result in to image whose field of view is approximately equal to the 160 degree. Therefore, it is cautioned that the estimated cloud fraction in the study might have been overestimated and a detailed analysis with nearly 100 training images is planned in future. However, this study serves as the basis for extension of the analysis planned.
REFERENCES
[1] Long, C. N., Sabburg, J. M., Calbo, J., and Pagés, D.: Retrieving cloud characteristics from ground-based daytime color all-sky images, J. Atmos. Ocean. Tech., 23, 633–652, 2006.
[2] D. W. Slater, and T. Tooman, 2001: Total Sky Imager (TSI)model 880 status and testing results. Atmospheric Radiation Measurement Program Tech. Rep. ARM TR-006, 36 pp.[Available online at http://www.arm.gov/publications/tech_reports/arm-tr-006.pdf.].
[3] Pfister, G., R. L. McKenzie, J. B. Liley, A. Thomas, B. W. Forgan,and C. N. Long, 2003: Cloud coverage based on all-sky imaging and its impact onsurface solar irradiance. J. Appl. Meteor.,42, 1421–1434.
[4] Pagès, D., J. Calbó, C. N. Long, J.-A. González, and J. Badosa, 2002: Comparison of several ground-based cloud detection techniques. Extended Abstracts, European Geophysical Society XXVII General Assembly, Nice, France, European Geophysical Society, CD-ROM.
[5] https://in.mathworks.com/.
[6] Sabburg, J., and J. Wong, 1999: Evaluation of a ground-based sky camera system for use in surface irradiance measurement. J.Atmos. Oceanic Technol., 16, 752–759.