comment
reviews
reports
deposited research
interactions
information
refereed research
Research
Gene expression changes during murine postnatal brain
development
M Clinton*, J Manson
, D McBride* and G Miele*
Addresses: *Department of Gene Expression and Development, The Roslin Instituite, Roslin, Midlothian EH25 9PS, UK. Department of Biochemistry, Neuropathogenesis Unit, The Institute of Animal Health, West Mains Rd, Edinburgh EH9 3JF, UK.
Correspondence: M Clinton. E-mail: [email protected]
Abstract
Background:For most vertebrate organs and tissues, the majority of development occurs during embryogenesis, and postnatal changes are primarily concerned with growth. The central nervous system is unusual in that a considerable amount of morphological development, cell differentiation and acquisition of function, takes place during postnatal development. As yet, the molecular mechanisms underlying these complex developmental processes are not well understood. In order to identify markers for these developmental processes, we have analyzed the expression profiles, during postnatal murine brain development, of approximately 25,000 transcripts. This analysis, performed at day 1, day 10, day 20 and day 42 of postnatal development, identified a large number of developmentally regulated genes which we have assigned into three broad expression categories.
Results: Expression levels at four timepoints during postnatal murine brain development were established for approximately 25,000 gene transcripts. Approximately 1% of the genes examined displayed a developmentally regulated pattern of expression and we provide all the necessary information required to easily obtain molecular markers for a subset of these developmentally regulated transcripts. Of this subset, 61 showed increasing expression during development, 61 showed decreasing expression during development, and 9 exhibited a peak of expression during this period.
Conclusions: A small percentage of the genes expressed in the postnatal developing brain show changes in expression level during the newborn to adult phase of development. It is likely that these developmentally regulated transcripts represent molecular markers for the complex developmental process occurring in the postnatal brain.
Published: 1 September 2000
GenomeBiology2000, 1(3):research0005.1–0005.11
The electronic version of this article is the complete one and can be found online at http://genomebiology.com/2000/1/3/research/0005 © GenomeBiology.com (Print ISSN 1465-6906; Online ISSN 1465-6914)
Received: 5 April 2000 Revised: 4 July 2000 Accepted: 6 July 2000
Background
For most vertebrate organs and tissues, the majority of devel-opment occurs during embryogenesis, and postnatal changes are primarily concerned with growth. The central nervous system (CNS) is unusual in that a considerable amount of mor-phological development, cell differentiation and acquisition of
function takes place during postnatal development [1,2]. As yet, the molecular mechanisms underlying these complex developmental processes are not well understood.
postnatal developing brain. This analysis formed the base-line for an ongoing study and produced a series of RNA fin-gerprints representing genes transcribed at specific stages of brain development. For our analysis we compared RNA fin-gerprints at four different timepoints during postnatal devel-opment: newborn (day 1), day 10, day 20 and adult (day 42). Incidental to our experimental objective, we also identified a large number of genes which were clearly developmentally regulated in the wild-type mouse brain. We submit this data principally to allow others to isolate specific transcripts with developmentally regulated expression in the postnatal brain without the necessity of performing extensive screening pro-cedures. From a total of approximately 25,000 transcripts displayed, around 200-300 (approximately 1%) exhibited developmentally regulated expression profiles. Here we present groups of RNA fingerprints displaying a subset of these developmentally regulated genes, along with sufficient technical information to replicate specific fingerprints and recover selected cDNAs.
The particular fingerprints presented here were selected on the basis that identical DDRT-PCR profiles were obtained with at least two separate batches of RNA, and that each fin-gerprint displayed at least three developmentally regulated transcripts. On each group of fingerprints we have indicated the position of at least three bands representing the more obviously developmentally regulated genes. We have assigned these marked transcripts into three broad cate-gories as follows: genes for which mRNA levels increase during brain development; genes for which mRNA levels decrease during development; and genes exhibiting a peak in mRNA levels during this developmental period.
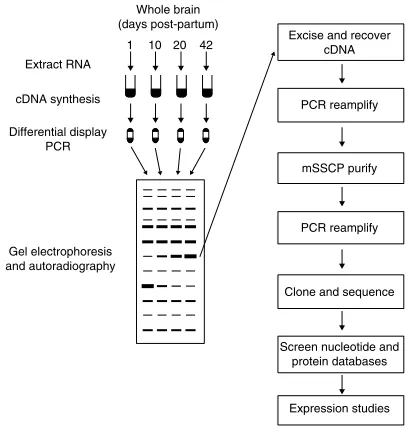
To ensure that changes in DDRT-PCR profiles represent genuine changes in expression levels, two cDNA fragments were recovered and used in downstream expression analy-ses. The overall procedure followed is illustrated in Figure 1 (and see [4]). The northern blot expression profiles of both transcripts accurately replicated the original DDRT-PCR expression profiles, confirming the validity of our approach.
Results
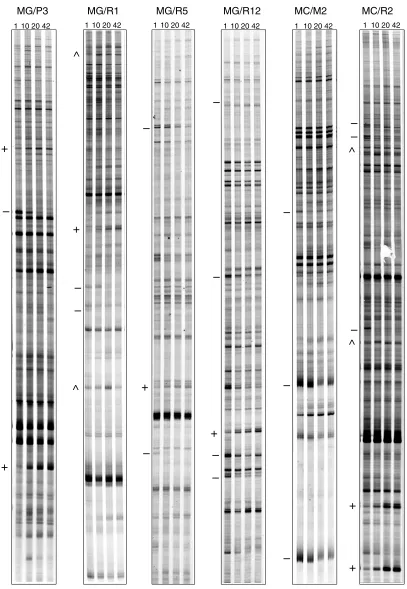
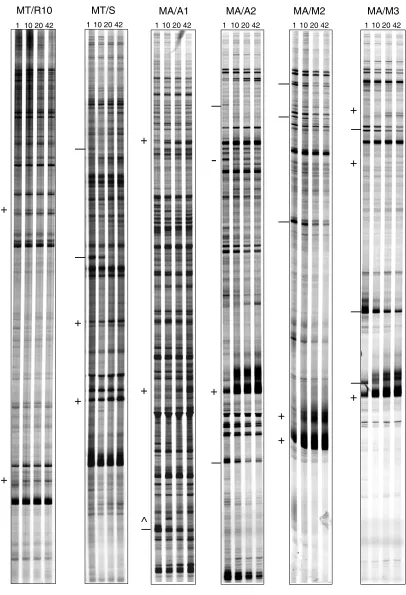
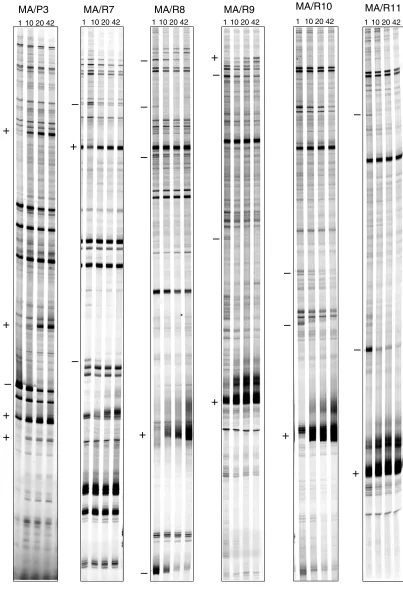
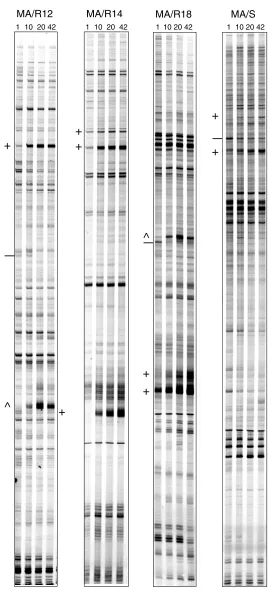
In this study, we have observed a large number of transcripts which apparently increase and/or decrease in expression level during postnatal murine brain development. The period of development under study spanned from day 1 to day 42 post-partum. Figure 2 shows a selection of RNA fingerprints containing bands representing such developmentally regu-lated transcripts. Thirty-four groups of RNA fingerprints were selected on the basis that identical DDRT-PCR profiles were obtained with at least two separate batches of RNA, and that each fingerprint displayed at least three developmentally regulated transcripts. The gel positions of a subset of develop-mentally regulated transcripts are indicated in Figure 2 and individual transcripts are assigned into one of three broad
expression categories: A (+), genes for which mRNA levels increase during brain development; B (-), genes for which mRNA levels decrease during development; and C (^), genes exhibiting a peak in mRNA levels during this developmental period. Of a total of 131 transcripts indicated, 61 are assigned to category A, 61 to category B, and 9 to category C. The sequence details of the primers used to produce the RNA fin-gerprints shown in Figure 2 are contained in Table 1. A detailed description of the various procedures employed and the animals used in this study are presented in the Materials and methods section.
To ensure that developmentally dependent changes in inten-sity of individual DDRT-PCR bands reflected changes in levels of individual mRNAs, two apparently up-regulated transcripts were chosen for further study. The cDNA frag-ments represented by these bands were recovered, purified from co-migrating DNA species by mSSCP [4], cloned and used in northern hybridization studies (Figure 3). For north-ern analyses, whole brain RNA was isolated from a separate batch of animals to those used in the original DDRT-PCR. As can be seen from Figure 3, for both transcripts northern analyses produced expression profiles similar to those observed by DDRT-PCR, thereby validating this approach to identifying developmentally regulated transcripts.
[image:2.609.326.531.89.310.2]Sequence analysis revealed that these cDNA fragments rep-resented portions of the prion Protein (PrP) and of the Thy-1.2 gene transcripts [5,6]. The cloned DNA used as a probe in Figure 3a is identical to nucleotides 588-1,414 of the PrP transcript while that used in Figure 3b is identical to nucleotides 1,599-1,700 of the Thy-1.2 transcript (Figure 4). Figure 1
Differential display procedures; mSSCP: modified single-stranded conformational polymorphism [4].
Whole brain (days post-partum)
Excise and recover cDNA PCR reamplify Extract RNA cDNA synthesis Differential display PCR Gel electrophoresis and autoradiography mSSCP purify PCR reamplify
Clone and sequence
Screen nucleotide and protein databases
comment reviews reports deposited research interactions information
refereed research
This shows that the original DDRT-PCR reactions have amplified an internal fragment of the PrP transcript and the terminal 3′untranslated region (UTR) of the Thy-1.2 tran-script. The PrP fragment was amplified by a combination of arbitrary primer R4 and anchored primer T12CC while the
Thy-1.2 fragment was amplified by a combination of arbi-trary primer P3 and the anchored primer T12CA. For the PrP
fragment, the arbitrary primer showed a 100% match while the anchored primer showed 86% homology (12/14) with the published sequence. In contrast, for the Thy 1.2 fragment, while the anchored primer matched with 100% homology, the arbitrary primer showed only 70% homology (7/10) with the corresponding region of the published sequence.
Conclusions
In the course of analyzing gene expression in the postnatal developing murine brain we have observed that approxi-mately 1% of genes transcribed are developmentally regu-lated. The objective of this report is to permit those interested in such transcripts to selectively isolate specific developmentally regulated transcripts without the necessity of performing an extensive screen. Here we present the RNA fingerprints containing a subset of these developmentally regulated transcripts and we include all the necessary infor-mation to permit individual transcripts to be isolated and identified. We have highlighted a total of 131 developmen-tally regulated transcripts in three broad categories of expression profiles. Of these, approximately 7% (9) fell into category C while the remainder were equally divided between categories A (61) and B (61). We also present confir-matory evidence that changing DDRT-PCR expression pro-files represent genuine alterations in expression levels during brain development. It should be noted that changes in expression profile reflect changes in RNA level per micro-gram total RNA in whole brain and, given that the postnatal brain is not a uniform structure, expression profiles should be interpreted accordingly.
Materials and methods
Collection of tissuesMale animals from an inbred line of 129/Ola mice were used. Animals were humanely sacrificed and whole brains from six individual animals at P1, P10, P20 and P42 stages of postnatal development were collected, flash frozen in liquid nitrogen and stored at -80°C.
RNA extraction
Total RNA was extracted using the RNAzol B method (AMS Biotechnology, Oxon, UK), based on the guanidinium thiocyanate/phenol/chloroform extraction method of Chom-czynski and Sacchi [7]. Following the initial precipitation step, the RNA pellet was washed once with 85% ethanol, resuspended in water, and 0.1 volumes of 3 M sodium acetate (pH 5.2) and 2.5 volumes ethanol were added, the
Table 1
Oligonucleotide sequences of primers used
Anchored primer
dT12AA 5′-d(TTTTTTTTTTTTAA)-3′ dT12GA 5′-d(TTTTTTTTTTTTGA)-3′ dT12CA 5′-d(TTTTTTTTTTTTCA)-3′ dT12AG 5′-d(TTTTTTTTTTTTAG)-3′ dT12GG 5′-d(TTTTTTTTTTTTGG)-3′ dT12CG 5′-d(TTTTTTTTTTTTCG)-3′ dT12AC 5′-d(TTTTTTTTTTTTAC)-3′ dT12GC 5′-d(TTTTTTTTTTTTGC)-3′ dT12CC 5′-d(TTTTTTTTTTTTCC)-3′ dT12AT 5′-d(TTTTTTTTTTTTAT)-3′ dT12GT 5′-d(TTTTTTTTTTTTGT)-3′ dT12CT 5′-d(TTTTTTTTTTTTCT)-3′ Random primer
(arbitrary but defined sequence) P3 5′-d(GCCGTTCCAT)-3′ R1 5′-d(GGAACTCCGT)-3′ R2 5′-d(GGCAAGTCAC)-3′ R4 5′-d(AGGACCGCTA)-3′ R5 5′-d(CGGACCCCGG)-3′ R7 5′-d(TACAACGAGG)-3′ R8 5′-d(TGGATTGGTC)-3′ R9 5′-d(TGGTAAAGGG)-3′ R10 5′-d(TCGGTCATAG)-3′ R11 5′-d(TACCTAAGCG)-3′ R12 5′-d(CTGCTTGATG)-3′ R14 5′-d(GATCGCATTG)-3′ R18 5′-d(GGAACCAATC)-3′ M2 5′-d(CACAGTTTGC)-3′ M3 5′-d(CCACAGAGTA)-3′ S 5′-d(GCGACCCATG)-3′ A1 5′-d(ACAGAGCACA)-3′ A2 5′-d(ACGTATCCAG)-3′ Oligo(dT) primer mix
(poly(A) anchored)
MA Equal mix of dT12AA, dT12GA and dT12CA MG Equal mix of dT12AG, dT12GG and dT12CG MC Equal mix of dT12AC, dT12GC and dT12CC MT Equal mix of dT12AT, dT12GT and dT12CT Extended random primer
5′-d(GTCAGAATTC-random primer)-3′ Extended oligo(dT) primer
Figure 2
Gene expression profiles in the postnatal developing mouse brain. RNA fingerprints produced by specific DDRT-PCR primer combinations at four stages of brain development run in parallel. Anchored primer/arbitrary primer combinations are shown at the top for each group of RNA fingerprints and stages of development are indicated in days (1, 10, 20 and 42). Gel positions of developmentally regulated transcripts in expression category A (+), expression category B (-) and expression category C (^) are highlighted.
MG/P3
1 10 20 42
+
–
+
MG/R5
1 10 20 42
+
–
–
MG/R12
1 10 20 42
+
–
–
–
–
MG/R1
1 10 20 42
^
–
+
–
^
MC/M2
1 10 20 42
–
–
–
MC/R2
1 10 20 42
+
–
–
–
+
^
comment
reviews
reports
deposited research
interactions
information
refereed research
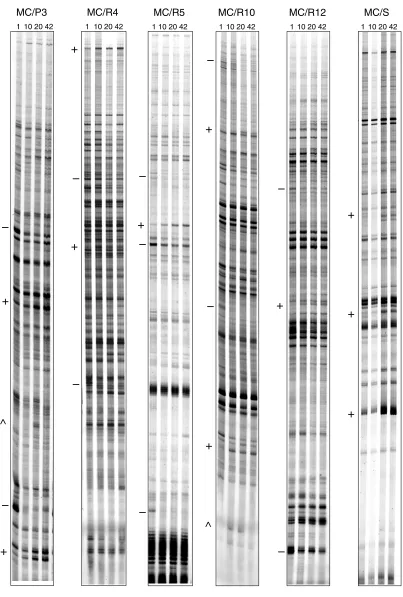
Figure 2 (continued)
Gene expression profiles in the postnatal developing mouse brain. RNA fingerprints produced by specific DDRT-PCR primer combinations at four stages of brain development run in parallel. Anchored primer/arbitrary primer combinations are shown at the top for each group of RNA fingerprints and stages of development are indicated in days (1, 10, 20 and 42). Gel positions of developmentally regulated transcripts in expression category A (+), expression category B (-) and expression category C (^) are highlighted.
MC/P3
1 10 20 42
+
+
–
–
^
MC/R4
1 10 20 42
+
–
–
+
MC/R5
1 10 20 42
–
–
–
+
MC/R10
1 10 20 42
+
–
+
–
^
MC/R12
1 10 20 42
+
–
–
MC/S
1 10 20 42
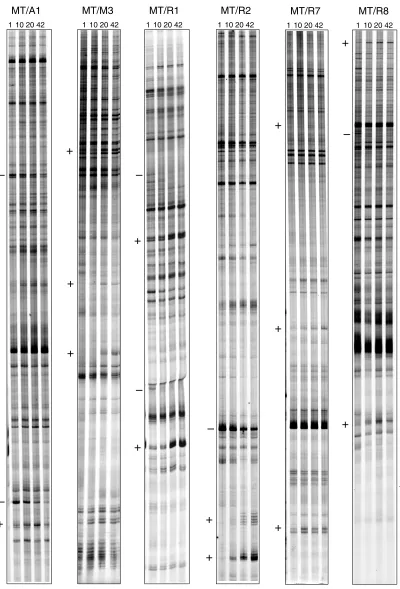
[image:5.609.99.502.84.681.2]Figure 2 (continued)
Gene expression profiles in the postnatal developing mouse brain. RNA fingerprints produced by specific DDRT-PCR primer combinations at four stages of brain development run in parallel. Anchored primer/arbitrary primer combinations are shown at the top for each group of RNA fingerprints and stages of development are indicated in days (1, 10, 20 and 42). Gel positions of developmentally regulated transcripts in expression category A (+), expression category B (-) and expression category C (^) are highlighted.
MT/A1
1 10 20 42
+
–
–
MT/M3
1 10 20 42
+
+
+
MT/R1
1 10 20 42
+
–
–
+
MT/R2
1 10 20 42
+
–
+
MT/R7
1 10 20 42
+
+
+
–
MT/R8
1 10 20 42
+
–
[image:6.609.104.504.86.675.2]comment
reviews
reports
deposited research
interactions
information
refereed research
Figure 2 (continued)
Gene expression profiles in the postnatal developing mouse brain. RNA fingerprints produced by specific DDRT-PCR primer combinations at four stages of brain development run in parallel. Anchored primer/arbitrary primer combinations are shown at the top for each group of RNA fingerprints and stages of development are indicated in days (1, 10, 20 and 42). Gel positions of developmentally regulated transcripts in expression category A (+), expression category B (-) and expression category C (^) are highlighted.
MT/R10
1 10 20 42
+
+
MT/S
1 10 20 42
+
—
—
+
MA/A1
1 10 20 42
+
—
+
^
MA/A2
1 10 20 42
+
—
-—
MA/M2
1 10 20 42
+
—
—
—
+
MA/M3
1 10 20 42
+
—
+
—
—
[image:7.609.94.500.86.681.2]Figure 2 (continued)
Gene expression profiles in the postnatal developing mouse brain. RNA fingerprints produced by specific DDRT-PCR primer combinations at four stages of brain development run in parallel. Anchored primer/arbitrary primer combinations are shown at the top for each group of RNA fingerprints and stages of development are indicated in days (1, 10, 20 and 42). Gel positions of developmentally regulated transcripts in expression category A (+), expression category B (-) and expression category C (^) are highlighted.
MA/P3
1 10 20 42
+
–
+
+
+
1 10 20 42
–
–
+
MA/R7
1 10 20 42
+
–
–
–
–
MA/R8
MA/R9
1 10 20 42
+
–
–
+
MA/R10
1 10 20 42
+
–
–
MA/R11
1 10 20 42
–
–
[image:8.609.99.502.87.676.2]comment
reviews
reports
deposited research
interactions
information
refereed research
Figure 2 (continued)
Gene expression profiles in the postnatal developing mouse brain. RNA fingerprints produced by specific DDRT-PCR primer combinations at four stages of brain development run in parallel. Anchored primer/arbitrary primer combinations are shown at the top for each group of RNA fingerprints and stages of development are indicated in days (1, 10, 20 and 42). Gel positions of developmentally regulated transcripts in expression category A (+), expression category B (-) and expression category C (^) are highlighted.
MA/R12
1 10 20 42
—
+
^
MA/R14
1 10 20 42
+
+
+
MA/R18
1 10 20 42
+
^
—
+
MA/S
1 10 20 42
+
—
[image:9.609.162.440.84.682.2]tubes mixed briefly and RNA stored as ethanol precipitates at -80°C. RNA from six individuals at each timepoint was pooled for DDRT-PCR analysis. For quantitation of total RNA, a small aliquot was removed, pelleted by centrifuga-tion, resuspended in water and the concentration estimated by spectrophotometry. Stock RNA solutions were adjusted to a concentration of approximately 1µg/µl in ethanol suspen-sion. The use of RNAzol B and homogenization of tissue with a Polytron homogenizer resulted in the isolation of total RNA with OD260/280ratios consistently greater than 1.95.
Synthesis of first-strand cDNA
For each sample, a volume of RNA stock solution containing approximately 8µg RNA was transferred to a fresh tube. Samples were centrifuged at 13,000 rpm for 25 minutes and the resulting RNA pellet was washed with 85% ethanol, dried at 45°C for 2 minutes and resuspended in 7µl RNAse-free water. A small portion (2µl) of each sample was re-quantitated by spectrophotometery and 5µg total RNA (in 5µl volume) was used to synthesize first-strand cDNA (First-strand cDNA synthesis kit; Amersham Pharmacia Biotech, Hertfordshire, UK). Reactions contained 1µl DTT (200 mM), 5µl of bulk first-strand mix (containing Moloney murine leukemia virus reverse transcriptase) and 4µl of either d(T)12MA, d(T)12MG, d(T)12MC, d(T)12MT primer (24µM;
M = A, G or C). Reactions were mixed and incubated at 37°C for 1 hour and then heated to 95°C for 10 minutes to inacti-vate reverse-transcriptase. The synthesized cDNA was then dispensed into 1 µl aliquots and stored at -20°C.
Differential display PCR
For differential display PCR reactions, 1µl aliquoted cDNA was diluted to 133µl with water and 10µl of this solution was used for each display PCR (equivalent to the amount of cDNA produced from 25 ng RNA). To each 10µl cDNA on
ice, 2µl arbitrary 10-mer primer (5µM) was added and the solution overlaid with 30µl mineral oil (Sigma, Dorset, UK). Master mix (8µl) containing 2µl 10X PCR buffer (Boehringer Mannheim, East Sussex, UK), 2µl dNTPs (20µM; Amersham Pharmacia Biotech, Hertfordshire, UK), 0.3µl Taq polymerase (1.5 U, Boehringer Mannheim, East Sussex, UK), 2µl (dT)12MN (25µM), 1µl [α-35S]dATP
(1000 Ci/mmol) and 0.7µl dH20 was added to each tube.
Tubes were centrifuged briefly and incubated in a Biometra Unoblock PCR machine at 94°C (2 minutes), followed by 40 cycles of 94°C denaturation (30 seconds), 40°C annealing (2 minutes) and 72°C extension (30 seconds), followed by a final extension step at 72°C for 5 minutes. Type III [8] loading dye (4µl) was added to each tube and 8µl of each sample loaded onto a 6% non-denaturing HR-1000 Geno-myxLR polyacrylamide gel (Beckman Instruments Ltd., Buckinghamshire, UK). Samples were run for 2 hours 15 minutes at 2,700V (50°C) on a GenomyxLR DNA analyzer (Beckman Instruments Ltd., Bucks, UK) The gels were trans-ferred to 3 MM blotting paper, dried and exposed to Bio-maxMR autoradiography film for 16 hours.
[image:10.609.55.298.88.235.2]Recovery of cDNA from dried polyacrylamide gels Gel regions corresponding to bands representing candidate cDNAs were excised from all four lanes using sterile scalpels and transferred to sterile 0.5 ml Eppendorf tubes. Glogos autoradiograph markers (Stratagene, Cambridgeshire, UK) Figure 3
Verification of expression profiles. Downstream analysis of two developmentally regulated transcripts - (a) and (b) are the two transcripts. Candidate cDNAs were selected on the basis of the original DDRT-PCR profile (I), purified from co-migrating sequences by mSSCP (II) and used as probes in northern analysis (III). To correct for variation in RNA loading, northern blot membranes were re-probed for expression of the mouse beta actin gene (IV).
l
lll ll
lV
1 10 20 42
Days post-partum (a) (b) l lll ll lV
1 10 20 42
[image:10.609.317.550.90.327.2]Days post-partum
Figure 4
Origin of DDRT-PCR fragments. Schematic illustrating the position of DDRT-PCR cDNA fragments in relation to full-length transcripts of (a) PrP and (b) Thy-1.2. Black boxes represent transcripts, with open reading frames in white. Areas of transcripts amplified by DDRT-PCR are shown as gray boxes. Sequences of regions matching arbitrary and anchored primers are detailed with
AGGACCGCTA :::::::::: TCCTGGCGAT
::::::::::::
(a) PrP transcript
1 2154 : :: :::: :::::::::::::: 1 1700 GGAAAAAAAAAATC CCTTTTTTTTTTTT
(b) Thy-1.2 transcript
GCCGTTCCAT
GGACAGGGTA
were used to align the gel with the autoradiograph and iden-tical regions were excised from all lanes. The gel fragments were rehydrated at room temperature for 15 minutes in 100µl water, and cDNA eluted at 99°C for 15 minutes before transfer of the liquid phase to fresh 0.5 ml tubes. cDNA was precipitated by the addition of 2.5 volumes ethanol, 0.1 volumes of 3 M sodium acetate (pH 5.2) and 1µl See-DNA (Amersham Pharmacia Biotech, Buckinghamshire, UK), and stored on dry ice for 1 hour. Following centrifugation (13,000 rpm, 25 minutes, 4°C) the pellet was washed in 85% ethanol and resuspended in 4µl of water.
Modified single-strand conformation polymorphism (mSSCP)
For the mSSCP-PCR reaction, 4µl 10X PCR buffer (Boehringer Mannheim, East Sussex, UK), 3.2µl dNTPs (2.5 mM dGTP, dCTP, dTTP; 0.025 mM dATP; Amersham Pharmacia Biotech, Buckinghamshire, UK), 2.5µl anchored primer (20µM), 2.5µl arbitrary primer (20µM), 0.3µl Taq polymerase (1.5 U; Boehringer Mannheim, East Sussex, UK) and 0.5µl [α-33P] dATP (3,000 Ci/mmol) was added to the
DNA and the reaction volume adjusted to 40µl with water. PCR conditions were similar to those used for display-PCR, with the exception that only five cycles were performed. After removal of mineral oil, PCR products were purified by phenol/chloroform/isoamyl alcohol extraction and precipi-tated for 1 hour on dry ice. Pellets were washed, resuspended in 8µl of mSSCP loading buffer (80% deionized formamide, 0.01% bromophenol blue, 0.01% xylene cyanol, 1 mM EDTA, 10 mM NaOH) and denatured at 95°C for 10 minutes before loading onto a 0.5X MDE gel (Flowgen, Staffordshire, UK). Samples were electrophoresed typically for 18 hours at 8 W (25°C) in 0.6X TBE buffer using the Genomyx LR system. Following autoradiography, areas of the gel corresponding to candidate cDNAs were excised and the cDNA eluted and precipitated as described above.
PCR re-amplification of mSSCP-purified candidate cDNAs
A final PCR reamplification of the recovered cDNA was per-formed using modified versions of the arbitrary and anchored primers used in the DDRT-PCR and mSSCP steps. For both the anchored and arbitrary primers, oligonu-cleotides were synthesized with an additional 5′ sequence containing an EcoRI restriction site to aid cloning (referred to as extended primers [9]; see Table 1). Reactions contained 4µl mSSCP purified cDNA, 4µl 10X buffer, 3.2µl dNTPs (10 mM each dATP, dCTP, dTTP, dGTP), 2.5µl extended anchored primer (20µM), 2.5µl extended arbitrary primer (20µM) and 0.5µl Taq polymerase (Boehringer Mannheim, East Sussex, UK) in a 40µl volume.
Samples were denatured at 94°C for 2 minutes and a single round of PCR performed at 94°C for 30 seconds, 40°C for 2 minutes and 72°C for 30 seconds. A further five cycles of PCR were then performed at 94°C for 30 seconds, 58°C for
1 minute and 72°C for 30 seconds, followed by a final extension step of 72°C for 5 minutes.
PCR products were phenol/chloroform extracted, precipi-tated and then subjected to EcoRI restriction endonuclease digestion, prior to further purification and cloning into the
EcoRI site of pBluescript SKII+or KSII+(Stratagene,
Cam-bridgeshire, UK).
Cloned cDNAs were sequenced and the sequences compared to non-redundant GENBANK/EMBL protein and nucleotide databases, using either the GCG [10] or NCBI worldwide web [11] implementation of the BLAST algorithm [12]. Under standard procedures, sequences would also be compared with the GENBANK/EMBL expressed sequence tags (EST) databases and matching I.M.A.G.E. ESTs obtained from the Human Genome Mapping (HGMP) Resource Centre, Cam-bridge [13]. The I.M.A.G.E. clones are then fully sequenced in both directions and the resulting sequence re-checked against the databases to confirm their identity. The expression pro-files of transcripts represented by isolated clones were con-firmed by standard northern procedures [13].
Acknowledgements
This work was supported by a BBSRC programme grant and a MAFF com-mission.
References
1. Noback CR, Strominger NL, Demarest RJ: The Human Nervous System. Philadelphia: Williams and Wilkins, 1995.
2. Akazawa C, Ishibashi M, Shimizu C, Nakanishi S, Kagiyama R: A mammalian helix-loop-helix structurally related to the product of Drosophilaproneural gene atonal is a positive transcriptional regulator expressed in the developing nervous system. J Biol Chem1995, 270:8730-8738.
3. Liang P, Pardee AB:Differential display of eukaryotic messen-ger RNA by means of the polymerase chain reaction. Science
1992, 257:967-971.
4. Miele G, MacRae L, McBride D, Manson J, Clinton M: Elimination of false positives generated through PCR-reamplification of differential display cDNA. Biotechniques1998, 25:138-144. 5. Lee IY, Westaway D, Smit AFA, Wang K, Seto J, Chen L, Acharya C,
Ankener M, Baskin D, Cooper C, et al.: Complete genomic sequence and analysis of the prion protein gene region from three mammalian species.Genome Res1998, 8:1022-1037. 6. Giguere V, Isobe K-I, Grosveld F: Structure of the murine Thy-1
gene. EMBO J1985, 4:2017-2024.
7. Chomczynski P, Sacchi N:Single-step method of RNA isolation by acid guanidium thiocynate phenol chloroform extraction.
Anal Biochem1987, 162:156-159.
8. Maniatis T, Fritsch J, Sambrook EF: Molecular Cloning: A Laboratory Manual.New York: Cold Spring Harbor Laboratory Press, 1982. 9. Miele G, Slee R, Manson J, Clinton M:A rapid protocol for the
authentication of isolated differential display RT-PCR cDNAs.Prep Biochem Biotech1999, 29:245-255.
10. Wisconsin Package Version 10.0 [http://www.oxmol.co.uk/soft-ware/wisconsin/]
11. National Centre for Biotechnology Information[http://www. ncbi.nlm.nih.gov/BLAST/]
12. Altschul SF, Gish W, Miller W, Myers EW, Lipman DJ: Basic local alignment search tool.J Mol Biol1990, 215:403-410.
13. UK Human Genome Mapping Project Resource Centre
[http://www.hgmp.mrc.ac.uk/Biology/descriptions/image.html] comment reviews reports deposited research interactions information