Direct Identification of Pathogens in Urine by Use of a Specific
Matrix-Assisted Laser Desorption Ionization–Time of Flight
Spectrum Database
Lucile Pinault,a,bEric Chabrière,a,bDidier Raoult,a,b Florence Fenollarb,c
aIRD, AP-HM, MEФI, Aix-Marseille Université, Marseille, France bIHU-Méditerranée Infection, Marseille, France
cIRD, AP-HM, SSA, VITROME, Aix-Marseille Université, Marseille, France
ABSTRACT Urinary tract infections are among the most common reasons for anti-microbial treatment, and early diagnosis could have a significant impact by enabling rapid administration of the adapted antibiotic and preventing complications. The current delay between sample receipt and pathogen identification is about 24 to 48 h, which could be significantly shortened by use of an accurate direct method. Matrix-assisted laser desorption ionization–time of flight mass spectrometry (MALDI-TOF MS) is already used for the identification of pathogens in clinical laboratories and constitutes a promising tool for direct diagnosis. A simple preparation protocol was established for the processing of urine samples prior to MS analysis. MALDI-TOF spectra collected directly from 1,000 infected urine samples were used to create a specific reference database (named Urinf). A prospective study was then carried out to evaluate the Urinf database and compare the results obtained with the standard database provided by Bruker on the Biotyper Real Time Classification software. Seven hundred eighty urine specimens were processed and analyzed according to our method. Among them, almost 90% of 500 infected monobacterial samples could be cor-rectly diagnosed with the Urinf database, compared to 50% using the standard data-base. The identification ofEnterobacteriaceae,Staphylococcus aureus,Staphylococcus sap-rophyticus,Pseudomonas aeruginosa,Enterococcus faecalis, andEnterococcus faeciumwas greatly improved but not for Staphylococcus epidermidis. The creation of a database adapted to a particular type of clinical sample has great potential to increase both the rate and rapidity of pathogen identification. Sensitivity still remains to be improved for bacterial species that exhibit few specific peaks on mass spectra.
KEYWORDS bacteriological urine examination, MALDI-TOF, cystitis, diagnosis, urinary tract infection
U
rine specimens are among the most processed samples in clinical laboratories. For instance, our laboratory of bacteriology (Marseille University Hospitals, France) receives approximately 62,050 urine samples per year, which represents about 17% of all biological samples analyzed. As a matter of fact, urinary tract infections (UTIs) are prevalent among bacterial infections (1). Rapid identification of pathogens responsible for UTIs has a significant impact, as it can avoid potentially fatal complications, such as septic shock (2). With the currently established routine methods, 24 to 48 h are required to correctly identify a pathogen present in a urine sample (3). This delay is due to the required culture step and often leads to unnecessary broad-spectrum treatment with an impact on microbiota and bacterial resistance (4). Reducing the delay between receipt of the sample and diagnosis could prevent these problems by allowing faster administration of the appropriate medication.CitationPinault L, Chabrière E, Raoult D, Fenollar F. 2019. Direct identification of pathogens in urine by use of a specific matrix-assisted laser desorption ionization–time of flight spectrum database. J Clin Microbiol 57:e01678-18.https://doi.org/10.1128/JCM .01678-18.
EditorKaren C. Carroll, Johns Hopkins University School of Medicine
Copyright© 2019 American Society for Microbiology.All Rights Reserved.
Address correspondence to Florence Fenollar, fl[email protected].
Received16 October 2018
Returned for modification6 November 2018 Accepted24 January 2019
Accepted manuscript posted online30 January 2019
Published
crossm
28 March 2019
on May 17, 2020 by guest
http://jcm.asm.org/
In recent years, matrix-assisted laser desorption ionization–time of flight mass spectrometry (MALDI-TOF) mass spectrometry (MS) has emerged as a key tool in pathogen identification methods used in clinical laboratories (5). Although this is a revolutionary microbiological technique that allows for robust and rapid identification of bacteria, standard protocols do not have the need to culture the bacteria present in the sample. Indeed, they involve colony picking, and then MS analysis is performed. The generated spectra are compared to a database provided with the software, and the pathogen can be correctly identified in most cases, based on a score calculated between the most similar profiles.
Recent studies have demonstrated that MALDI-TOF MS has great potential to be part of a direct identification protocol performed on urine (6–10). However, we noted that the majority of the direct analysis protocols developed require a large volume of urine sample and a minimum of 105CFU/ml in order to correctly identify the pathogen. It is not always possible to collect 10 ml or more of urine, especially from infants who are commonly affected with UTIs when diagnosed with a bacterial infection (11).
Therefore, we aimed to develop a direct analysis method that could provide rapid identification of a pathogen even with a small amount of sample (1 ml) and low bacterial counts. We realized that the use of the available commercial database generated from isolated colonies is not the most appropriate option for identifying microorganisms in a more complex environment such as urine. In this study, we present a direct method for identifying pathogens in urine using a specific MALDI-TOF spec-trum database entirely created from infected urine specimens.
MATERIALS AND METHODS
Urine sample collection.Urine samples from patients with suspected UTI were collected at Marseille Public University Hospitals in France. In accordance with hospital procedures, urine specimens were transported to the core laboratory of bacteriology (Timone University Hospital, Marseille, France) in sterile containers (BD Vacutainer C&S boric acid kit and sodium borate/formate urine tubes; Becton, Dickinson, Franklin Lakes, NJ, USA). For pediatric patients, the samples were transported either in sterile containers with boric acid or in simple plastic sterile containers without boric acid. All aspects of the study were approved by the local ethics committee (agreement no. 2017-026). Overall, a total of 1,780 urine specimens were tested for this study. A urine sample was considered positive if at least one uropathogen could be clearly identified after a culture step with a colony count of at least 104CFU/ml
and mass spectrometry analysis. One thousand samples diagnosed as positive with a monobacterial infection were used to help create the Urinf database. We then evaluated our database using 500 samples reported as positive and monobacterial, 30 samples reported as positive and infected by 2 identified bacteria, and 250 samples reported as negative (including 170 “sterile” samples and 80 “nonsignificant microbial growth” samples).
Routine urine sample processing for bacterial isolation and identification.The urine samples that were selected for our study and that allowed the creation of our new database were all collected at the core laboratory of bacteriology. When received, each urine sample was analyzed with a Sysmex UF-500i flow cytometry system (bioMérieux, Marcy-l’Etoile, France) that allows the classification and enumeration of particles such as leukocytes or red blood cells. Samples were automatically inoculated on Columbia with 5% sheep blood (COS) agar plates (bioMérieux) with a Previ Isola system (bioMérieux) and then incubated at 37°C for at least 24 h, according to our standard urine culture protocol.
Colonies grown on plates were counted to determine the number of CFU. Bacteria were identified by MALDI-TOF MS on a microflex LT instrument (Bruker Daltonik GmbH, Bremen, Germany) using the Biotyper Real Time Classification 3.0 software and the MBT-BDAL-5627 MSP library (Bruker Daltonik).
Optimized direct identification protocol for bacterial identification.Each urine sample (1 ml) was vigorously mixed with 300l of a 5% saponin solution (Sigma-Aldrich, Saint-Quentin Fallavier, France) and centrifuged at 11,000⫻ g for 5 min. The supernatant was discarded, and 500l of a 10% trifluoroacetic acid solution (Sigma-Aldrich) was added to the resulting pellet. After vortexing, a new centrifugation step at 11,000⫻gwas performed for 5 min. The resulting pellet was washed with 1 ml high-performance liquid chromatography (HPLC)-grade water (VWR, Fontenay-sous-Bois, France) and centrifuged at 11,000⫻ g for 5 min. The supernatant was carefully removed, and 40l of 50% HPLC-grade acetonitrile (VWR) as well as a microspatula covered with micro-glass beads (ⱕ106m; Sigma-Aldrich) were added to the pellet. Several weighings were carried out to evaluate the quantity of glass beads for each sample, which was approximately 70 mg. Cells present were disrupted by lysis cycles on a FastPrep-24 instrument (MP Biomedicals, Santa Ana, CA, USA), which has been used as an alternative to the formic acid (FA) extraction generally recommended by the manufacturers after an accident involving FA and causing severe burns took place in our diagnostic laboratory (12). The obtained mixture was centrifuged at 11,000⫻gfor 5 min. Finally, 1l of the supernatant was spotted in duplicate onto an MSP 96 target polished steel plate (Bruker Daltonik GmbH) and left to dry. Each dry spot was then covered with 1l of the saturated␣-cyano-4-hydroxy-cinnamic acid (HCCA) matrix solution (HCCA in
on May 17, 2020 by guest
http://jcm.asm.org/
50% acetonitrile and 2.5% trifluoroacetic acid; Sigma-Aldrich). Protein analysis was performed with a microflex LT system (Bruker Daltonik GmbH) in the linear positive mode (electrode IS1, 20,00 kV; electrode IS2, 18,05 kV; focalization electrode, 6 kV; laser frequency, 60 Hz; detector gain, 8.8⫻, post-ion-extraction [PIE], 120 ns;m/zrange, 2,000 to 20,000 Da). Species identification was regarded as reliable when scores ofⱖ1.9 were obtained with 2 different spots from a single biological replicate.
Creation and incrementing of the specific urine spectrum database (Urinf database). Immedi-ately after going through the routine urine sample processing, all samples were stored at 4°C until culture results were available (24 to 48 h), as we had previously verified on 100 samples that this storage step did not affect identification results. Positive and monobacterial urine samples were selected for the creation of the urine spectrum database and submitted to our direct identification protocol. All spectra obtained from infected urine samples were evaluated; if the number of peaks and resolution were satisfactory, they were added to the database that we named the Urinf database. Each created reference is an average of 2 spectra collected from 2 deposits of a biological replicate and is named according to the bacterial species found and validated by the routine processing of urine sample at the core laboratory of bacteriology. The Biotyper 3.1 software was used to increment the database with the Biotyper MSP creation standard method.
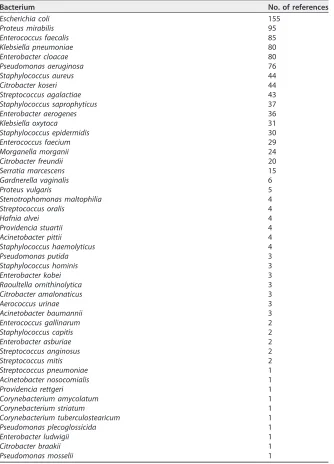
For the Urinf database, spectral evaluation and processing were performed within them/z4,000 to 16,000 Da range to virtually eliminate the␣-defensins triplet of intense peaks atm/zvalues of 3,371.0 Da, 3,442.5 Da, and 3,486.5 Da (13). Their presence constitutes an issue when confronting urine spectra to the Bruker library because those peaks do not appear in the standard spectra of isolated bacteria. It results in lowering the identification scores as they are in the range considered for their calculation. The Urinf database was incremented up to 1,000 references created from 1,000 different urine samples (Table 1). Our database contained a total of 47 different bacterial species, and the number of available references for each species depended on the number of cases observed throughout the study and the quality of the spectra obtained.
Statistical analysis.The Epi Info version 7 program (http://www.cdc.gov/epiinfo/index.html) was used for statistical analyses. A difference was considered statistically significant whenPvalues were ⬍0.05.
RESULTS
Difference between empirical spectra and the commercial database. Urine samples from our core laboratory of bacteriology underwent the developed prepara-tion protocol for protein extracprepara-tion and direct analysis by MALDI-TOF MS using the Biotyper Real Time Classification software. Although obtained spectra exhibited satis-factory numbers of peaks and resolution, poor identification scores were observed in some cases when matching with the Bruker database provided with the Biotyper software (data not shown). Our attention was then drawn to the fact that when looking at the same bacterial species, the spectra directly obtained from infected urine samples are drastically different from those obtained from isolated bacterial colonies on solid culture medium (Fig. 1). The disparity in terms of bacterial environment accounts for this observation and partially explains the lower identification scores obtained, as the standard Bruker database is generated from single-colony analyses. Additionally, the stan-dard processing m/z range (3,000 to 15,000 Da) includes intense peaks of ␣-defensins, abundant peptides involved in the host defense against microbial infections, that appear for urine spectra in the lower molecular weights (m/z⬍4,000 Da) (13, 14). The identification score is considerably reduced due to these peaks in a comparison of spectra with Bruker’s standard database.
Based on these results, it was decided to create a specific database only with spectra obtained directly from urine samples, without a bacterial growth step, and to perform spectral processing over a narrower range ofm/zvalues. The Urinf spectrum database contained 1,000 references created from 1,000 different infected urine samples.
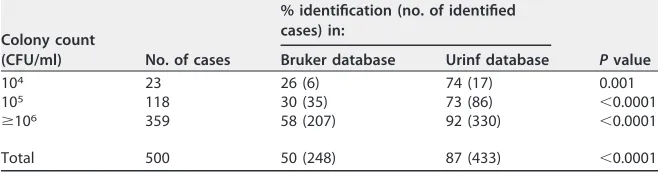
Evaluation of the Urinf database and comparison with the standard Bruker database. Urine specimens from 500 new patients were selected, prepared, and analyzed according to the criteria and protocol detailed above. All the spectra obtained were confronted to both the standard Bruker database and the Urinf database. When we started evaluating the Urinf database, we observed that identification scores were either equal or greater than 1.9 with only correct identifications or lower than 1.4. Therefore, we established the cutoff score at 1.9 instead of the standard 2.0 for our study with both databases. Species identification was regarded as reliable when scores ofⱖ1.9 were obtained with 2 different spectra obtained with 2 different spots from a single biological replicate. The data collected were sorted according to the colony count determined on culture plates for all processed samples (Table 2). Our results were
on May 17, 2020 by guest
http://jcm.asm.org/
concordant with the literature, as we observed that our method was more effective with bacterial counts greater than 105 CFU/ml (92% identification with the Urinf database for bacterial counts of 106 CFU/ml or more), which is the case for most patients suffering from a UTI. When using the standard Bruker database, we obtained 26% of correct identifications for bacterial counts of 104CFU/ml. However, for those same samples, an identification rate of 74% was achieved when matching spectra with the specific Urinf database (P⫽0.001). Overall, we observed that the use of the Urinf database enabled a significant improvement in identification scores (50% correct identifications with the Bruker database and almost 90% with the Urinf database;
[image:4.585.42.376.93.557.2]P⬍0.0001). A total of 19 different bacterial species could be found in the 500 infected urine specimens selected for evaluation of the Urinf database (Table 3). Infections caused byEscherichia coli, which represented more than 40% of studied cases, were correctly diagnosed with a 94% rate, versus 63% when using the standard database
TABLE 1Number of references incremented in the Urinf database for each bacterial species
Bacterium No. of references
Escherichia coli 155
Proteus mirabilis 95
Enterococcus faecalis 85
Klebsiella pneumoniae 80
Enterobacter cloacae 80
Pseudomonas aeruginosa 76
Staphylococcus aureus 44
Citrobacter koseri 44
Streptococcus agalactiae 43
Staphylococcus saprophyticus 37
Enterobacter aerogenes 36
Klebsiella oxytoca 31
Staphylococcus epidermidis 30
Enterococcus faecium 29
Morganella morganii 24
Citrobacter freundii 20
Serratia marcescens 15
Gardnerella vaginalis 6
Proteus vulgaris 5
Stenotrophomonas maltophilia 4
Streptococcus oralis 4
Hafnia alvei 4
Providencia stuartii 4
Acinetobacter pittii 4
Staphylococcus haemolyticus 4
Pseudomonas putida 3
Staphylococcus hominis 3
Enterobacter kobei 3
Raoultella ornithinolytica 3
Citrobacter amalonaticus 3
Aerococcus urinae 3
Acinetobacter baumannii 3
Enterococcus gallinarum 2
Staphylococcus capitis 2
Enterobacter asburiae 2
Streptococcus anginosus 2
Streptococcus mitis 2
Streptococcus pneumoniae 1
Acinetobacter nosocomialis 1
Providencia rettgeri 1
Corynebacterium amycolatum 1
Corynebacterium striatum 1
Corynebacterium tuberculostearicum 1
Pseudomonas plecoglossicida 1
Enterobacter ludwigii 1
Citrobacter braakii 1
Pseudomonas mosselii 1
on May 17, 2020 by guest
http://jcm.asm.org/
(P ⬍0.0001). None of the Proteus vulgaris (1 case), Staphylococcus saprophyticus (6 cases),Serratia marcescens(4 cases), orStreptococcus agalactiae(10 cases) UTIs could be detected with the standard database, but 100%, 83%, 75%, and 40% of those samples were respectively identified using the Urinf database. In a comparison of the correct identifications of each bacterial species between the two databases, the results ob-tained were statistically significant (P⬍0.05) with the Urinf database for a vast majority of pathogens (96% patients of the study). For the remaining bacteria,Pvalues⬎0.05 could be explained by the small number of infected samples available (between 1 and 7 cases for each of those species in the study). The specimens infected with Staphylo-coccus epidermidis were the only ones that could not be diagnosed with our direct analysis protocol and database. Some samples reported as not infected or containing more than one microorganism were also analyzed to verify the robustness of our method. Indeed, 170 samples diagnosed as sterile and 80 specimens recorded as no significant microbial growth were confronted to the Urinf database and provided no positive result. Moreover, 30 specimens with 2 identified pathogens were processed and compared to the Urinf database. For 80% of them, one of the bacteria responsible for the infection was correctly identified and was the most prevalent in 1/3 of cases (for 1/2 of those specimens with a correct identification, both pathogens were estimated to be equally present in terms of CFU per milliliter).
Finally, the potential impact of external factors on identification results was taken into account. Indeed, 50 samples taken from the prospective study were submitted to the preparation protocol by two different operators and analyzed on two different microflex LT systems. A comparison between those results revealed that our method was neither operator dependent nor machine dependent. Moreover, leukocytes and red blood cell counts of the specimens studied were examined to determine if high
[image:5.585.42.547.71.262.2]FIG 1Comparison between MALDI-TOF MS spectra generated from bacterial colonies isolated from urine samples and spectra obtained from direct analysis of those same infected urine specimens.
TABLE 2Evaluation of Urinf database based on percentage and number of correct identifications by colony count
Colony count
(CFU/ml) No. of cases
% identification (no. of identified cases) in:
Pvalue Bruker database Urinf database
104 23 26 (6) 74 (17) 0.001
105 118 30 (35) 73 (86) ⬍0.0001
ⱖ106 359 58 (207) 92 (330) ⬍0.0001
Total 500 50 (248) 87 (433) ⬍0.0001
on May 17, 2020 by guest
http://jcm.asm.org/
[image:5.585.41.370.653.739.2]counts had an impact on the identification rates obtained, but no clear trend could be determined.
Based on all those combined results, we evaluated that our direct analysis protocol followed by comparison to the specific Urinf database had a positive predictive value (PPV) of 1 (457 out of 550 infected samples of the prospective study were detected as positive, and no false positives were observed) and a negative predictive value (NPV) of 0.8 (all 250 sterile and nonsignificant microbial growth specimens were determined to be negative, and 73 out of 550 infected samples were false negatives). The false negatives were all due to low-quality spectra, and no misidentification could be observed. Those numbers make it a reliable test for the rapid diagnosis of an infected sample. It was also noted that our method was more efficient for the identification of Gram-negative bacteria (90% correct identifications) than for Gram-positive bacteria (72% correct identifications).
DISCUSSION
[image:6.585.42.546.488.739.2]In this study, we sought to develop a direct analytical protocol that could be useful even for urine samples with low bacterial counts or available in small quantities and capable of detecting a wide variety of uropathogens without prior culture. When the first MALDI-TOF data were collected after submitting urine specimens to our prepara-tion for direct analysis, identificaprepara-tion scores obtained with the Biotyper software and the standard database were not satisfactory. For bacterial species such asStreptococcus agalactiae, Staphylococcus saprophyticus, Serratia marcescens, and Proteus vulgaris, no identification could even be achieved. While we did not change the acquisition parameters recommended by Bruker (2,000 to 20,000 Da), we tried comparing our collected spectra to the Bruker library only in the range 4,000 to 16,000 Da instead of the standard 3,000 to 15,000 Da. The objective was to eliminate the␣-defensin issue, but the identification results were modestly improved. We observed significant differ-ences between spectra obtained with cultured colonies and spectra obtained with bacteria directly recovered from urine samples, which made us realize that using the standard database was not pertinent in our developed protocol. We therefore decided to create a specific database composed only of spectra generated after direct analysis of urine specimens. This choice proved to be more relevant since the identification
TABLE 3Evaluation of Urinf database based on percentage and number of correct identifications by bacterial species
Bacterium or bacterial group No. of cases
% identification (no. of identified cases) in:
Pvalue
Bruker database Urinf database
Escherichia coli 208 63 (131) 94 (195) ⬍0.0001
Klebsiella pneumoniae 82 50 (41) 91 (75) ⬍0.0001
Enterococcus faecalis 45 51 (23) 84 (38) 0.0007
Proteus mirabilis 30 30 (9) 70 (21) 0.002
Pseudomonas aeruginosa 20 10 (2) 70 (14) 0.0002
Enterobacter cloacae 18 44 (8) 78 (14) 0.04
Enterobacter aerogenes 16 50 (8) 94 (15) 0.008
Citrobacter koseri 13 54 (7) 100 (13) 0.007
Staphylococcus aureus 12 25 (3) 75 (9) 0.02
Klebsiella oxytoca 12 50 (6) 92 (11) 0.03
Streptococcus agalactiae 10 0 (0) 40 (4) 0.04
Staphylococcus epidermidis 7 0 (0) 0 (0) 1
Enterococcus faecium 7 43 (3) 100 (7) 0.03
Staphylococcus saprophyticus 6 0 (0) 83 (5) 0.008
Morganella morganii 5 80 (4) 80 (4) 1
Serratia marcescens 4 0 (0) 75 (3) 0.07
Citrobacter freundii 3 67 (2) 100 (3) 0.5
Raoultella ornithinolytica 1 100 (1) 100 (1) 1
Proteus vulgaris 1 0 (0) 100 (1) 0.5
All Gram-negative bacteria 413 53 (219) 90 (370) ⬍0.0001 All Gram-positive bacteria 87 33 (29) 72 (63) ⬍0.0001
Total 500 50 (248) 87 (433) ⬍0.0001
on May 17, 2020 by guest
http://jcm.asm.org/
scores obtained were significantly improved with use of the Urinf database. Some of the recently published protocols require tedious prehandling, such as a preincubation step (15, 16), dual filtration (16), or diafiltration (17), that would be difficult to imple-ment in a clinical laboratory because of the substantial amount of incoming samples. It was estimated that only 40 to 60 min was necessary to carry out our entire procedure on up to 20 samples and to perform bacterial identification. Evidently, this number could be broadly increased by processing more samples at the same time when implementing this method in a clinical laboratory. Performing Gram stain on a similar number of specimens would require approximately the same amount of time, between slide preparation, fixing, coloration, observation, and interpretation. Therefore, our developed method could provide a feasible substitute and has the significant advan-tage of allowing the diagnosis of the species of uropathogen responsible for UTI, while Gram staining only allows the classification of bacteria into the Gram-negative or Gram-positive group.
Moreover, several studies also recommend a preselection of samples depending on a minimum bacterial load (13, 18–21), which does not always meet clinical recommen-dations (22), and are performed on a limited diversity of microorganisms (17). The use of our specific Urinf database, which currently contains spectra of 47 different micro-organisms, enables the identification of a large variety of pathogens that can even be broadened by the addition of new references. Additionally, an identification rate of 74% was achieved for patients with lower-level bacteriuria (⬍105CFU/ml). In order to verify the reproducibility of our method, some of the samples used for the evaluation of the Urinf database were pretreated by different operators and analyzed on two microflex LT systems. Based on those results (data not shown), we determined that the elabo-rated procedure was neither operator dependent nor machine dependent. Further-more, the analysis of noninfected samples gave no false-positive result and confirmed that we developed a reliable detection method.
The most common bacteria found in UTIs areEscherichia coli,Klebsiella pneumoniae,
Staphylococcus saprophyticus, andEnterococcusspp., which are involved in 80 to 95% of both complicated and uncomplicated UTIs (1, 23, 24). With our developed method and based on the identification rates obtained, infections caused by those predominant uropathogens could be correctly diagnosed with an identification rate of about 92%. Therefore, our direct analysis protocol is appropriate for the detection of prevalent microorganisms in community-acquired UTIs.
It is important to note that results reported as incorrect were all due to low-quality spectra and that no misidentification could be observed. We examined red blood cell and leukocyte counts in infected specimens that could not be diagnosed with our protocol, as it was previously reported that they could alter the quality of generated spectra when present in large amounts (19). However, the proportion of patients with a high number of blood cells was roughly the same in a comparison of correctly identified and nondetected specimens, which suggests that they are not correlated with unsatisfactory identification scores. We also compared the proportion with high bacterial load (⬎105CFU/ml) in cases with positive or negative test results. This led us to the observation that 57% of infected patients that could not be diagnosed exhibited bacterial counts of 105 CFU/ml or less, versus 28% for patients who were correctly diagnosed, which could partially account for low identification rates.
Sensitivity remains an issue for bacterial species such asStaphylococcus epidermidis
that could not be detected.Staphylococcus epidermidisinfections are nosocomial and mostly affect catheterized patients (25). Our result could be explained by the spectra obtained for specimens infected with that pathogen. Indeed, only a few specific peaks could be found in the processing range ofm/z4,000 to 16,000 Da, which can account for the low matching scores obtained in a comparison to the Urinf database. Incre-menting the Urinf database with moreStaphylococcus epidermidisreferences or devel-oping a bioinformatics tool to improve spectrum processing could help solve this issue. In conclusion, our developed screening method enables the rapid identification of uropathogenic bacteria. As a first step for incorporating this technology into a clinical
on May 17, 2020 by guest
http://jcm.asm.org/
laboratory, our protocol could be implemented for specific patient populations with a need for rapid diagnosis, such as kidney transplant patients or pediatric newborns. Besides, a combined procedure could be created by coupling it with a direct antibiotic susceptibility test (AST), as suggested by Zboromyrska et al. (26), as soon as a positive result is reported. Possibilities of incrementation of the Urinf database with new references are virtually infinite and could continuously improve sensitivity and identi-fication scores.
ACKNOWLEDGMENTS
This study was supported by the Institut Hospitalo-Universitaire (IHU) Méditerranée Infection, the National Research Agency under the program “Investissements d’avenir,” reference ANR-10-IAHU-03, the Région Provence-Alpes-Côte d’Azur, and European funding FEDER PRIMI.
We thank Christophe Flaudrops, Chloé Talarmin, and Marie Boyer for their assistance and technical support.
D.R. and F.F. conceived and designed the study. L.P., E.C., and F.F. analyzed and interpreted data. All authors drafted the manuscript and/or worked on critical revisions, and all authors read and approved the final manuscript.
The preparation protocol and the Urinf database are the objects of a deposed patent (Publication number EP3212801) for which all authors are listed as inventors.
REFERENCES
1. Flores-Mireles AL, Walker JN, Caparon M, Hultgren SJ. 2015. Urinary tract infections: epidemiology, mechanisms of infection and treatment options. Nat Rev Microbiol 13:269 –284.https://doi.org/10.1038/nrmicro3432. 2. Kumar A, Ellis P, Arabi Y, Roberts D, Light B, Parrillo JE, Dodek P, Wood G,
Kumar A, Simon D, Peters C, Ahsan M, Chateau D, Cooperative Antimicrobial Therapy of Septic Shock Database Research Group. 2009. Initiation of inappropriate antimicrobial therapy results in a fivefold reduction of survival in human septic shock. Chest 136:1237–1248.https://doi.org/10.1378/chest .09-0087.
3. Yan Y, Meng S, Bian D, Quinn C, Li H, Stratton CW, Tang Y-W. 2011. Comparative evaluation of Bruker Biotyper and BD Phoenix systems for identification of bacterial pathogens associated with urinary tract infections. J Clin Microbiol 49:3936 –3939.https://doi.org/10.1128/JCM.05363-11. 4. Zugravu R, Licker M, Berceanu-Va˘duva D, Ra˘dulescu M, Ada˘mut¸ M,
Dragomirescu L, Branea D, Hogea E, Muntean D, Mihaela DP, Moldovan R, Loredana GP. 2006. The establishment of resistance phenotypes for bacteria isolated from outpatients in urine cultures. Roum Arch Micro-biol Immunol 65:93–99.
5. Seng P, Drancourt M, Gouriet F, La Scola B, Fournier P-E, Rolain JM, Raoult D. 2009. Ongoing revolution in bacteriology: routine identifica-tion of bacteria by matrix-assisted laser desorpidentifica-tion ionizaidentifica-tion time-of-flight mass spectrometry. Clin Infect Dis 49:543–551.https://doi.org/10 .1086/600885.
6. Huang B, Zhang L, Zhang W, Liao K, Zhang S, Zhang Z, Ma X, Chen J, Zhang X, Qu P, Wu S, Chen C, Tang Y-W. 2017. Direct detection and identification of bacterial pathogens from urine with optimized speci-men processing and enhanced testing algorithm. J Clin Microbiol 55: 1488 –1495.https://doi.org/10.1128/JCM.02549-16.
7. Íñigo M, Coello A, Fernández-Rivas G, Rivaya B, Hidalgo J, Quesada MD, Ausina V. 2016. Direct identification of urinary tract pathogens from urine samples, combining urine screening methods and matrix-assisted laser desorption ionization–time of flight mass spectrometry. J Clin Microbiol 54:988 –993.https://doi.org/10.1128/JCM.02832-15. 8. Sánchez-Juanes F, Siller Ruiz M, Moreno Obregón F, Criado González M,
Hernández Egido S, de Frutos Serna M, González-Buitrago JM, Muñoz-Bellido JL. 2014. Pretreatment of urine samples with SDS improves direct identification of urinary tract pathogens with matrix-assisted laser de-sorption ionization-time of flight mass spectrometry. J Clin Microbiol 52:335–338.https://doi.org/10.1128/JCM.01881-13.
9. Ferreira L, Sánchez-Juanes F, González-Avila M, Cembrero-Fuciños D, Herrero-Hernández A, González-Buitrago JM, Muñoz-Bellido JL. 2010. Direct identification of urinary tract pathogens from urine samples by matrix-assisted laser desorption ionization-time of flight mass
spectro-metry. J Clin Microbiol 48:2110 –2115. https://doi.org/10.1128/JCM .02215-09.
10. Kitagawa K, Shigemura K, Onuma K, Nishida M, Fujiwara M, Kobayashi S, Yamasaki M, Nakamura T, Yamamichi F, Shirakawa T, Tokimatsu I, Fu-jisawa M. 2018. Improved bacterial identification directly from urine samples with matrix-assisted laser desorption/ionization time-of-flight mass spectrometry. J Clin Lab Anal 32:e22301.https://doi.org/10.1002/ jcla.22301.
11. Sutton AG, Chandler N, Roberts KB. 2017. Recent studies on the care of first febrile urinary tract infection in infants and children for the pediatric hospitalist. Rev Recent Clin Trials 12:269 –276.https://doi.org/10.2174/ 1574887112666170816143639.
12. Gouriet F, Ghiab F, Couderc C, Bittar F, Tissot Dupont H, Flaudrops C, Casalta J-P, Sambe-Ba B, Fall B, Raoult D, Fenollar F. 2016. Evaluation of a new extraction protocol for yeast identification by mass spectrometry. J Microbiol Methods 129:61– 65.https://doi.org/10.1016/j.mimet.2016.08 .001.
13. Köhling HL, Bittner A, Muller K-D, Buer J, Becker M, Rubben H, Rettenmeier AW, Mosel F. 2012. Direct identification of bacteria in urine samples by matrix-assisted laser desorption/ionization time-of-flight mass spectrometry and relevance of defensins as interfering factors. J Med Microbiol 61: 339 –344.https://doi.org/10.1099/jmm.0.032284-0.
14. Ganz T. 2003. Defensins: antimicrobial peptides of innate immunity. Nat Rev Immunol 3:710 –720.https://doi.org/10.1038/nri1180.
15. Haiko J, Savolainen LE, Hilla R, Pätäri-Sampo A. 2016. Identification of urinary tract pathogens after 3-hours urine culture by MALDI-TOF mass spectrometry. J Microbiol Methods 129:81– 84.https://doi.org/10.1016/ j.mimet.2016.08.006.
16. Veron L, Mailler S, Girard V, Muller BH, L’Hostis G, Ducruix C, Lesenne A, Richez A, Rostaing H, Lanet V, Ghirardi S, van Belkum A, Mallard F. 2015. Rapid urine preparation prior to identification of uropathogens by MALDI-TOF MS. Eur J Clin Microbiol Infect Dis 34:1787–1795.https://doi .org/10.1007/s10096-015-2413-y.
17. DeMarco ML, Burnham C-AD. 2014. Diafiltration MALDI-TOF mass spec-trometry method for culture-independent detection and identification of pathogens directly from urine specimens. Am J Clin Pathol 141: 204 –212.https://doi.org/10.1309/AJCPQYW3B6JLKILC.
18. Burillo A, Sánchez B, Ramiro A, Cercenado E, Rodríguez-Créixems M, Bouza E. 2014. Gram-Stain Plus MALDI-TOF MS (matrix-assisted laser desorption ionization-time of flight mass spectrometry) for a rapid diagnosis of urinary tract infection. PLoS One 9:e86915.
https://doi.org/10.1371/journal.pone.0086915.
19. Wang X-H, Zhang G, Fan Y-Y, Yang X, Sui W-J, Lu X-X. 2013. Direct identification of bacteria causing urinary tract infections by combining
on May 17, 2020 by guest
http://jcm.asm.org/
matrix-assisted laser desorption ionization-time of flight mass spectrom-etry with UF-1000i urine flow cytomspectrom-etry. J Microbiol Methods 92: 231–235.https://doi.org/10.1016/j.mimet.2012.12.016.
20. Ferreira L, Sánchez-Juanes F, Muñoz-Bellido JL, González-Buitrago JM. 2011. Rapid method for direct identification of bacteria in urine and blood culture samples by matrix-assisted laser desorption ionization time-of-flight mass spectrometry: intact cell vs. extraction method. Clin Microbiol Infect 17:1007–1012.https://doi.org/10.1111/j.1469-0691.2010 .03339.x.
21. Angaali N, Vemu L, Padmasri C, Mamidi N, Teja V. 2018. Direct identifi-cation and susceptibility testing of Gram-negative bacilli from turbid urine samples using VITEK2. J Lab Physicians 10:299.https://doi.org/10 .4103/JLP.JLP_118_17.
22. Schmiemann G, Kniehl E, Gebhardt K, Matejczyk MM, Hummers-Pradier
E. 2010. The diagnosis of urinary tract infection: a systematic review. Dtsch Aerztebl Int 107:361–367.
23. Köves B, Wullt B. 2016. The roles of the host and the pathogens in urinary tract infections. Eur Urol Suppl 15:88 –94. https://doi.org/10 .1016/j.eursup.2016.04.005.
24. Ronald A. 2002. The etiology of urinary tract infection: traditional and emerging pathogens. Am J Med 113:14S–19S.
25. Otto M. 2009. Staphylococcus epidermidis—the “accidental” pathogen. Nat Rev Microbiol 7:555–567.https://doi.org/10.1038/nrmicro2182. 26. Zboromyrska Y, Rubio E, Alejo I, Vergara A, Mons A, Campo I, Bosch J,
Marco F, Vila J. 2016. Development of a new protocol for rapid bacterial identification and susceptibility testing directly from urine samples. Clin Microbiol Infect 22:561.e1–561.e6.https://doi.org/10.1016/j.cmi.2016.01 .025.