© 2015, IRJET ISO 9001:2008 Certified Journal Page 810
Mammogram Image Features Extraction and Classification for Breast
Cancer Detection.
Snehal A. Mane
1, Dr. K. V. Kulhalli
21
P.G.Student, Department Of Electronics & Telecommunication Engg, D.Y.Patil College of Engineering&
Technology, Kolhapur
2
Vice Principal, H.O.D (I.T),Department of Information Technology, D.Y.Patil College of Engineering&
Technology, Kolhapur
---***---Abstract -
Every time the early detection of diseases can be the difference between life and death of a human. Breast cancer is the most commonly occurring cancer in women. Early detection of breast cancer is important step in diagnosis. In this paper, we present a method for classification of medical images. It can be achieved using digital mammography. Mammography is most reliable and widespread method for early detection of breast cancer. The proposed system has three major steps- Preprocessing, Feature Extraction and Classification. The Preprocessing stage involves image acquisition and image enhancement using. Feature extraction methodologies analyze objects and images to extract the most important features that represent various classes of objects. Gabor Wavelet based features are used as inputs to classifier that assign them to the class that they represent.Key Words:
Gabor Wavelet 1, Support Vector
Machine 2, Mammography etc.
1.
INTRODUCTION
In the today’s 21st century world, which runs on
fast food , the possibilities of dreadful diseases have increased by a lot amount. Thus , the early detection of these diseases can be the difference between life and death.
Image manipulation is commonly used in image processing and pattern recognition field. Image manipulation may include quality enhancement, filtering, segmentation, feature selection or extraction and dimensionality reduction. When it comes to image classification, it is desirable to keep discriminate features and discard non-relevant features that may negatively
affects the classification performances. Mammographic images are X-ray images of breast region displaying points with high intensities density that are suspected of being potential tumors. Automatic tumor detection is extremely challenging as the suspicious calcification or masses appear as free shape and irregular texture, so that no precise patterns can be associated to them.
Several techniques have been proposed to analyze,[1] detect or to extract features from mammogram images. Haar wavelets along with PCA are proposed by Swiniarski et al. to extract relevant features, and rough sets methods are further employed to classify the resulting features. Recently, the authors extended the work by extracting independent component feature. According to E.Catanzarti et al software architecture of Computer Aided Detection (CAD) system for Microcalcification based on Gabor transform known as GNNCAD (Gabor Neural Network CAD systems) is used.
2.
LITERATURE REVIEW
1) U.S.Ragupathy, T.Saranya et.al [2012] [1]
This paper reviews the new method for improving detection of architectural distortion and mass in mammographic images using Gabor wavelets and Adaptive Neuro-Fuzzy based classification. The suitable features are selected from the set of extracted features and given as input to ANFIS for classification.[1]
2) S.N. Deepa and B. Aruna Devi et.al [2011]
[2]
© 2015, IRJET ISO 9001:2008 Certified Journal Page 811
Artificial Neural Network forms the base of the intelligent systems. There are numerous instances wherever artificial intelligence is use for the diagnosis of the chest cancer. The intelligent computing techniques can be used for diagnostic sciences in biomedical image classification. [2]
3.
PROPOSED
SYSTEM
A simplified block diagram of proposed system is depicted in following fig .1
Fig -1: Block schematic of Proposed System
4.
IMAGE PREPROCESSING
The preprocessing plays an important role in any CAD system. A preprocessing phase of the images is necessary to improve the quality of the images and make the feature extraction phase more reliable.
Wiener filter tries to build an optimal estimate of original image by enforcing a smallest mean square error constraint between estimate and original image. Wiener filter is an optimum filter. Objective of a wiener filter is to minimize mean square error. Wiener filter has capability of handling both degradation function and also noise. From degradation model, error between input signal f (m, n) and estimated signal f (m, n) is given by
(1)
Square error is given by
(2)
Mean square error is given by
(3)
Wiener filters are class of optimum linear filters which occupy linear estimation of preferred signal sequence from another related sequence.
Wiener
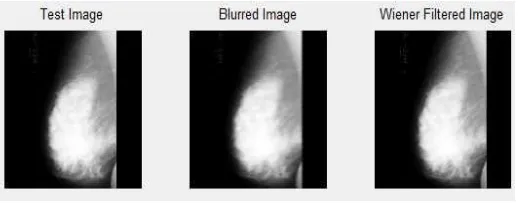
filtering is superior. It gives the optimal way of tapering off the noisy components, so as to give the best reconstruction of the original signal. Can be applied in spatial basis i.e. delta functions or pixels, Fourier basis i.e. frequency components, wavelet basis, etc.Wiener filtering is a general way of finding best reconstruction of a noisy signal. It applies in any orthogonal function basis and Different bases give different results.In this proposed system, wiener filter is used. Following image is the example of Wiener filter. Fig 2 represents Weiner filters for mammogram images and simulation results for database images input images, salt and pepper noise image, Gaussian noise image, speckle noise image, reconstructed salt and pepper image, reconstructed Gaussian image, reconstructed speckle image, respectively.
Fig 2: Wiener filter image
To reduce the noise and normalize the staining intensity variation, Wiener filter and histogram based contrast enhancement have been used. Figure 2 represents results of pre-processing.[5]
5.
Segmentation
In segmentation methods divide the image into number of small segments.
The goal of segmentation is to identify the correct areas and to analyse the diagnosis. In this proposed system active counter is used. Automatic Seeded Region increasing using haralick texture features are as follows
Divide improved ROI into RxR nonoverlapping blocks. If block is too tiny, difference of mass textures starting typical textures cannot be fine characterized. If it is too huge, result may be too common compute Haralick texture features starting Spatial Gray Level Dependence 23 Matrix (SGLD) of every block.
Image
Acquisition
Image
Processing
Segmentation
Classification
Feature
[image:2.595.26.278.236.370.2] [image:2.595.308.567.334.438.2]© 2015, IRJET ISO 9001:2008 Certified Journal Page 812
Select significant features that can easily distinguish mass and non mass region. Select blocks that contains mass based on features
Maximum gray level of that block is seed point.
Region growing initiates from that point moreover then raise iteratively and aggregate with pixels that have like properties .
Approximate segmented mass to a circle .
Estimate radius of circle and compare it with ground truth data.
This comparison will provide results how close segmented mass to ground 24 truth mass determined by expert radiologists.
Extract the mass region from original image that is used as an input for classification.
Seed point is automatically selected that correspond to maximum Sum Average feature value. Segmented image is smoothed using some morphological operators like dilation, erosion, imopen and imclose. Extracted mass is approximated to a circle and compare it’s radius to the original radius 42 .Extracted mass is used as an input to the classification stage.
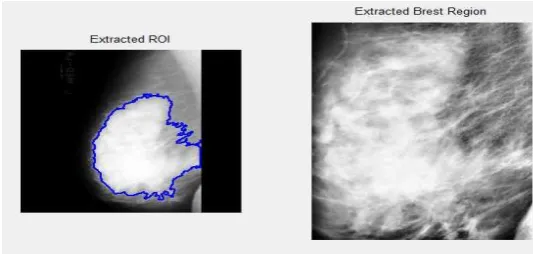
[image:3.595.35.302.510.637.2]The segmentation stage takes the image and separates the different logical parts. Segmentation is process of partitioning a picture into semantically interpretable regions. Simulation Results of ROI Extraction is shown in following diagram.
Fig 3: ROI Extraction
6.
FEATURE EXTRACTION
In mammography image the spatial resolution of x-ray which is in the order of few microns permits to visualize masses.
But the conventional mammograms are highly textured and complex. This makes the interpretation difficult. For this reason, it is necessary to extract features from the mammogram to improve performances of the diagnosis in terms of precision and reliability. The feature extraction and selection from an image plays a critical role in the performance of any classifier. Higher accuracy of the classifier can be achieved by the selection of optimum feature set
.
Fig 4: Feature Extraction.
Figure 4 shows simple block diagram of Feature Extraction. After segmentation phase, collections of features are required for each image. In the feature extraction phase each picture is assigned feature vector to recognize it.
This vector is used to distinguish image. Gabor Wavelet is used for Feature Extraction. In mammography picture spatial resolution of X ray which is in order of a little number of microns allows to envision masses. Although conventional mammograms are extremely textured and complex. This makes interpretation tricky. For this reason, it is necessary to take out features from mammogram to progress performances of diagnosis in terms of accuracy and consistency. The feature extraction as well as selection from image acting a critical role in presentation of any classifier. Superior accuracy of classifier can be achieved by selection of best possible feature set.
© 2015, IRJET ISO 9001:2008 Certified Journal Page 813
A complex Gabor wavelet (filter) is defined as the product of a Gaussian kernel with a complex sinusoid. A 2D Gabor wavelet transform is defined as the convolution of the image I(z):
…………. (4) With a family of Gabor filters (functions):
……… .(5) Where z = (x, y) and k is the characteristic wave vector:
………. (6) With
………….(7) The parameters ν and μ define the frequency and orientation of the filter.
PCA is the simplest of the true eigenvector-based multivariate analyses. Often, its operation can be thought of as revealing the internal structure of the data in a way that best explains the variance in the data. If a multivariate dataset is visualized as a set of coordinates in a high-dimensional data
space, PCA can supply the user with a lower-dimensional picture, a "shadow" of this object when viewed from its most informative viewpoint. This is done by using only the first few principal components so that the dimensionality of the transformed data is reduced.[3,4]
Fig 5: Gabor filter
(size 5*8 with 40 Orientation and Normal Aspect ratio)
5. CLASSIFICATION
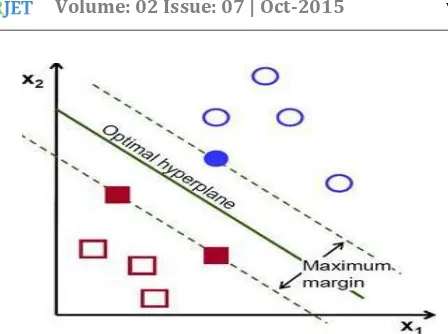
Support vector machines (SVM) are based on the Structural Risk Minimization principle [14] from statistical learning theory. SVM is also applied on different real world problems such as face recognition, cancer diagnosis and text categorization. The idea of structural risk minimization is to find a hypothesis h with the lowest true error. Vapnik connects the bounds on the true error with the margin of separating hyper planes. In their basic form, support vector machines find the hyper plane that separates the training data with maximum margin. SVM is a useful technique for data classification. A classification task usually involves with training and testing data which consist of some data instances.
© 2015, IRJET ISO 9001:2008 Certified Journal Page 814
Fig 6: Support Vector Machine with a hyper plane Since an SVM is a classifier, then given a set of training examples, each marked as belonging to one of two categories, an SVM training algorithm builds a model that predicts whether a new example falls into one category or the other. More formally, a support vector machine constructs a hyper plane or set of hyper planes in a high or infinite dimensional space, which can be used for classification, regression or other tasks. Intuitively, a good separation is achieved by the hyper plane that has the largest distance to the nearest training data points of any class (so-called functional margin), since in general the larger the margin the lower the generalization error of the classifier.
6. CONCLUSIONS
The proposed system has been developed for diagnosing of breast cancer from mammogram pictures. In first stage, the preprocessing on mammogram picture is done which minimize the computational cost and maximize the probability of accuracy. To summarize the developed method, the initial step, based on gray level information of image enrichment and segments the chest cancer. In second stage Gabor Wavelet features are extracted.
The images are taken from MIAS database which includes of 41 normal images and 85 abnormal images. The abnormal images are more classified into two classes which are benign and malign. There are total 64 benign images and 21 malign images. To remove irrelevant background information like breast contour, patches of 140 into 140 pixels surrounding the oddity region were extracted from original 1024 into 1024 pixels images. Patch size assures that, for most odd cases not only the oddity region is captured but also the surrounding area, providing us information about the oddity shape. The
doctor is always responsible for the final interpretation of a medical image.
REFERENCES
[1] S.M.Salve, V.A.Chakkarwar et .al “Classification of Mammographic images using Gabor Wavelet and Discrete Wavelet Transform” International Journal Of advanced research in ECE ISSN:2278-909X,Vol. 2 pp.573-578, May 2013.
[2] R. Swiniarski,T. Luu, A. Swiniarska, H. Tanto, “Data Mining and Online Recognition of Mammographic Images based on Haar Wavelets, Principal Component Analysis and Rough Sets Methods”, International SPIE Symposium Medical Imaging, pp. 17–23, 2001.
[3] M. R. Turner, “Texture Discrimination by Gabor functions,” Biological Cybernetics, vol. 55, pp. 71– 82, 1986.
[4] Mammographic Image Analysis Society, http://www.wiau.man.ac.uk/services/MIAS/MIAS web.html
[5] Duan, Kai-Bo; and Keerthi, S. Sathiya, “Which Is the Best Multiclass SVM Method? An Empirical Study”. Proceedings of the Sixth International Workshop on Multiple Classifier Systems 2005.
[6] Hsu, Chih-Wei; and Lin, Chih-Jen, “A Comparison of Methods for Multiclass Support Vector Machines”, IEEE Transactions on Neural Networks 2002. [7] U.S.Ragupathy,T.Saranya et.al “Gabor Wavelet
based Detection of Architectural Distortion and Mass in Mammographic Images and Classification using Adaptive Neuro Fuzzy Inference System” International Journal of Computer Applications, Vol. 46– No.22,pp. 0975 – 8887, May 2012.
[8] S.N. Deepa ,B. Aruna Devi et.al “A survey on artificial intelligence approaches for medical image classification”, Indian Journal of Science and Technology, Vol. 4 No. 11 ,pp. 1583-1594, Nov 2011.
[9] Amir Rajaei, Lalitha Rangarajan et.al “Wavelet Features Extraction for Medical Image Classification” An International Journal of Engineering Sciences ISSN: 2229-6913 Issue, Vol. 4,pp. 131-141, Sept 2011.
[image:5.595.46.270.68.235.2]