The role of visual management in collaborative integrated planning and control for engineerto order building systems
Original Citation
Viana, Daniela, Formoso, Carlos Torres, Wesz, Josana and Tzortzopoulos, Patricia (2014) The role of visual management in collaborative integrated planning and control for engineertoorder
building systems. In: Proceedings of the 22nd Annual Conference of the International Group for Lean Construction. IGLC22, 2 . IGLC and Akademika forlag, Oslo, Norway, pp. 775787. ISBN 9788232104604
This version is available at http://eprints.hud.ac.uk/id/eprint/23272/
The University Repository is a digital collection of the research output of the University, available on Open Access. Copyright and Moral Rights for the items on this site are retained by the individual author and/or other copyright owners. Users may access full items free of charge; copies of full text items generally can be reproduced, displayed or performed and given to third parties in any format or medium for personal research or study, educational or notforprofit purposes without prior permission or charge, provided:
• The authors, title and full bibliographic details is credited in any copy;
• A hyperlink and/or URL is included for the original metadata page; and
• The content is not changed in any way.
For more information, including our policy and submission procedure, please contact the Repository Team at: [email protected].
THE ROLE OF VISUAL MANAGEMENT IN
COLLABORATIVE INTEGRATED PLANNING
AND CONTROL FOR ENGINEER-TO-ORDER
BUILDING SYSTEMS
Daniela Viana1, Carlos Formoso2, Josana Wesz3 and Patrícia Tzortzopoulos4
ABSTRACT
Visual Management is a key approach in the implementation of Lean Production. It emphasizes the importance of developing easy-to-understand visual devices for sharing knowledge within an organization. Such visual devices can play an important role in mitigating the complexity of engineer-to-order production systems. A major difficulty in managing engineer-to-order prefabricated building systems is the need to integrate planning and control of different processes, such as design, fabrication and assembly on site, in a multiple project environment. This paper reports preliminary findings on the implementation of visual devices for collaborative and integrated planning and control in a Steel Fabricator, which designs, fabricates and assembles steel structures. The aim of this paper is to understand how visual management tools can contribute to improve the effectiveness of planning and control in this environment. A set of visual devices have been used in the planning and control system in this company, including a panel that makes available information about 200 simultaneous contracts in an easy-to-understand way. The implementation of those tools has enhanced the participation of different people in the planning process from operational levels or from the different production units.
KEYWORDS
Visual Management, Collaborative planning, Engineer-to-order
INTRODUCTION
Visual Management (VM) is one of the key approaches in the implementation of Lean Production, as it provides an easy to understand way to share production information (Liker 2003). This is achieved by making the main process flows visible and easy to understand from start to finish, through organizational and physical means, measurements, and public display of information (Koskela 2000). However,
1 Ph.D Candidate, Building Innovation Research Unit (NORIE), Federal University of Rio Grande
do Sul (UFRGS), Porto Alegre, RS, Brazil. Phone +55 51 33083518, [email protected] 2 Ph.D., Associate Professor, Building Innovation Research Unit (NORIE), Federal University of
Rio Grande do Sul (UFRGS), Porto Alegre, RS, Brazil. Phone +55 51 33083518, [email protected]
3 M.Sc. Candidate, Building Innovation Research Unit (NORIE), Federal University of Rio Grande
do Sul (UFRGS), Porto Alegre, RS, Brazil. Phone +55 51 33083518, [email protected] 4 Professor, School of Art, Design and Architecture, Department of Architecture and 3D Design,
an overload of information may hinder people from doing what they should. For Galsworth (1997) information must be pulled as needed, exactly where and when is needed. Therefore it must be fresh and available at a glance, physically close to the process as possible so that it becomes indistinguishable from it (Galsworth 1997).
VM supports the achievement of transparency by sharing the most valuable information and removing information barriers in a given workplace (Koskela 1992; Tezel 2011). It is an orientation towards visual control in production, quality and workplace organization (Greif 1991). Symbols, signs, colours, sometimes sounds and odour not only convey information but also limit responses in varying degrees (Tezel 2011). It can be understood as a standard to be applied from which deviations are immediately recognizable (Koskela 1992).
The need of up-to-date information about processes is increased when flexible outputs are necessary, since changes in product specification and personnel assignments require precise and immediate dissemination (Formoso et al. 2002). For Kurtz and Snowden (2003) even in a chaotic and non-predictable production environment the development of tools to share the right information is a way of mitigating the complexity in these production systems.
When a process is transparent, the main source of information is the process itself, breaking the common hierarchical structure of order giving (Greif 1991). The way information is shared would also affect the way production is managed. There is a strong link between the incidence of non-value adding activities and information deficits in the workplace (Formoso et al. 2002). Instead of carrying out value adding activities, people often spend most of their time searching, wandering, or waiting for the tools, materials, and information they need in order to do their work (Galsworth 1997).
The use of VM may also bring benefits for the planning and control system, by making available production information in an opportunistic way, in which planning decisions and observations will develop the plan, as suggested by Hayes-Roth and Hayes-Roth (1979). According to Johnston and Brennan (1996), this approach can be understood as a form of management-as-organising, in which managers need to learn from production to precisely define the following goals. For those authors, this approach contrasts with the commonly adopted management-as-planning approach in which managers set the goals previously to the start of the project and controlling is limited to monitoring the progress of activities against a plan. The challenge is that using the management-as-organising approach, managers cannot make a straight connection between goals and operational activities, which is actually largely illusory in a highly uncertain environment (Johnston and Brennan 1996).
The use of VM tools increases the capacity for processing information and reduces the feedback time for action-taking, so that control can be integrated to execution (Alvarez and Antunes Jr. 2001). Therefore, visual tools might help the implementation of the management-as-organising approach essentially in high uncertain production environments, like the one under analysis in this paper.
each project. Therefore, it can be understood as an engineer-to-order (ETO) production system.
Engineer-to-order environments have become important for the construction industry in emerging economies, due to the growing trend of using prefabricated components. In this kind of production environment there is a strong dependence of the production system on client decisions, which might interfere even in the product specification during the fabrication process. Therefore, a major difficulty in managing engineer-to-order prefabricated building systems is to integrate planning and control of different processes, such as design, fabrication and assembly on site, in a multiple project environment. Therefore, the aim of this paper is to understand how VM tools can contribute for improving the effectiveness of planning and control in such environment.
In the following sections the case study company is briefly described, as well as the production planning and control system that existed at the beginning of this study. Following, the method for defining the visual tools and the implementation process are presented. Lastly, research findings are discussed.
DESCRIPTION OF THE COMPANY
The company involved in this investigation has three business units: (a) light steel structural systems for warehouse and industrial buildings; (b) high rise buildings; and (c) heavy structures for bridges and off-shore platforms. This study is focused on the operations of the first unit.
As stated by Bertrand and Muntslag (1993), an ETO company is usually divided into a series of production units. The main production units of this company are: design, fabrication and assembly. The is also a Planning Department, which is in charge of producing long-term project plans, from design to the delivery of components on site.
The organizational structure is hierarchically arranged, so for each department there is one manager, who leads a team of coordinators. In the assembly department, unlike the others, there are two different managers, one focused on administrative issues and the other focused on controlling production rates. The coordinators of the latter are in charge of managing projects from the beginning of detail design; therefore these coordinators are called project managers.
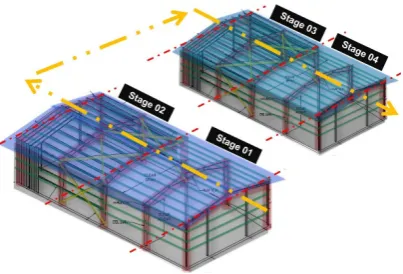
Figure 1: Reduction of batch size by dividing the building into stages
BRIEF DESCRIPTION OF THE PLANNING AND CONTROL SYSTEM
One of the basic problems of the way the planning and control system had been carried out, which was hindering most of improvement attempts, was the focus on maximum utilization of capacity. The management practices worked as if the company was producing a repetitive product, as in a make-to-stock system.
Somanet al. (2007) pointed out that when production depends on customer orders, the focus of production planning should be on order execution. Therefore, performance measurements should be order focused, e.g. average response time and average order delay. When products are made previously to a customer order, such as in a make-to-stock production system, performance measurements are based on utilization of capacity, e.g. line items fill rate, throughput, and average inventory levels.
However, it was possible to observe in this company, on several occasions, the importance given to the amount of tonnages produced, which was one of the main metrics, over the completeness of a stage. The improvements proposed during this research project were focused on making information about the execution process in the construction sites available to the plant, to enable this information to be used as a guide for what should be produced next, instead of only looking at volume metrics.
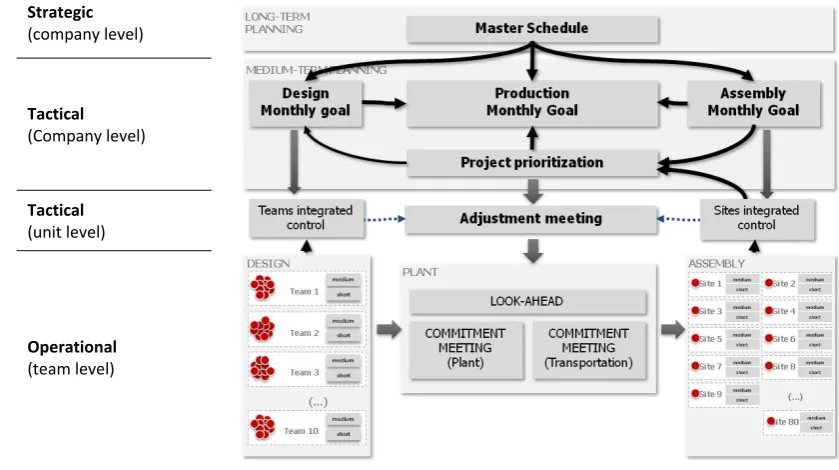
Strategic (company level)
Tactical (Company level)
Tactical (unit level)
[image:6.595.77.497.97.332.2]Operational (team level)
Figure 2: Existing planning and control system in the company
Regarding the tactical unit level, the design unit held weekly meetings in which the production of each team was analysed and the load of projects to be produced were balanced according to the available capacity. In the assembly process, each project manager gathered the information, and there were no meetings to analyse the situation of the different construction sites. The main source of information from the assembly was a meeting called project prioritization, in which the project managers could give a status of the production process to the Planning Department. This department should, in turn, use this information to make adjustments in the master schedule to define the monthly target of each production unit, without the constrained projects and ensuring the maximum utilization of capacity.
The weekly adjustment meeting focused on monitoring the completeness of a stage, according to the monthly target. Although the meeting name seems to refer to flexible plans – plans that could be “adjusted”, in fact the meeting was based in a management-as-planning approach. The main objective of the meeting should be to put together representatives from the design, plant, transportation and assembly department to define the most important projects on which to work. However, since this information was not formalized, the main control was focused on the previously established monthly target.
RESEARCH METHOD
This research process has been carried out in close collaboration and engagement of the managerial staff of the company, being very similar to an action-research investigation. There were learning cycles involving the main five stages of this approach: diagnosing, action planning, action taking, evaluating, and reflection, as suggested by Susman and Evered (1978).
the company and its use was a turning point in the development of the planning and control system, since it enhanced participation, helping teams work collaboratively.
The decision to apply the visual tools described in this paper was the result of a series of meetings in which the goal, design, type of information and update procedure were defined. The meetings were held weekly during two months together with the representatives from the Planning and the Continuous Improvement Department of the company. After the basic structure was defined, the tools were presented to managers and to representatives from the tactical level from the plant, logistics and design departments. The implementation reported refers to the attempts of the Design Department to structure a method for planning and control, and the implementation of a collaborative board at the tactical level in order to integrate the operational and tactical information from each production unit.
THE IMPLEMENTATION PROCESS
Implementation of the visual tools started as an aid to change some of the traditional practices from the planning and control system of the company. The aim of the visual tools was to promote collaboration between the planning department and the production units, so that both process transparency and feedback could be enhanced.
COLLABORATIVE BOARDS IN DESIGN
The design department has developed, in partnership with the Planning department, a method to integrate the information on the outputs of different teams. The idea was to improve an existing planning meeting by making it possible to discuss with the representatives of all projects under production in this department that had a close relationship with the client. They also tried to avoid overloading their teams.
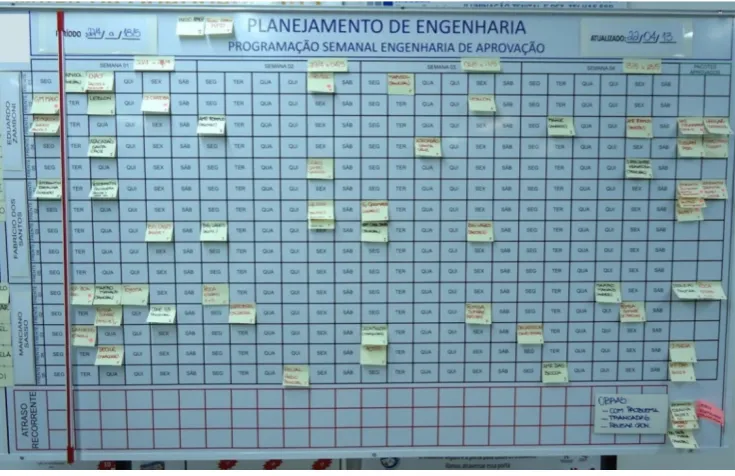
Figure 3: Visual management board of the conceptual design teams
Finally, Level 3 is the operational planning level, carried out by individual design teams, which was also supported by a visual control. A weekly meeting was carried out in each design team, in which a short and a medium-term plan was produced, in which the internal constraints of the teams were analyzed, producing a buffer of sound assignments to be undertaken in the short-term plan.
COLLABORATIVE BOARD IN THE INTEGRATED PLANNING AND CONTROL
The aim of visual controls at the tactical level (see Figure 2) was to provide a clear overview of what was happening at the production units. The first version of a board integrating production information from each department was developed in collaboration with the planning and the continuous improvement department. During the first meeting for discussing the board with company managers, it was proposed to use the adjustment meeting as the mean to update the board and discuss the changes and problems in the production units.
In fact, the adjustment meeting was not reaching the goal of receiving a feedback from operational levels of control. The idea was that the visual tools would enhance this level of control, by providing an overall understanding of the production, and its status in each unit. The integrated control board was developed containing four important items of information about each production unit: (a) urgent sub-stages, including batches that are late or that should be produced earlier than scheduled; (b)
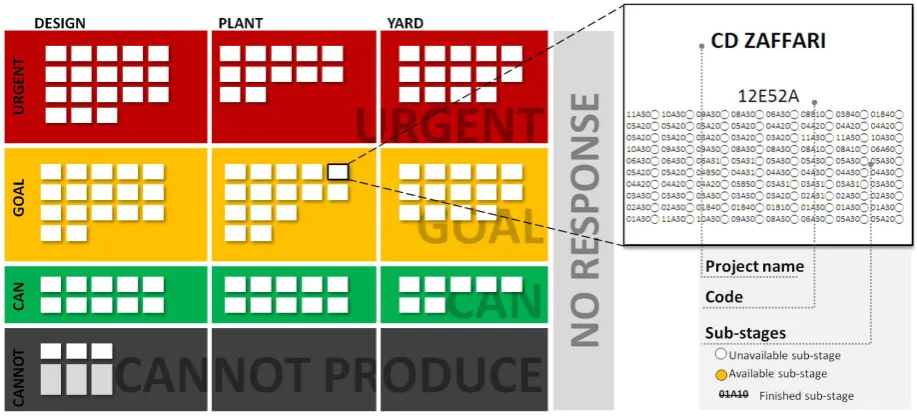
Figure 4: Schematic representation of the integrated planning board
In the first version of the board, the urgent sub-stages concerned all the sub-stages that were delayed according to the master schedule, or the ones that had been expedited in the previous monthly targets. The number of projects in this situation was sometimes even higher than the number of projects in the monthly targets. In fact, this would not mean that all the efforts from the production unit should be focused on those projects. Projects could be delayed due to lack of information or decisions from clients and, therefore, the master schedules remained with the old dates. For this reason what was shown as urgent projects were not real priorities for the company.
Regarding the information collected in the prioritization meeting, the projects signed as “should be produced” and the ones in the master schedule with no constraint for production would be put in the monthly target, so they would appear in the goal line. The third line was filled with the projects signed in the prioritization meeting as “can be produced”, which were not scheduled for that month. So each production unit could easily understand what to produce if it faces a problem in following the monthly target. The information on projects that cannot be produced also came directly from the prioritization meeting.
In order to avoid having an exaggerated number of information, some of the projects were not on the board. The last column refers to the projects that were produced although they have not appeared in any category from design, plant or logistics. It was called “No response”. When a project appeared in this category, the assembly should analyse if the construction site was able to receive the components and the plant should explain why they have produced a project out of the target and backlog.
During the adjustment meetings, the managers from assembly were emphasizing the most critical sites, in order to make all the production units aware of it. This became an important source for look-ahead planning at each department.
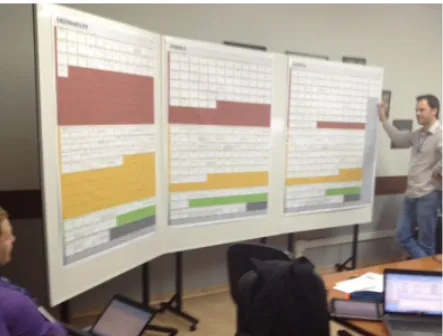
Figure 5: Visual management board during the adjustment meeting
The above mentioned problem of having too many projects in the urgent line had a positive effect, since it brought to light a discussion over how the monthly targets were established and the importance given to delayed items. When discussing the design of the board in the meeting with the managers and planning coordinators, there was a common understanding that a delayed project is the same as an urgent project, but the use of the board revealed that this was not true.
When people started to have a closer interaction with monthly targets, through the use of the board, they started to question why a sub-stage within the schedule would appear in the urgent line and not on the target line. It became clear that there were disconnected strategies between what was the main target for the Planning department and the real available workload of the production units. There was a common understanding that planning and control should be based on a management-as-planning approach, which avoids learning from operational levels and developing flexible plans.
The board started to be used in March, the adherence to the monthly target can be seen in Figure 6. Although the adherence to the target improved over time, after 5 months using this version of the board, the company realized that it was still low. So a new criterion was defined for urgent and can-produce projects. The idea was that the board would start the month only with the information from the goals. In the course of the month, delayed sub-stages would go to the urgent line, so that this line would only report the most important projects for the production units. However, this also required a review of the way monthly targets were defined. Consequently, the planning department agreed to consider all the projects available for production (even the ones which had already been assigned in a previous month) in the target definition.
The dep pap this awa Bef was ben focu ofte con com the disc incr Alth last sche freq CO Thi plan atte con unc time Des the ava und
e results of partment. In perwork nee
s departmen are of what
For the pla fore the use s not clear nefitted very
used on the en already th ntrol by usin mmunication
teams. The proble cussed in th rease the fr hough the p
workshop eduling dep quently, inst
ONCLUSIO
s paper repo nning and c empt to und ntrol in suc certainty bec
es and alloc The use of sign Departm
case of th ilable to the derstand wh
Figu f the use o n the Plann eded to upda nt which st
was happen ant and logi e of the boa which one y much fro e assembly he design fi ng a collab n between t
em of not his occasion requency of process cou in this stu partments ag
tead of a fro
ON
orts the imp control syst derstand how
ch environm cause of its cation of cap f the visual
ment, each he integrate e assembly
at was abou
ure 6: Adhe of the boa ning depart ate the boar tarted to be ning in diffe istics depart ard, they use
was the m om the inte needs, the inished. In f borative boa
teams and a
having ro n with the f target defi ld not be pu udy, when t
greed with t ozen, pre-de
plementatio em in an en w such tool ment. An e
dependence pacity.
tools impr team starte ed planning
process, wh ut to be deliv
erence to the ard vary ac tment, there rd and also b e questione erent produc
tments, it w ed to receiv most importa egrated plan e most imp
fact, design ard within aided the w
olling plans Planning d inition beca ut into prac the coordin the importa efined plan
on of some v ngineer-to-o ls can impro engineer-to-e on cliengineer-to-ent d
roved plann ed to realize g board, in hat used to b
vered, creat
e monthly ta ccording to
e was a di because it r ed. By cont ction units w was importa
ve a numbe ant. The de nning and ortant proje
teams had the departm way workloa
s for the m department, ause of the ctice, this w nators from ance of recei
that could n
visual tools order of ste ove the effe -order prod decisions, a
ning transpa e what was nformation
be a black b ting an aid f
arget
the percep isapproval b revealed old
trast, the be were perceiv ant to have er of inform esign depart control bo ects for the
improved p ment, which
ad could be
monthly tar who were amount of was one of th
the design iving updat not be follow
to enhance eel building ectiveness o duction sys and the need
arency. In t going with about prod box. It enab for correct n
eptions of e because of d practices f enefit of b ved.
a unified p mal plans, an rtment have oard. As it e assembly productivity h enhanced e share thro
rgets was e not willin
work requi he topics of n and the p ted targets m
wed.
e the produc g systems, in
of planning stem has m d to predict
the case of other team duction bec bled each un negotiations
each f the from eing
plan. nd it e not was had y and d the ough
also ng to ired. f the plant more ction n an and much lead
f the s. In came nit to
Through the board of the design teams it was also possible to avoid idleness and overloaded teams by the use of a collaborative approach in the planning meetings. The integrated planning board enabled all the production units to look at the same goal, which was given by the assembly – the final production process within the company scope. The availability of the previously hidden data made people question the old practices such as the tendency to produce only the heaviest batches, and the top-down approaches of the Planning Department that could not understand the problems of the production.
There is still some resistance to implement the procedures of a more flexible and collaborative planning and control system. This is mainly due to the assumption of a management-as-organizing approach that is difficult to accept by the traditional way of planning. Although the company observed some benefits from using the boards and the collaborative meetings, it remains in managerial decisions a management-as-planning approach. The result of this implementation process was fundamental to the development of the research project on which this paper is based.
REFERENCES
Alvarez, R. dos R., and Antunes Jr., J. A. V. (2001). “Takt-time: conceitos e contextualização dentro do Sistema Toyota de Produção.” Gestão e produção, 8(1), 1–18.
Bertrand, J. W. M., and Muntslag, D. R. (1993). “Production control in engineer-to-order firms.” International Journal of Production Economics, 30-31(0), 3–22. Formoso, C. T., SANTOS, A. D. O. S., and POWELL, J. A. (2002). “An Exploratory
Study on the Applicability of Process Transparency in Construction Sites.”
Journal of Construction Research, 03(01), 35–54.
Galsworth, G. D. (1997). Visual Systems: Harnessing the Power of a Visual Workplace. Amacom.
Greif, M. (1991). The Visual Factory: Building Participation Through Shared Information. Taylor and Francis.
Hayes-Roth, B. and Hayes-Roth, F. (1979). “A Cognitive Model of Planning.”
Cognitive Science, 3, 275–310.
Johnston, R. B. B., and Brennan, M. (1996). “Planning or organizing: The implications of theories of activity for management of operations.” Omega, 24(4), 367–384.
Koskela, L. (1992). Application of the New Production Philosophy to Construction. Finland, 81.
Koskela, L. (2000). “An exploration towards a production theory and its application to construction.” Helsinki University of Technology, Espoo.
Kurtz, C. F., and Snowden, D. J. (2003). “The new dynamics of strategy: Sense-making in a complex and complicated world.” IBM SYSTEMS JOURNAL, 42(3). Liker, J. (2003). The Toyota Way: 14 Management Principles from the World’s
Greatest Manufacturer. McGraw Hill Professional, 350.
Soman, C. a., van Donk, D. P., and Gaalman, G. J. C. (2007). “Capacitated planning and scheduling for combined make-to-order and make-to-stock production in the food industry: An illustrative case study.” International Journal of Production Economics, 108(1-2), 191–199.
Tezel, B. A. (2011). “VISUAL MANAGEMENT: AN EXPLORATION OF THE CONCEPT AND ITS IMPLEMENTATION IN.”
Viana, D. D., Bulhoes, I., and Formoso, C. T. (2013). “GUIDELINES FOR INTEGRATED PLANNING AND CONTROL OF ENGINEER-TO-ORDER.”
Proceedings of the 21st Annual Meeting of the International Group for Lean Construction, Fortaleza, 549–558.