2018 International Conference on Modeling, Simulation and Optimization (MSO 2018) ISBN: 978-1-60595-542-1
Reliability Simulation of System with Periodic Test Based
on Monte Carlo Method
Zhao-jun HAO
and Duo LI
Institute of Nuclear and New Energy Technology, Collaborative Innovation Centre of Advanced Nuclear Energy Technology, Key Laboratory of Advanced Reactor Engineering and Safety of
Ministry of Education, Tsinghua University, Beijing 100084, China
Keywords: Monte Carlo simulation, Periodic test, Reliability.
Abstract. Monte Carlo method is an experimental simulation approach to analyze system reliability parameters. Direct component-based Monte Carlo method is very common in system reliability simulation. Periodic test is a special and complex routine maintenance method, in which part system components are tested completely and replaced by new ones if it was needed. This kind of maintenance method makes system components recovering their reliability periodically and components states being discontinuous with sudden changes after periodic test. Based on direct Monte Carlo method, this paper divides the whole mission time into several parts to simulate the system reliability with periodic test.
Introduction
With the development of the computer science technology, Monte Carlo method becomes one of the experimental simulation methods. Without Monte Carlo method, we should simulate and calculate systems reliability with mathematical models. However, the more and more complex practical systems bring problems in modeling and affect the accuracy of the simulation. The Monte Carlo method, a process-based experimental simulation method, overcomes this drawback. Monte Carlo method could simulate the whole experimental process well and does not require an accurate mathematical model to describe it. This flexible simulation method has been used in a great deal of application in reliability simulation.
[1-4] introduce the basic Monte Carlo theory and the Monte Carlo method from two perspectives and gives the corresponding state transition equations. The direct simulation method is based on components and completes the state transition of the system by sampling the transition time (life or repair time) of each component; the indirect simulation method is based on system and uses the sum of all component transition rates as the transition rate of the whole system. Meanwhile, discrete sampling is used to determine the transition component and the transition states. The two methods are applicable in normal circumstances. However, it is more convenient to use direct simulation method when there is correlation between components or the failure rate changes with the states.
In the above references the state of the system components is continuous and the simulation process is a homogeneous Markov process.
This paper mainly studies the reactor protection system of nuclear power plant, where there is a special maintenance method - periodic test. According to the set test period, the maintainer will test the equipment of a redundant channel of the system and replace some of the fault or aging components with new ones to ensure the high reliability of the system. In this mode of operation, the reliability of redundant channel equipment will be restored as new after the periodic test. Without considering the process of the periodic test itself, the state of the system has a sudden change at the point of each periodic test. In this paper, we will study the reliability simulation of system periodic test with Monte Carlo method.
Organization of the Text
Monte Carlo and Periodic Test Theory
Direct Simulation Method. Due to the periodic test process, the state of the components and system may exist a sudden change, which means the state transition process cannot be considered from the system level, making indirect simulation method no longer applicable. So we consider about the direct simulation method. The direct method uses continuous sampling method to get the transition time (life) of each component, and each transition is based on the transition time of each component. Therefore, the direct method is a component-based simulation method.
Let us consider a multi-component system made up of independent components. For the sake of simplicity and clarity, we assume that each component has two states, operation state and fault state. The fault state is absorbing.
We denote () = 1 − () the cdf of component leaving its operational state before time , by () the corresponding pdf.
According to (), we can use continuous sampling method to get the transition time (), = 1,2, … , .
1
( ) ( )
j j
t t =F− R (1)
where is the inverse function of the cdf , and is a random number sampled from the
uniform distribution in [0,1).
According to the order of occurrence, we build the random walk to describe every transition time and state
1 1 2 2
( , ), ( ,i τ i τ ),…, ( ,in τn) (2)
where means the -th component to undergo a transition and = , = 1,2, … , . We assume that transitions are sampled before the mission time .
1 2 k Tm k 1 n
τ <τ <…<τ < <τ + <…<τ (3)
We can get pdf of the whole transition sequence [4].
1 1 1
1 1
(( , ) ( , ); , , )= ( ) ( )
j l
k n
k k k n m i j i m
j l k
p i τ i τ τ + τ T f τ S T
= = +
>
∏
∏
… … (4)
We use conditional probability laws to factorize Eq. 4 as:
1 1 1
1 1 1
1 1 1
1 1 1
1 1 1 1 1
1 1 2 2 3 2
1 1 2
(( , ) ( , ); , , )
(( , ) ( , ); , , |
( , ) ( , ); , , )
(( , ) ( , ); , , |
( , ) ( , ); , , )
(( , ), ( , ); , , |
( , ); ,
k k k n m
k k k n m
k k k n k
k k k n k
k k k n k
n
p i i T
P i i T
i i
p i i
i i
p i i
i
τ τ τ τ τ τ τ τ
τ τ τ τ τ τ τ τ τ τ
τ τ τ τ τ
τ τ τ τ τ τ τ
+
+
+
+
− − −
>
= >
>
× >
>
×
× >
… …
… …
… …
… …
… …
…
…
1
1 1 2 1
, )
(( , ); , , )
n n
p i
τ τ τ τ τ τ
>
× >
… …
(5)
where conditional probability functions as follows:
1
1 1 2 1 1 1
2
(( , ); , , )= ( ) ( )
j
n
n i i
j
p i τ τ τ τ f τ S τ
=
>
∏
1 1 1
1 1 1 1 1
1 1
(( , ), , ( , ); , , |
( , ), , ( , ); , , )
( ) ( )
2, , ( )
l j
j
l l l n l
l l l n l
n
i l i l
j l n
i l
j l
p i i
i i
f S
l n
S
τ τ τ τ τ τ τ τ τ τ
τ τ
τ +
− − −
= +
− =
… … >
… … >
= =
∏
∏
… ,
(7)
1 1 1
1 1 1
1
1
(( , ) ( , ); , , |
( , ) ( , ); , , )
( )
( )
j
j
k k k n m
k k k n k
n
i m
j k n
i k
j k
P i i T
i i
S T
S
τ τ τ τ τ τ τ τ τ
τ +
+
= +
= +
>
>
=
∏
∏
… …
… … (8)
We use conditional probability functions to limit the sampling from n-dimensional time distribution to one-dimensional time distributions. By sampling the transition time and sorting, we get the whole complete transition process.
Periodic Test. In order to simplify the discussion, we will simplify the periodic test process. The process of periodic test is not considered and we only consider that the component reliability will recover as new.
Because of at the moment of periodic test,the state of related components recovered as new, this discontinuous state transition is difficult to describe with the Markov model. Considering the periodic test moment as a boundary, the whole simulation time is divided into several stages; in
each stage, the state of the system is continuous, and the description of the homogeneous Markov process can be performed by using the Monte Carlo method.
The state transition time, similar to the direct simulation method, is still sampled and sorted by the cdf of each component. We assume that only one component () conducts the -th periodic
test at and the transition time is sampled as ∗. Multiple periodic test of several components
is similar to this process. According to whether ∗ in [, ( + 1)", we consider the
simulation process divided into two parts (If ( + 1) > , then we consider [, ").
At this stage, the component is recovered as new at , which means both its cdf and pdf
have changed. We use ∗(t),∗(t) and ∗() to represent the changed functions.
*( ) ( )
s s
i i s
f t = f t−NT (9)
* * *
( ) 1 ( ) ( )d ( )
s s s s
i i i i s
F t = −S t =
∫
f t t=F t−NT (10)After periodic test, the lifetime of the component needs to be resampled according to Eq. [12]
to get the transition time ∗ at stage [, ( + 1)". This corresponds to shifting the distribution
of the component along the time axis to reflect the change in lifetime after periodic test. At the
same time, the process of component at [0, ) stage needs to be removed while other
components that have not undergone periodic tests remain the transition sampling time at [0, ). This means the transition process before is remained to ensure the contribution of each
component in the statistical results of [, ( + 1)" phase.
(1) < ∗< ( + 1)
We assume that ( ≤ ≤ ) transitions are sampled before the mission time (N + 1).
*
1 1 1 1 1 1 1
(( , ) (s , s ),(s , s ) ( , );l l l , , ,s , n ( 1) )s
Eq. [13] represents transition process of component at [, ) and transition process of
other components at [0, ). The conditional probability function is as follows:
*
1 1 1 1 1 1 1
*
1 1 1 1 1 1 1
*
1 1 1 1 1 1 1
1
(( , ) ( , ), ( , ) ( , ); , , , , ( 1) )
(( , ) ( , ),( , ) ( , ); , , , , ( 1) |
( , ) ( , ),( , ) ( , ); , , , , )
(( ,
s s s s l l l s n s
s s s s l l l s n s
s s s s l l l s n l
p i i i i N T
P i i i i N T
i i i i
p i
τ τ τ τ τ τ τ
τ τ τ τ τ τ τ
τ τ τ τ τ τ τ τ
τ
− − + + +
− − + + +
− − + + +
> +
= > +
> × … … … … … … … … … … … … *
1 1 1 1 1 1
*
1 1 1 1 1 1 1 1 1
*
1 1 2 2 3 2
*
1 1 2 1
* 1 1 2
) ( , ), ( , ) ( , ); , , , , |
( , ) ( , ),( , ) ( , ); , , , , )
(( , ), ( , ); , , , , |
( , ); , , , , )
(( , ); , , ,
s s s s l l l s n l
s s s s l l l s n l
s n
s n
s
i i i
i i i i
p i i
i
p i
τ τ τ τ τ τ τ
τ τ τ τ τ τ τ τ
τ τ τ τ τ τ
τ τ τ τ τ
τ τ τ
− − + + + − − + + − − − > > × × > > × … … … … … … … … … … … … … … 1
,τn>τ )
…
(12)
where each part of the conditional probability function:
1
* *
1 1 2 1 1 1 1
2,
(( , ); , , , , ) ( ) ( ) ( )
s j
n
s n i i i
j j s
p i τ τ τ τ τ f τ S τ S τ
= ≠
> =
∏
… … (13)
*
1 1 1 1 1 1 1
*
1 1 1 1 1 1 1 1 1
* 1 1 1 * (( , ) ( , ), ( , ) ( , ); , , , , | ( , ) ( , ), ( , ) ( ( ) ( ) , ); ( ) , , ( ) ( , , , ) ) , s j s j r
s s s s r r r s n r
s s s s r r r s n r
n
i i i
j r n
i i r
r
r j r
r r
p i i i i
i i
f S S
r k n
S S
i i
τ τ τ τ τ τ τ τ
τ τ τ
τ τ τ
τ
τ τ τ
τ τ τ − − + + + − − + + − − − − = + − = > > = =
∏
∏
… … … … … … … … … , (14) *1 1 1 1 1 1 1
*
1 1 1 1 1 1 1
*
1 *
1
(( , ) ( , ), ( , ) ( , ); , , , , ( 1) |
( , ) ( , ), ( , ) ( , ); , , , , )
(( 1) ) (( 1) )
( ) ( )
j j
j j
s s s s l l l s n s
s s s s l l l s n l
n
i s i s
j l n
i l i l
j l
P i i i i N T
i i i i
S N T S N T
S S
τ τ τ τ τ τ τ
τ τ τ τ τ τ τ τ
τ τ − − + + + − − + + + = + = + > + > + + =
∏
∏
… … … … … … … … (15)(2) ∗> ( + 1)
*
1 1 s 1
(( , ) ( , s) ( , );l l l , , n ( 1) )s
p i
τ
… iτ
… iτ
τ
+ …τ
> N+ T (16)The conditional probability function is as follows:
*
1 1 s 1
*
1 1 s 1
*
1 1 s 1
*
1 1 s 1
*
1 1 s 1 1
(( , ) ( , ) ( , ); , , ( 1) )
(( , ) ( , ) ( , ); , , ( 1) |
( , ) ( , ) ( , ); , , )
(( , ) ( , ) ( , ); , , |
( , ) ( , ) ( , );
s l l l n s
s l l l n s
s l l l n l
s l l l n l
s l l
p i i i N T
P i i i N T
i i i
p i i i
i i i
τ τ τ τ τ
τ τ τ τ τ
τ τ τ τ τ τ
τ τ τ τ τ τ
τ τ τ τ
+ + + + − − > +
= > +
> × > … … … … … … … … … … … … … … 1 *
1 1 2 2 3 2
*
1 1 2 1
1 1 2 1
, , )
(( , ), ( , ); , , , , |
( , ); , , , , )
(( , ); , , )
l n l
s n
s n
n p i i
i
p i
τ τ
τ τ τ τ τ τ
τ τ τ τ τ
τ τ τ τ
where each part of the conditional probability function:
1
* *
1 1 2 1 1 1 1
2,
(( , ); , , , , ) ( ) ( ) ( )
s j
n
s n i i i
j j s
p i τ τ τ τ τ f τ S τ S τ
= ≠
> =
∏
… … (18)
*
1 1 s 1
*
1 1 s 1 1 1
1 1
(( , ) ( , ) ( , ); , , |
( , ) ( , ) ( , );
( ) ( )
( )
,
, )
,
,
,
r j
j
n
s r r
i i
r n r
s r r r
j r n
i r
j r
n r
r r
p i i i
i i
f S
r n
S
i
k τ τ τ τ τ τ
τ τ τ τ
τ τ
τ
τ τ +
− −
= +
− =
−
>
>
= =
∏
∏
…
… … …
… … …
(19)
* *
1 1 s 1
* *
1 1 s 1
*
1 *
1
(( , ) ( , ) ( , ); , , , , ( 1) |
( , ) ( , ) ( , ); , , , , )
(( 1) ) (( 1) )
( ) ( )
j j
j j
s l l l s n s
s l l l s n l
n
i s i s
j l n
i l i l
j l
P i i i N T
i i i
S N T S N T
S S
τ τ τ τ τ τ
τ τ τ τ τ τ τ
τ τ +
+
= +
= +
> +
>
+ +
=
∏
∏
… … … …
… … … … (20)
According to the state conditional probability functions, we present the periodic test process in several stages. The core part is to separate the state-continuous components and the state-discontinuous components (periodic test part). We use the periodic test time point to divide the whole mission time, in order to make sure the system state is continuous in every stage.
Simulation Experiments
According to the previous analysis and formula, we get the basic steps to simulate the periodic process with Monte Carlo method:
(1) Based on the transition probability distribution of each component, the state transition time of each component is obtained by continuous sampling.
(2) The system time counter accumulates with a certain minimum interval time. When the counter time is greater than or equal to a component state transition time, the state transition occurs.
(3) When a component is replaced after periodic test, the new component state transition time of the next stage is resampled and the component's state is returned to normal operation.
(4) Determine whether the system is normal working or faulty, and if it is faulty, add “1” to the corresponding statistics counter.
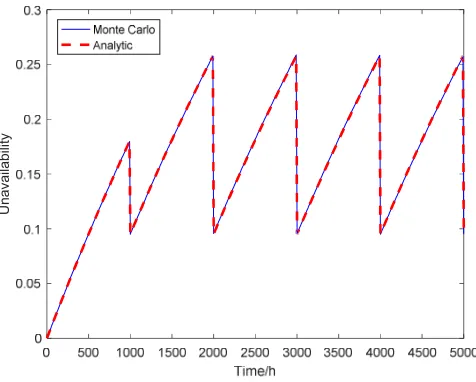
Two examples of system simulations that considered periodic test are discussed below. a) Two-components series system
We consider a two-components series system (component A and B). We assume that two components are identical and independent of each other. Their lifetime distribution follows an exponential distribution. The failure rate is constant as ) = 10*/ℎ. Component A and B are periodically tested at = 1000ℎ intervals. The mission time is 5000ℎ and number of the trial is 10-. The initial state of the component is normal working.
Since the component's state transition distribution is exponential, we can get the formula as follows:
( ) t
f t =λe−λ
(21)
( ) ( )d 1 t
According to the continuous sampling method, the inverse function of Eq. [24] can be sampled to obtain the state transition time of the components.
1
=- ln(1 R)
τ
λ
− (23)where is a random number sampled from the uniform distribution in [0,1). After periodic test, the distribution changes.
( )
*
( ) t NTs
f t λe−λ −
= (24)
And the sampling function also changes.
* 1
=NTs- ln(1 R)
τ
λ
− (25)The simulation result is as follows:
[image:6.612.183.421.318.509.2]It can be seen that the solid line (Monte Carlo method) fits well with the dot line (Analytic), and the variance of the difference is 1.9868 × 10³. This proves that under a certain number of simulations, the above-mentioned staged Monte Carlo method can be used to simulate the periodic test process and ensure the accuracy.
Figure 1. Two-components series system.
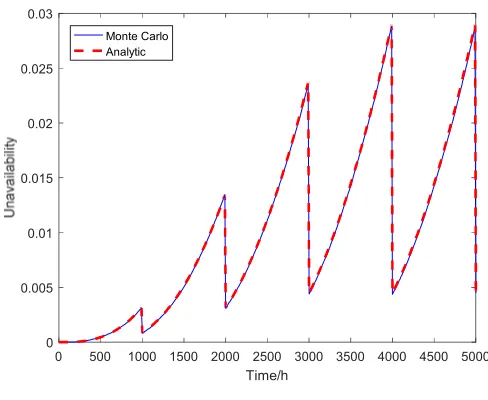
b) 2-out-of-4 system
The nuclear power plant reactor system consists of four redundant channel, which constitutes a 2-out-of-4 system structure. The periodic test mode is four-channel rotation test and maintenance. To simplify the discussion, periodic test is considered as a point in time, where the reliability of a component on a channel recovers “1” after periodic test.
The reliability of a 2-out-of-4 system consisting of four components is discussed below. Four components are identical and independent of each other. Their lifetime distribution follows an exponential distribution. The failure rate is constant as ) = 10*/ℎ. Each component is periodically tested at = 1000ℎ intervals. The mission time is 5000ℎ.
The 2-out-of-4 system periodic test simulation process is basically the same as the simulation of the two-components series system. Because there are four components rotating periodic test. So at each test point in time, we need to determine which channel needs to be tested, and the state of the corresponding component returns to normal working condition. The simulation result is shown in Fig. 2.
U
n
a
va
ila
b
ili
Figure 2. 2-out-of-4 system.
2-out-of-4 system takes four-channel periodic rotation test. The theoretical analysis shows that the system will achieve the cycle after four periodic tests. The simulation results are completely consistent with the theoretical analysis. The simulation result and analytic result are basically the same. The variance of the difference is 7.7032 × 10⁷.
Conclusion
This paper introduces Monte Carlo direct simulation method and state transition formula. The conditional probability is used to decompose the n-dimensional probability distribution into
one-dimensional conditional probability distributions, and to represent each state transition of the system. At this point the system state is continuous, uninterrupted.
In this paper, based on the direct simulation method, we focus on the case of discontinuous state transitions with periodic test. We divide the system mission time into several phases according to the periodic test to ensure that the system state is continuous at each stage and derive the state transition functions. At the same time, we simulate 2 sample systems with periodic test, which are two-components series system and 2-out-of-4 system. The simulation results are in good agreement with the analytic results, which shows that the method adopted in this paper is correct and effective.
In this paper, the periodic test process is simplified to a point in time, and the relevant process of system degradation has not been considered; periodic test related process, intervals and other aspects of the maintenance can be further studied.
References
[1] A. Dubi, “Analytic approach & Monte Carlo methods for realistic systems analysis,” Mathematics and Computers in Simulation, vol. 47, no. 2-5, pp. 243-269, Aug, 1998.
[2] Y.F. Wu, and J.D. Lewins, “Monte-Carlo Studies of Engineering System Reliability,” Annals of Nuclear Energy, vol. 19, no. 10-12, pp. 825-859, Oct-Dec, 1992.
[3] E. Zio, The Monte Carlo simulation method for system reliability and risk analysis: Springer, 2013.
[4] P.E. Labeau, and E. Zio, “Procedures of Monte Carlo transport simulation for applications in system engineering,” Reliability Engineering & System Safety, vol. 77, no. 3, pp. 217-228, Sep, 2002.
0 500 1000 1500 2000 2500 3000 3500 4000 4500 5000
Time/h
0 0.005 0.01 0.015 0.02 0.025 0.03