Design and Optimization of MPPT Routing
in Solar Car Cells with the Maximum Power
Point Tracking
Mohammad Jangholi 1, Alireza Sedaghati 2
MS Student, Dept. of Electrical Engineering, Shahabdanesh Institute of Higher Education, Qom, Iran1
PhD, Dept. of Electrical Engineering, Shahabdanesh Institute of Higher Education, Qom, Iran2
ABSTRACT: Photovoltaic systems have no pollution emission and noise production environmentally and no cost of fuel, economically. On the other hand, they require little maintenance and most importantly, they are unending. To trace the maximum power on the basis of actual values of current and PV array voltage, online methods such as P&O and RCC can be employed. In this way, we achieve the optimal performance point of the system. The current study investigated a series connection of two modules in a PV array, that only one of the modules is affected. In this case (the penumbra), in addition to a general maximum, there will be a local maximum point that makes tracing difficult. Among the existing methods for designing MPPT, P&O and RCC are highly popular. In the simulation section of this paper, two mentioned methods are used with the help of MATLAB software. MSX60 model is used as a proposed solar car and the simulation results of this model are provided at the end of the paper. In the proposed method, a combination of two algorithms P&O and RCC is used to design MPPT. MPPT is designed in two stages; first stage RCC, and the second stage P&O algorithm
KEYWORDS: Photovoltaic, Solar Simulators, RCC control , P&O method.
I. INTRODUCTION
The increase in energy demand, fuel price, global warming, and attention to environmental pollution has led to much more attention to renewable energy sources. Many sources are available as renewable energy, such as solar, wind, earth, heat, hydrogen (fuel cell) and so on. But it seems that among them, the tendency is more towards solar energy [1].
Photovoltaic systems have no pollution emission and noise production environmentally and no cost of fuel, economically. On the other hand, they require little maintenance and most importantly, they are unending. [2].
Photovoltaic systems have two major disadvantages: - High costs and very low efficiency (about 9 to 16%)
- Continuous change in the amount of power produced by atmospheric conditions (temperature and radiation)
The research has focused on the methods of tracing maximum power in order to extract the maximum amount of one or more connected arrays. For this purpose, many methods have been proposed that have differences in complexity, convergence speed, cost, required sensors, effectiveness range, hardware implementation and etc. which are classified as follows:
Hill Climbing method
P&O method
Incremental Conductance method
Ripple Correlation Control (RCC) method
Fractional Open-circuit Voltage method
Fractional Short-circuit Current method
Fuzzy Logic Control method
Online methods such as P&O and RCC track the maximum power on the basis of actual values of current and PV array voltage. Therefore, the optimal system performance point is achieved. These methods are more expensive due to the use of additional circuits and are usually used in large scale systems [1].
Although the research in this field has led to good results, but these methods need to be developed so that can find the maximum power point in two or more arrays that are connected in series or parallel. Particularly, under radiation and temperature variable conditions which the local maximum will involve MPPT algorithms in those points [2].
Reference [3] presented a new algorithm based on the P&O algorithm. This algorithm has a fast operation and it eliminates the need to use a capacitor with a large value to remove the voltage ripple in the P&O method. Instantaneous value is used instead of the mean voltage and array current which increases the speed of tracking.
Reference [4] presented an improved method named P&O-dp, which makes extra measurements without creating turbulence in the voltage and current. In this way with the three consecutive samples, the effect of turbulence in voltage (current) and the effect of changes in atmospheric conditions are evaluated, so increasing power is applied only when is caused by the MPPT algorithm.
Reference [5] proposed a two-step method for tracking the overall maximum point. In the first phase, the local maximum area can be found, and in the second phase, using the algorithm P&O, the local maximum points are tracked. At first, the nearest local maximum is found, then it searches left side and then right side to find the other local maximums.
Reference [6] proposed an MPPT system with parallel connections, where the modules PV are connected in parallel. Each module will follow specifically its own MPP. If a module placed under the influence of light, its performance is not transmitted to other modules. The problem of this method is high hardware facilities and high cost for implementing it.
II.
METHODOLOGYII.1. Introduction of the system under study
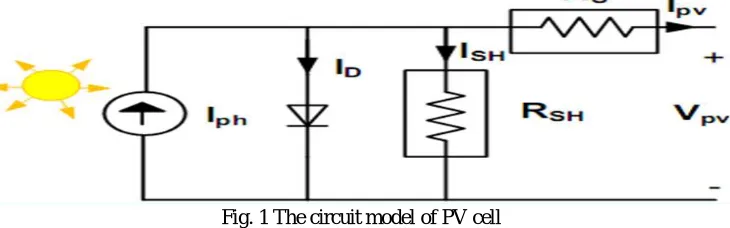
Photovoltaic cells have a non-linear I-V characteristic, which depends on the amount of solar radiation and cell temperature. Under ideal conditions, a solar cell can be modeled by a current source which became parallel with a diode. But the losses of the cells can be modeled by Rs series resistance and Rsh parallel resistance. So in real terms, the
orbital model became a PV cell in Figure 1 [1] and [2].
Fig. 1 The circuit model of PV cell
The Rs value is usually very small, and the Rsh value is very large. Also the source current of Iph in the dark conditions
tends to zero.
According to the equivalent value of a photovoltaic cell and the law of KCL, Equation (1) can be written as follows: (1) = − −
(2) = °
(
. . .
Then, if module PV includes the Np series cell and infinite resistance Rsh, the equations of voltage and power are
determined by the following correlations:
(3) = . . . .° −
(4) =
Factors affecting the performance of the modules PV Can be attributed to 4 factors:
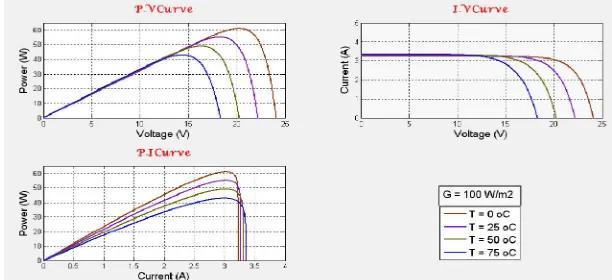
1. Temperature: As shown in Figure 2, temperature rising will reduce the voltage, and current is almost constant.
Fig. 2 changes in PV array curves or temperature in the constant radiation intensity
2. Solar radiation intensity: radiation intensity rising will increase current and voltage is almost constant
Fig. 3 changes in PV array curves or radiation intensity at a constant temperature
3. The structure of the array: array performance depends on the type of cells used and the quality of construction by the manufacturer. The values Rsh and Rs can be changed according to the structure.
II.2. Description of the problem
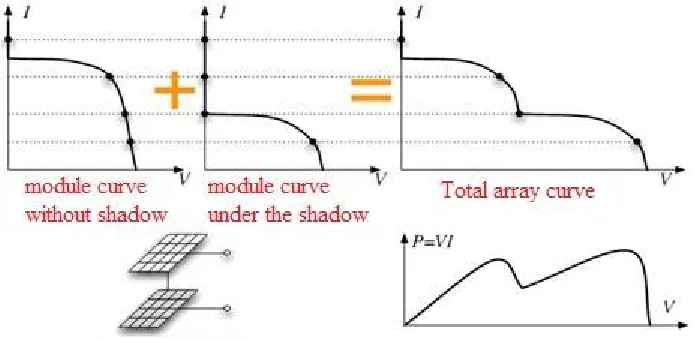
We describe the studied problem as follows: If in a PV array, two modules are connected together in series and only one of the modules would affected (penumbra terms), in this case, curves I = V, P-I, P-V are affected by the penumbra. Figure 4 shows the Curves IV Array PV Under the terms of the penumbra.
Fig. 4 PV array curve or series connection in the penumbra
It can be seen that the above array in the penumbra in addition to a maximum total has a local maximum point. And since the goal is to track the overall maximum, it makes difficult to trace issue [7]. Therefore, many algorithms have been proposed for this purpose, and in this paper, according to the proposed method, 3 of these algorithms are mentioned briefly.
A) Method P&O / Hill climbing [8-9]
The Hill climbing method would make a change in the rate of D, and P&O makes a change in the PV array voltage. In the case of connecting a PV array to power converter, switching rates of D converter, will change the PV array current, and as a result, PV array voltage would change; P&O and Hill climbing methods are two fundamentally different ways with the same performance. These methods are not successful in the rapidly changing weather conditions.
B) Ripple Correlation Control (RCC) method [8] and [10]
When PV array is connected to the power converter, the switching act creates a ripple in the voltage and the PV array current which in return created a ripple in power. The RCC would use of ripple to run MPPT. Recently, some research has been done in the field of tracking the array maximum power using this ripple as inner turmoil. RCC method makes the connection between the time derivative of the current with the time derivative of current and array voltage which is variable with time, until the slope of power can be equal to zero, so that MPP achieved.
C) S-P&O and S-RCC two-step methods
This is a two-step method of tracking the maximum power, which for two modules connected in series, it will determine the overall maximum points. The first phase of the method would measure the radiation and the temperature of the array, and it finds the final P-I curve. Then, a search algorithm would run to estimate the location of MPP with two indices of current and power in the MPP point. When climate changes go beyond a certain level, the search would repeat. The second phase is the actual characteristic curve method, which began the search for MPP from the estimated point of the first phase or from the performance of its former performance point, where the P&O and RCC methods used. This case depends on changes in the performance conditions.
combination of two algorithms P&O and RCC are used to design MPPT. MPPT designing will be done in two stages. In the first stage, the RCC is used, and in the second stage the P&O algorithm is modeled.
III. DESIGN AND SIMULATION OF SOLAR CAR
III.1. BP MSX60 model
MSX60 is an example of the PV modules with the power of 60 watts, which is selected for modeling. This module has 36 poly-crystal series connected cells. The main specifications of this model are shown in the table 1.
Table 1. Key specifications of MSX60 panel
Parameter Specifications Value
Pmax Maximum power output 60W
Vmp Voltage for maximum power 17.1 V Imp Current for maximum power 3.5 A
ISC Short-circuit Current 3.8A
VOC Open-circuit Voltage 21.1V
KV Thermal coefficient for open circuit voltage - (80 ± 10) mV / ° C KI Thermal coefficient for short circuit voltage (0.065± 0.15 65)% / ° C KP Thermal coefficient for power - (0.5 ± 0.05)% / ° C NOCT Rate of cell with environment 47 ± 2 ° C
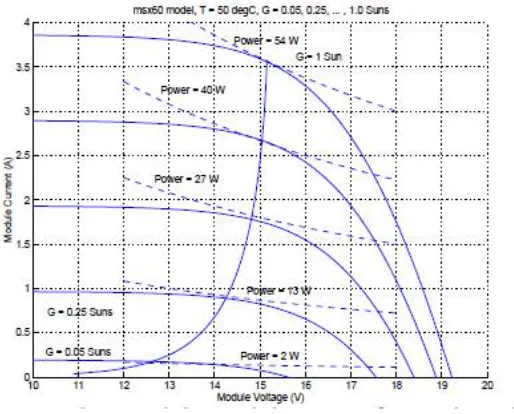
In curve of Figure 5, MSX60 model has been shown for different levels of radiation. As shown in this figure, it can be said that the constant curve of power is tangent to each one of shown VI curves.
Fig. 5 Curve for MATLAB model for different levels of radiation (G = 50; 250; 500; 750; 1000 Wm2) in nominal operation of panel with temperature 50 C.
As expected, the results for the model MSX60 in MATLAB are corresponding to the characteristic VI curve which presented in the proper context.
III.2.1. Introduction MPPT controller
The software architecture for an independent MPPT system can be very simple. One suitable way for control MPPT as well as low-power processor is using a single processor. This requires that MPPT test in the architecture that is able to adapt to tasks related to control the inverter in the development stage.
Fig. 6 Simulation MPPT model in MATLAB
The model shows a simulation of an MPPT in MATLAB. Voltage and current are inputs of this subsystem. At first, a low pass filter applied over two inputs and then a sampling is done. Next, a delay applied over the sampled signals. The power obtained from current and sampled voltage as well as delay current and voltage are calculated. After applying changes and comparing them with each other, the output of MPPT was applied to the circuit.
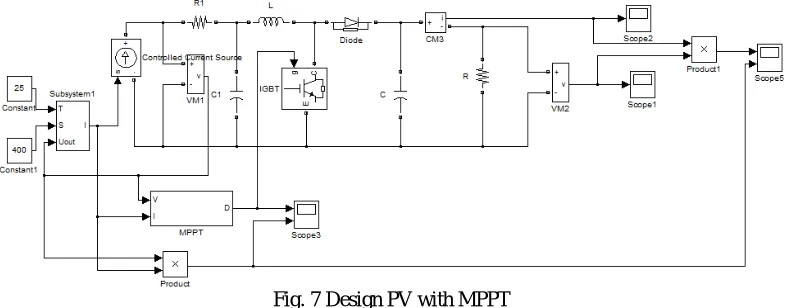
As it has been shown in figure 7 (PV design), the MPPT is used as a controller. Subsystem 1 with taking two fixed values which considered 25 and 400, and a voltage that is obtained as feedback, it generates the current as the output.
Fig. 7 Design PV with MPPT
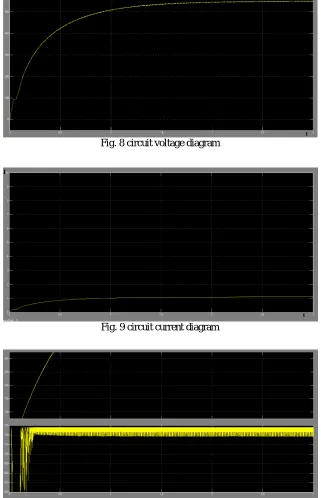
Fig. 8 circuit voltage diagram
Fig. 9 circuit current diagram
Fig. 10 circuit output using MPPT (above), circuit output without using MPPT (below)
III.2.2. P&O and RCC algorithms
Fig. 11 P&O algorithm
As shown in the P&O algorithm in figure 11, current and voltage are considered as the circuit inputs. After sampling both of signal inputs, the power can be produced as output.
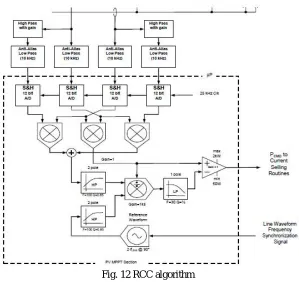
The RCC is a high-performance real-time optimization method that can be used to get the maximum photovoltaic power. The RCC method makes a connection between the time derivative of the power and the time derivative of current and array voltage which are variable with time, until the slope of power equals to zero, so that MPP could be achieved. Figure 12 shows an RCC algorithm.
Fig. 12 RCC algorithm
III.3. Simulation proposed MPPT
This article was employed a two-step MPPT control algorithm for improving the power. The first step is to model RCC control algorithm and it was used the P&O model in the second step of controller design.
Fig. 13 Simulation proposed MPPT
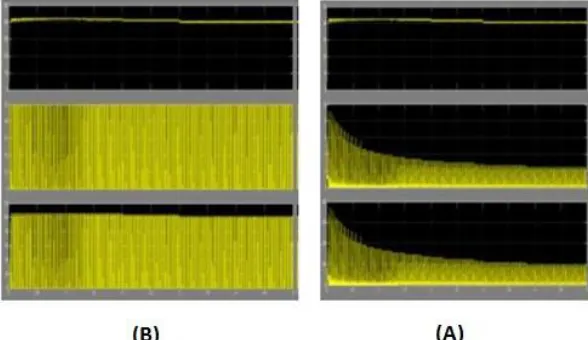
Figure 14 (A) shows a comparison between the input voltage and the increased voltage. As it can be seen, when the input voltage is 41 volts and the current is 1.637 Amp, the power value can be equal to 67.09 watts. According to the given input, the output voltage should be in a way that the settlement power and the voltage increase less. In this figure, the waveform of voltage, current and power input to the boost converter (increasing DC-DC converter) are shown. It can be seen from the diagram that the current initially rises, and begins with its maximum value.
Since this converter works based on switching, in order eliminate ripple in the output voltage, a capacitor used, and also by using a diode, the output current became one-way, so the reactive loads could be fed without problem.
Figure 14 (B) shows the wave incremental outputs. When you see the voltage waveform, voltage is 3 times more than the input value. This additive voltage is achieved in less time than 0.2 Sec.
Fig. 14 (A) (waveform of voltage - current, and power input to the boost converter)(B) increased output wave
IV. CONCLUSION
solar car, and according to the simulation results of these two methods using MATLAB software (Figure 14), it can be concluded that the output voltage is three times more than the input amount, and this additive voltage is achieved in less time than 0.2 Sec.
REFERENCES
[1] Debashis Das, Shishir Kumar Pradhan, “Modeling and simulation of PV array with boost converter; an open loop study”, Department of electrical engineering national institute of trchnology, Rourkela-769008, 2011.
[2] G.J. Yu, Y.S. Jung, J.Y. Choi, G.S. Kim, “A novel two-mode MPPT control algorithm based on comparative study of existing algorithms”, Solar Energy 76 (2004) 455–463, 19 August 2003.
[3] Mohamed Azab, “A New Maximum Power Point Tracking for Photovoltaic Systems”, International Journal of Electrical and Electronics Engineering 3:11 2009
[4] Ahmet Afsin KULAKSIZ, Ramazan AKKAYA, “Training data optimization for ANNs using genetic algorithms to enhance MPPT efficiency of a stand-alone PV system”, Department of Electrical and Electronics Engineering, Faculty of Engineering and Architecture, Sel¸cuk University,42075 Konya-TURKEY, Turk J Elec Eng & Comp Sci, Vol.20, No.2, 2012, c_ T¨UB˙ITAK, doi:10.3906/elk-1101-1051.
[5] Masoum, M.A., H. Dehbonei, and E.F. Fuchs, Theoretical and experimental analyses of photovoltaic systems with voltageand current-based maximum power-point tracking. Energy conversion, IEEE transactions on, 2002. 17(4): p. 514-522.
[6] Patel, H. and V. Agarwal, Maximum power point tracking scheme for PV systems operating under partially shaded conditions. Industrial Electronics, IEEE Transactions on, 2008. 55(4): p. 1689-1698.
[7] De Brito, M.A.G., et al., Evaluation of the main MPPT techniques for photovoltaic applications. Industrial Electronics, IEEE Transactions on, 2013. 60(3): p. 1156-1167.
[8] Konstantopoulos, C. and E. Koutroulis, Global maximum power point tracking of flexible photovoltaic modules. Power Electronics, IEEE Transactions on, 2014. 29(6): p. 2817-2828.
[9] Koutroulis, E. and F. Blaabjerg, A new technique for tracking the global maximum power point of PV arrays operating under partial-shading conditions. Photovoltaics, IEEE Journal of, 2012. 2(2): p. 184-190.