Fault Identification Using Sequential
Components of Reactive Power
Athira Rajan1, Jisha James2
PG Student [Power System], Dept. of EEE, Saintgits College of Engineering, Kottayam, Kerala, India1
Assistant Professor, Dept. of EEE, Saintgits College of Engineering, Kottayam, Kerala, India2
ABSTRACT:Anew steady state based fault classification and faulted phase selection technique is proposed using the symmetrical components of reactive power. After extracting the symmetrical components of voltage current from sending end and receiving end the symmetrical components of reactive power are calculated. Based on these values we can classify single phase to ground, double phase and double phase to ground fault and also to select the faulted phase. The proposed method is a setting-free method because it does not need any threshold to operate. The simulation studies of different fault cases reveal the capability of the proposed method.
KEYWORDS: Symmetrical Components, Fault classification, Faulted phase selection, Single phase to ground fault,
Double phase fault, Double phase to ground fault.
I.INTRODUCTION
In power systems, protective devices detect fault conditions and operate circuit breakers and other devices to limit the loss of service due to a failure. Fast and reliable fault detection and fault classification technique is an important requirement in power transmission systems to maintain continuous power flow. Identifying the type of fault, e.g., single-phase grounding fault, phase-to-phase fault, etc. will help the relay to select different algorithm elements to deal with different fault situations. Identifying the faulted-phase helps to satisfy single-pole tripping and auto reclosing requirements and it becomes possible to only disconnect the faulted phase(s). This will increase the stability margin of the power system and probably avoid unnecessary loss of electricity in some regions.
A decision-tree-based method [1] is presented for fault classification in single-circuit transmission lines. According to the travelling waves initiated by the fault, a fault detector, which determines the exact fault inception time, is used. Then, through a selected data window and by applying half-cycle discrete Fourier transform (HCDFT), the amplitude and phases of the first ten odd harmonics (up to the 19th harmonic) of the voltage of one phase and the currents of other two phases at the relaying point are calculated. In the next step, these values are used as input features to a formerly trained decision tree and the fault classification is accomplished. The decision tree (DT) is one of the attractive approaches in pattern-recognition methods. The results have shown that all types of faults are correctly classified. But it results in a great amount of data and consequently the computing burden will significantly increase.
more than common sampling frequency used in numerical relays. Typically, high sampling frequency is the main disadvantage of transient-based methods.
Benmuoyal and Mahseredjian [5] presented an interesting method in which differential incremental or superimposed voltage and current quantities are used in order to determine directionality of a fault in a network. A method to determine the direction of faults and to select the faulted phases based on the ratio of differential superimposed voltage
(e.g.ΔVAB ) to differential superimposed current (e.g. ΔIAB) is developed. It is shown that this can be accomplished
by performing three scalar products between three voltage and current phasor pairs. The relative levels of these same three scalar products can be furthermore used to identify the faulted phases. Differential incremental impedance across phases can be calculated using post-fault and pre-fault voltage and current quantities. Using these values some scalar product quantities can be defined and its sign indicates the direction of fault. Practically, the three scalar products are developed and an algorithm for faulted phase selection has been developed based on these values. However, determining the thresholds required for the method is not an easy task.
Adu [6] presented a new and accurate algorithm that is compatible with a fault recorder monitoring several connected transmission lines. The proposed algorithm is based on the measurement of phase angles between the positive and negative sequence components of the current phasor. It also uses the relative magnitudes of the zero and negative sequence quantities present in the current waveforms to differentiate between grounded and ungrounded faults. Using the phase angles the fault type can be identified. The technique that has been developed for this faulted phase selection purpose utilizes the line currents in each phase of all the connected lines. First, the current phasors for each phase of the connected lines are estimated using the least error squares phasor estimator (LES). Each current channel is selected and its calculated magnitude compared with a preselected threshold value. If the calculated current magnitude is greater than the threshold value, the channel is tagged. The accompanying phases are then selected. This procedure is continued until all the transmission lines with currents greater than their threshold values are selected. The next stage then computes the ratio between the fault and the pre-fault currents. The transmission line with the highest ratio is then selected as the faulted line. But the method failed for non-zero fault resistance.
A novel phase selector using superimposed sequence currents in conjunction with the correlation analysis [7] was proposed. The vector ratio between superimposed positive-sequence current and negative current for various types of faults is investigated. As a result, the appropriate criterion of phase selection is put forward. The correlation analysis is introduced to implement the fast phase comparison to improve the operating speed. The multibase relative comparison is performed on the correlated coefficients evaluated from the three different base phases to adapt to this type of phase selecting scheme. Additionally, a magnitude-comparison-based subsidiary criterion is applied to address the problem of possible malphase selection in the event of double-phase-earth faults. It can be found out that the method is highly vulnerable to fault resistance.
Support vector machine (SVM) is a statistical data classification method, which can find the maximum marginal boundary between different classes of a given data set and provides the global optimal solution. This property is recognized as the main advantage over artificial-neural-network (ANN)-based classification methods. The use of SVM in fault-type classification appears in [8] and [9] where the steady-state post fault voltages and currents are used as the input to the SVM fault-type classifiers.
The fault classification performance is enhanced by the integration of fuzzy theory and neural networks in [10] and [11]. Slavko Vasilic and Mladen Kezunovic [11] introduced advanced pattern recognition algorithm for classifying the transmission line faults, based on combined use of neural network and fuzzy logic. The concept is based on special type of self-organized, competitive neural network, called Adaptive Resonance Theory (ART), ideally suited for classifying large, highly-dimensional and time-varying set of input data. The new classification approach can reliably conclude, in a rather short time, whether, where and which type of the fault occurs under varying operating conditions. This type of neural network algorithm for relay protection has already been used in its original form and with simplified assumptions about the network and operating conditions.
and current symmetrical reactive power components are calculated. Based on these values single phase to earth fault, phase to phase fault and double phase to earth fault can be identified. Also the faulted phase can be selected by analyzing the sequential reactive power components.
II.PROPOSED METHOD
The symmetrical components of reactive power are given by
where Q1, Q2, and Q0 are, respectively, called positive-, negative-, and zero-sequence component of reactive power.
Also, V1 ,V2 ,and V0 are, respectively, positive-, negative-, and zero-sequence component of voltage measured at relay
point (either sending or receiving end of Fig.1). Similarly, I1 ,I2 ,and I0 are, respectively, positive-, negative-, and
zero-sequence component of current measured at relay point. In this work, Q2 and Q0 will be utilized to develop the
proposed method.
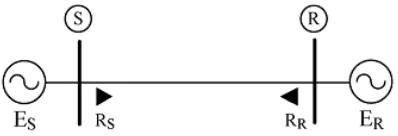
Fig. 1. Single-circuit transmission line protected by sending and receiving end relays.
A. Fault classification and faulted phase selection Single phase to ground fault
If the ratio Q0/Q2 is greater than 1 in any of the relay then it is a single phase to ground fault. |Q20| will have maximum
value in the faulted phase.
Double phase to ground fault
If the ratio Q0/Q2 is between 0 and 1 for both relays it is double phase to ground fault. For ABG fault |Q20| is maximum
in phase C. If |Q20| is maximum in phase A it is BCG fault. For CAG fault |Q20| is maximum in phase B.
Phase to phase fault
Δ Q12 is zero in healthy phase and non-zero for the faulty phase. Q12 is given by
.
B. Logical Pattern
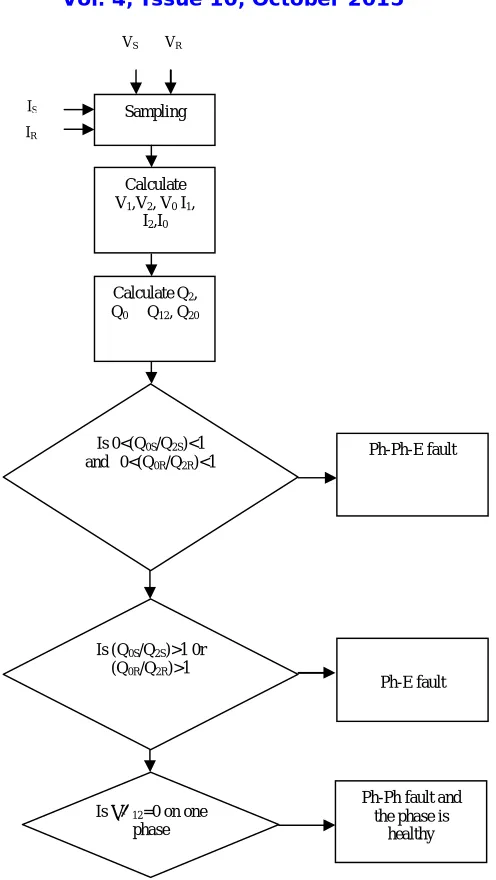
Fig. 2 illustrates a flowchart of the proposed method in a logical pattern. Three phase currents and three phase voltages are sampled . Sequential reactive powers are calculated by using the sequential components of voltage and current. In Fig. 3, Q0S and Q0R stand for zero-sequence reactive power at sending and receiving ends, respectively. Similar
definition holds for Q2S and Q2R.
After a fault inception is declared, the relays will firstly check if ΔQ12 is zero on one phase to identify phase-to-phase
faults and to find the healthy phase. At this stage, the relays can either share their information or decide individually. If
ΔQ12 not equal to zero on all three phases, ratio Q0/Q2 will be examined. From the view point of both relays, if 0<
Q0/Q2<1, a double-phase-to-earth fault will be declared and if Q0/Q2>1 from the view point of at least one relay, a
single-phase-to-earth fault will be declared. Here, both relays should share their own measurement by a pilot scheme. Faulted phase selection, however, is done locally, that is, each relay selects the faulted phase(s) by using its own measurement |Q20| as previously outlined.
) 1 ( } * Im{ 1 1*
1 V I
Q
) 2 ( } *
Im{ *
2 2
2 V I
Q
) 3 ( } *
Im{ *
0 0
0 V I
Q
) 4 ( } ) ( * )
Im{( 1 2 1 2 *
12 V V I I
Fig. 2. Proposed method in a logical pattern.
III. RESULT AND DISCUSSION
The transmission line model is implemented in the PSCAD 4.2.1 professional version. The 50-Hz, 400-kV simulated system is shown in Fig. 3.
Fig. 3. PSCAD model of transmission line
Is ∆Q12=0 on one
phase
Ph-Ph fault and the phase is
healthy Sampling
VS VR
IR
IS
Calculate V1,V2, V0 I1,
I2,I0
Calculate Q2,
Q0 Q12, Q20
Is 0<(Q0S/Q2S)<1
and 0<(Q0R/Q2R)<1
Is (Q0S/Q2S)>1 0r
(Q0R/Q2R)>1
Ph-Ph-E fault
The length of the transmission line was chosen 200 km. Sending end and receiving end sources are implemented using three phase voltage source model with base voltage level of 400kV and 380kV. The phase angles are set at 0o and 10o for sending end and receiving end respectively.
The fault classification and faulted phase selection algorithm was implemented using the MATLAB program. Various fault cases have been considered as tabulated in different tables. To avoid large numbers, Q20 and ∆Q12 are given in
per unit (pu) with the base power of 100 MW.
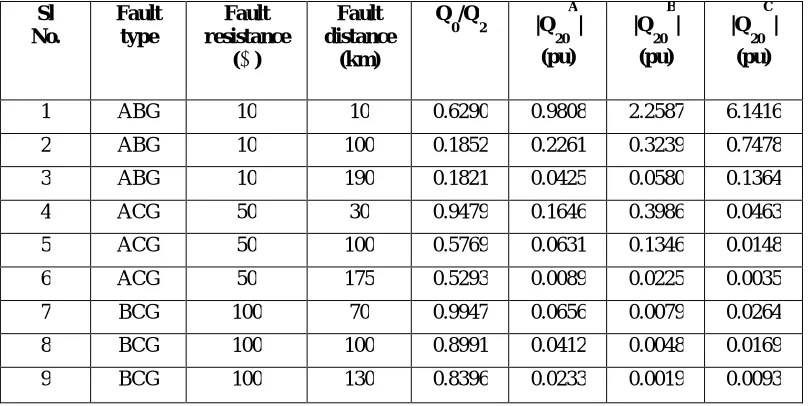
Table I: Values measured by sending end for different single line to ground faults
Sl No.
Fault type
Fault resistance
(Ω)
Fault distance
(km)
Q
0/Q2 |Q
20 A
| (pu)
|Q 20
B | (pu)
|Q 20
C | (pu)
1 AG 10 10 1.6116 5.2957 1.1380 1.5655
2 AG 10 100 1.3742 0.4361 0.0913 0.1259 3 AG 10 190 0.4564 0.1022 0.0265 0.0288
4 BG 50 10 1.6116 0.1533 0.5189 0.1114
5 BG 50 100 1.3742 0.0346 0.1201 0.0251
6 BG 50 190 0.4564 0.0032 0.0114 0.0029 7 CG 100 10 1.6116 0.0299 0.0412 0.1394
8 CG 100 100 1.3742 0.0083 0.0114 0.0396
9 CG 100 190 0.4564 0.0008 0.0008 0.0031
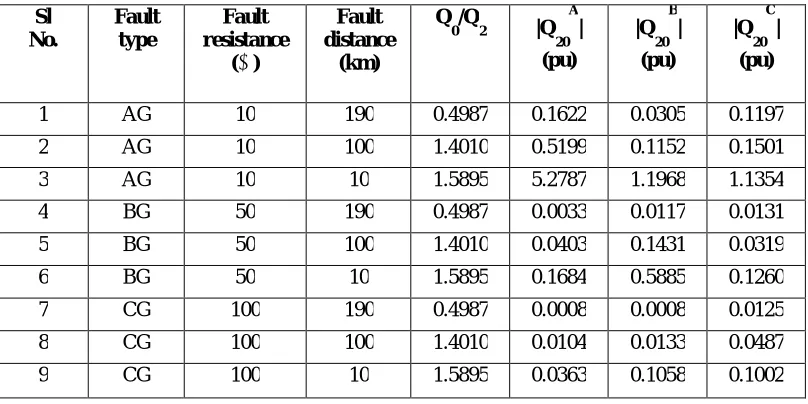
Table II: Values measured by receiving end for different single line to ground faults
Sl No.
Fault type
Fault resistance
(Ω)
Fault distance
(km)
Q
0/Q2 |Q
20 A
|
(pu)
|Q 20
B |
(pu)
|Q 20
C |
(pu)
1 AG 10 190 0.4987 0.1622 0.0305 0.1197
2 AG 10 100 1.4010 0.5199 0.1152 0.1501 3 AG 10 10 1.5895 5.2787 1.1968 1.1354 4 BG 50 190 0.4987 0.0033 0.0117 0.0131
5 BG 50 100 1.4010 0.0403 0.1431 0.0319 6 BG 50 10 1.5895 0.1684 0.5885 0.1260
7 CG 100 190 0.4987 0.0008 0.0008 0.0125 8 CG 100 100 1.4010 0.0104 0.0133 0.0487
9 CG 100 10 1.5895 0.0363 0.1058 0.1002
Table III: Values measured by sending end for different double line to ground faults
Sl No.
Fault type
Fault resistance
(Ω)
Fault distance
(km)
Q
0/Q2 |Q
20 A
|
(pu)
|Q 20
B |
(pu)
|Q 20
C |
(pu)
1 ABG 10 10 0.6290 0.9808 2.2587 6.1416
2 ABG 10 100 0.1852 0.2261 0.3239 0.7478
3 ABG 10 190 0.1821 0.0425 0.0580 0.1364
4 ACG 50 30 0.9479 0.1646 0.3986 0.0463
5 ACG 50 100 0.5769 0.0631 0.1346 0.0148
6 ACG 50 175 0.5293 0.0089 0.0225 0.0035
7 BCG 100 70 0.9947 0.0656 0.0079 0.0264
8 BCG 100 100 0.8991 0.0412 0.0048 0.0169
9 BCG 100 130 0.8396 0.0233 0.0019 0.0093
Table IV: Values measured by receiving end for different double line to ground faults
Sl No.
Fault type
Fault resistance
(Ω)
Fault distance
(km)
Q
0/Q2 |Q
20 A
|
(pu)
|Q 20
B |
(pu)
|Q 20
C |
(pu)
1 ABG 10 190 0.1946 0.0476 0.0685 0.7118
2 ABG 10 100 0.1888 0.2740 0.3768 0.9303
3 ABG 10 10 0.6343 1.0867 2.1257 3.2993
4 ACG 50 170 0.6020 0.0123 0.0308 0.0125
5 ACG 50 100 0.5881 0.0734 0.1607 0.0199
6 ACG 50 25 0.9931 0.1916 0.4919 0.0576
7 BCG 100 130 0.8773 0.0278 0.0037 0.0154
8 BCG 100 100 0.9167 0.0492 0.0063 0.0203 9 BCG 100 70 0.9910 0.0779 0.0105 0.0248
For double-phase-to-earth faults, Q0/Q2 was less than 1 at both ends, as seen in Tables III and IV. This confirmed a double-phase-to-earth fault. For ABG faults, |Q20| was the maximum on Phase C. For BCG and CAG faults, was the maximum on Phases A and B respectively. This disclosed the faulted phases. But the fault classification technique fails when fault location is on the extreme ends of the transmission line for high fault resistance case. As the fault resistance increases the span of length of transmission line in which the proposed method works reduces.
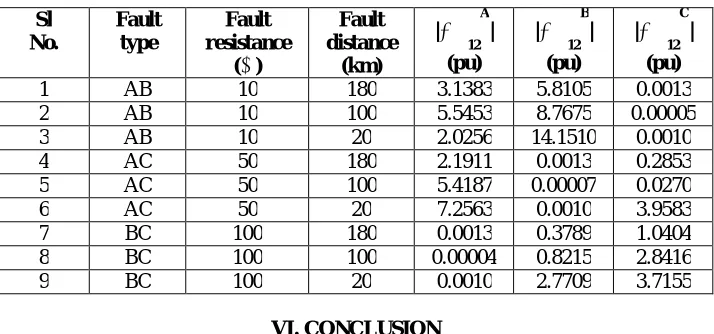
Table V and VI presents ∆Q12 on each phase measured by relays RS and RR for different phase-to-phase fault
Table V:Values measured by sending end for different phase to phase faults Sl No. Fault type Fault resistance (Ω) Fault distance (km) |∆Q 12 A | (pu) |∆Q 12 B | (pu) |∆Q 12 C | (pu)
1 AB 10 20 3.4504 19.3470 0.0009 2 AB 10 100 5.6532 10.3340 0.00006 3 AB 10 180 2.5493 6.3656 0.0006 4 AC 50 20 8.4356 0.0009 4.3539 5 AC 50 100 5.7786 0.00005 0.5113 6 AC 50 180 2.2233 0.0007 0.8158 7 BC 100 20 0.0009 3.0066 4.1922 8 BC 100 100 0.00004 1.2527 2.8809 9 BC 100 180 0.0007 0.7324 0.9828
Table VI:Values measured by receiving end for different phase to phase faults
Sl No. Fault type Fault resistance (Ω) Fault distance (km) |∆Q 12 A | (pu) |∆Q 12 B | (pu) |∆Q 12 C | (pu)
1 AB 10 180 3.1383 5.8105 0.0013 2 AB 10 100 5.5453 8.7675 0.00005 3 AB 10 20 2.0256 14.1510 0.0010 4 AC 50 180 2.1911 0.0013 0.2853 5 AC 50 100 5.4187 0.00007 0.0270 6 AC 50 20 7.2563 0.0010 3.9583 7 BC 100 180 0.0013 0.3789 1.0404 8 BC 100 100 0.00004 0.8215 2.8416 9 BC 100 20 0.0010 2.7709 3.7155
VI. CONCLUSION
A new approach to classify faults and to select faulted phases in single-circuit transmission lines was proposed by using the symmetrical components of electrical quantities. The requirement of the proposed fault classification function is a pilot scheme while using a pilot scheme is well established in new transmission-line protection technology.
There are several advantages to the proposed method which make it superior over existing ones. The main advantage of the fault classification method is that it is setting-free since it works with constant thresholds, that is, 1 and 0. Thus, it can be called an adaptive method since it will adapt itself with any operating condition. This feature of protective functions is very attractive since setting these functions always requires struggles. The second advantage to mention is that it utilizes Q0/Q2 at each end and, thus, data of each end are not required to be synchronized since Q0 and Q2 are
But the fault classification technique for double phase to earth fault fails when fault location is on the extreme ends of the transmission line for high fault resistance case. As the fault resistance increases the span of length of transmission line in which the proposed method works reduces. Future work will expand to resolve this problem.
REFERENCES
[1] A. Jamehbozorg and S. M. Shahrtash, “A decision-tree-based method for fault classification in single-circuit transmission lines,” IEEE Trans.Power Del., vol. 25, no. 4, pp. 2190–2196, Oct. 2010.
[2] O. A. S. Youssef, “New algorithm to phase selection based on wavelet transforms,” IEEE Trans. Power Del., vol. 17, no. 4, pp. 908–914, Oct.2002.
[3] Z.He,L.Fu,S.Lin,and Z.Bo, “Fault detection and classification in EHV transmission line based on wavelet singular entropy,” IEEE Trans. Power Del., vol. 25, no. 4, pp. 2156–2163, Oct. 2010.
[4] X. Dong,W. Kong, and T. Cui, “Fault classification and faulted-phase selection based on the initial current traveling wave,” IEEE Trans. Power Del., vol. 24, no. 2, pp. 552–559, Apr. 2009
[5] G.BenmouyalandJ.Mahseredjian, “A combined directional and faulted phase selector element based on incremental quantities,” IEEE Trans. Power Del., vol. 16, no. 4, pp. 478–484, Oct. 2001.
[6] T. Adu, “An accurate fault classification technique for power system monitoring devices,” IEEE Trans. Power Del.,vol.17,no.3,pp.684–690, Jul. 2002
[7] X.-N. Lin, M. Zhao, K. Alymann, and P. Liu, “Novel design of a fast phase selector using correlation analysis,” IEEE Trans. Power Del.,vol. 20, no. 2, pt. 2, pp. 1283–1290, Apr. 2005.
[8] P.K.Dash, S.R.Samantaray, and G.Panda, “Fault classification and section identification of an advanced series compensated transmission line using support vector machine,” IEEE Trans. Power Del., vol. 22, no. 1, pp. 67–73, Jan. 2007.
[9] R. Salat and S. Osowski, “Accurate fault location in the power transmission line using support vector machine approach,” IEEE Trans. Power Syst., vol. 29, no. 2, pp. 979–986, May 2004.
[10] . Wang and W. W. L. Keerthipala, “Fuzzy-neuro approach to fault classification for transmission line protection,” IEEE Trans. Power Del., vol. 13, no. 4, pp. 1093–1104, Oct. 1998.
[11] Slavko Vasilic and Mladen Kezunovic, “Fuzzy ART Neural Network Algorithm for Classifying the Power System Faults”, IEEE Trans. Power Del.,vol. 20, no. 2, April 2005
[12] Behnam Mahamedi and Jian Guo Zhu, “Fault Classification and Faulted Phase Selection Based on the Symmetrical Components of Reactive Power for Single-Circuit Transmission Lines,” IEEE Trans Power Del, vol. 28, no. 4, October 2013.
[13] Abouzar Rahmati and Reza Adhami, “A Fault Detection and Classification Technique Based on Sequential Components,” IEEE Trans. Industry Applications, vol. 50, no. 6, December 2014
BIOGRAPHY
Athira Rajan received B. Tech degree in Electrical and Electronics Engineering under Cochin University of Science and Technology, Kerala, India,in 2013. She is currently pursuing her M.Tech in Power Systems at Saintgits College of Engineering, Kottyam, Kerala, India.