Western University Western University
Scholarship@Western
Scholarship@Western
Electronic Thesis and Dissertation Repository
6-8-2017 12:00 AM
Predictive Shutdown Systems for Nuclear Power Plants
Predictive Shutdown Systems for Nuclear Power Plants
Drew J. Rankin
The University of Western Ontario
Supervisor Dr. Jin Jiang
The University of Western Ontario
Graduate Program in Electrical and Computer Engineering
A thesis submitted in partial fulfillment of the requirements for the degree in Doctor of Philosophy
© Drew J. Rankin 2017
Follow this and additional works at: https://ir.lib.uwo.ca/etd
Part of the Signal Processing Commons
Recommended Citation Recommended Citation
Rankin, Drew J., "Predictive Shutdown Systems for Nuclear Power Plants" (2017). Electronic Thesis and Dissertation Repository. 4635.
https://ir.lib.uwo.ca/etd/4635
This Dissertation/Thesis is brought to you for free and open access by Scholarship@Western. It has been accepted for inclusion in Electronic Thesis and Dissertation Repository by an authorized administrator of
Abstract
This dissertation investigates the use of a Kalman filter (KF) to predict, within the
shutdown system (SDS) of a nuclear power plant (NPP), whether a safety parameter
measurement will reach a corresponding trip set-point (TSP). The proposed predictive
SDS (PSDS) designs aim to initiate shutdown actions at a time which is earlier than
con-ventional shutdown initiation. These early detections are, in turn, expected to improve
safety and productivity margins within the NPP.
The KF-based point-PSDS design utilizes a linear time-varying (LTV) system model
to predict mean safety parameter measurements for comparison against the TSP. The KF
considers noise covariances that either have assumed predetermined values, or are
esti-mated online using an adaptive limited memory filter (ALMF). The PSDS is enhanced to
consider, by recursive least squares (RLS) estimation, conditions that are uncertain with
respect to the assumed system model and noise properties. The result is a KF/RLS-based
PSDS that compensates for prediction error by RLS-based estimation of deterministic
disturbances to the system state and measurement. The PSDS is further enhanced to
calculate confidence intervals for the predictions as a function of the propagated error
co-variance. This enhancement results in interval-PSDS designs that consider confidence in
an impending condition by comparing predetermined confidence interval bounds against
the TSP. Finally, an optimal-PSDS design is formulated to adapt the effective prediction,
occurrences respectively using hypothesis testing methods and optimal alarm theory. In
this manner, the optimal-PSDS is made aware of the quality of past predictions.
The PSDS designs are compared, through simulation and experiment, against a
con-ventional SDS in terms of response time or time-to-trip for the steam generator level low
(SGLL) safety parameter under various conditions of uncertainty, e.g. parameter error or
unmeasurable signals. MATLAB-based simulations demonstrate that the PSDS designs
are able to reduce time-to-trip. The PSDS designs are then implemented within a Tricon
v9 safety-PLC with a scan time that adheres to current nuclear industry regulations. The
experimental results reveal that a reduced time-to-trip can be achieved for a real-world
system with unknown system-model mismatch.
Keywords: prediction, Kalman filtering, uncertainty, optimal alarm, safety
This dissertation is dedicated to my beautiful wife Cara.
It is her love, support, encouragement, and understanding
that has made this research possible,
and that makes this life complete.
Acknowledgements
Thank you to my adviser Dr. Jin Jiang for ensuring that my doctoral studies were
productive, stimulating, and relevant, yet challenging. This research would not have
been possible without his continued support. I am very thankful for the freedom he has
provided me in taking on this research. It has been an honour to be his student.
This research would not have been possible without the assistance of my valued
col-leagues in the Control, Instrumentation, and Electrical Systems (CIES) research group.
Thank you to Dr. Xinhong Huang for helping me to develop both personally and
pro-fessionally. Thank you also to Dr. Sungwhan Cho and Dr. Ataul Bari for sharing your
experience and knowledge. My time here at Western was made more enjoyable in large
part due to the colleagues turned friends that have become an important part of my life.
Most importantly, Dr. Lingzhi Xia and Dr. Jianping Ma have provided me with insightful
dialog and cultural experiences since the early days of my studies. They have also helped
me to focus on the positive aspects of research life and to strive for excellence as well
as completion. Thank you both. Thank you also to Dr. Jingke She, Dr. Hisham
Mah-mood, Michael Gverzdys, Dennis Michaelson, Andrew Moore, Elizabeth Tomaszewski,
Mahmood Akkawi, Syed Ahmed Raza, and Kyle VanHoof for our many collaborative
research endeavours and impromptu discussions at the door of our adjoined labs.
In regards to this dissertation, thank you to the members of my doctoral examination
committee, Dr. Ilia Polushin, Dr. Vijay Parsa, Dr. Han-Ping Hong, and Dr. Jamie Coble,
have helped to strengthen this work. In addition, I am grateful for the funding and
equipment that have made this doctoral research possible. Specifically, financial support
from the Natural Sciences and Engineering Research Council of Canada (NSERC) and the
University Network of Excellence in Nuclear Engineering (UNENE) as well as equipment
made available by Invensys/Schneider and Ontario Power Generation (OPG). I am also
honoured to have received an Ontario Graduate Scholarship in Science and Technology
(OGSST) and an NSERC Postgraduate Scholarship-Doctoral (PGS-D).
Many thanks must be given to those friends that have helped me throughout these
many years of research. I am thankful to have a great group of friends that have provided
me with all forms of social support as well as regular escapes from the confines of research,
if only for moments at a time. You have each, in your own way, contributed to the success
of this work. Thank you specifically to Michael Fallaise for being my right hand man and
for challenging me to avoid complacency. Thank you also to the Pageau clan for letting
me be a part of your family and for taking interest in all that I do.
Lastly, thank you to my family for their love and encouragement. Thank you to
my parents Jan and Gary who encouraged me to be inquisitive, to love science and
engineering, and to pursue a life filled with learning. Thank you to my brothers Aric and
Bryce and their families for helping me to escape the madness that is doctoral research,
to have fun, to take adventures, and to sing well into the evening. Thank you also to my
Carson family for taking interest in my work and for never waning in your support of this
endeavour. Most of all, thank you to my loving, supportive, encouraging, and patient
wife Cara whose support throughout the course of my doctoral studies is appreciated
Contents
Abstract ii
Dedication iv
Acknowledgements v
Table of Contents vii
List of Figures xi
List of Tables xvii
List of Algorithms xviii
List of Appendices xix
List of Abbreviations, Symbols, Nomenclature xx
Acronyms and Initialisms . . . xx
Mathematical Notations . . . xxi
Roman Symbols . . . xxii
Greek Symbols . . . xxv
1 Introduction 1 1.1 Background and Motivation . . . 4
1.2 Problem Statements, Objectives, and Scope . . . 13
1.2.1 Shutdown system enhancement and reduction of time-to-trip . . . 14
1.2.2 Predictive shutdown concept . . . 17
1.2.3 Prediction of abnormal conditions under uncertainty . . . 19
1.2.4 Objectives . . . 25
1.2.5 Scope . . . 26
1.2.5.2 Experimental verification . . . 33
1.3 Contributions . . . 35
1.4 Organization . . . 37
2 Literature Review 39 2.1 Time-series Prediction . . . 40
2.1.1 Filtering and estimation . . . 40
2.1.2 Kalman-filter-based prediction . . . 50
2.1.3 Prediction under uncertainty . . . 56
2.2 Safety Instrumented and Shutdown Systems . . . 66
2.2.1 Regulations and standards . . . 67
2.2.2 CANDU shutdown systems . . . 69
2.2.3 Time-to-trip and shutdown system response time . . . 75
2.2.4 Optimal alarms . . . 78
3 Prediction under Uncertainty for Linear-Time-Varying Systems 81 3.1 State-space Modelling, Prediction, and Uncertainty . . . 84
3.2 Kalman-Filter-Based State Estimation . . . 93
3.2.1 The Kalman filter . . . 96
3.2.2 Related equations . . . 101
3.2.3 Initial conditions, convergence, model selection, and bumpless trans-fer . . . 104
3.3 Kalman-filter-based point-prediction . . . 109
3.4 Confidence and prediction intervals . . . 116
3.5 Kalman-filter-based measurement interval-prediction . . . 123
3.6 Noise covariances and uncertainty . . . 132
3.7 Monitoring for nonconvergence and divergence . . . 147
3.8 Summary . . . 150
4 Estimation of Disturbance Inputs for Prediction Error Compensation 152 4.1 Least-Squares-based Estimation of Disturbance Inputs . . . 156
4.1.1 Estimation and estimation error compensation . . . 160
4.1.2 Prediction error compensation . . . 171
4.2 Recursive Least Squares Formulation of Disturbance Estimation and Pre-diction Error Compensation . . . 179
4.2.1 Disturbance to the measurement . . . 181
4.2.3 Disturbances to both the measurement and state . . . 195
4.2.4 Resetting the disturbance and RLS covariance . . . 200
4.2.5 Adaptive-limited-memory-filter-based noise covariance estimation 204 4.3 Summary . . . 207
5 Predictive Shutdown and Assessment of Prediction Quality 209 5.1 A Conventional Shutdown System Design . . . 214
5.2 Predictive Shutdown System Designs . . . 217
5.2.1 Point-PSDS: point-predictive shutdown system . . . 220
5.2.2 Interval-PSDS: interval-predictive shutdown system . . . 223
5.3 Prediction Quality Assessment . . . 228
5.3.1 Hypothesis testing . . . 232
5.3.1.1 Innovation bound or Z test . . . 237
5.3.1.2 Normalized innovations squared or chi-squared χ2 test . 239 5.3.1.3 Innovation whiteness or autocovariance test . . . 242
5.3.2 Optimal alarms . . . 244
5.3.3 Optimal-PSDS: optimal predictive shutdown system . . . 251
5.4 Summary . . . 255
6 Experimental Setup 257 6.1 Physical System . . . 263
6.2 The Scaled-Irving Model . . . 266
6.3 Closed-loop Control . . . 271
6.4 Operating Modes . . . 273
6.5 Postulated Initiating Event . . . 276
6.6 Shutdown Systems . . . 278
6.6.1 Predictive shutdown, the Kalman filter, and point-prediction . . . 280
6.6.2 Noise covariances, stochastic uncertainty, and the adaptive limited memory filter . . . 284
6.6.3 Disturbance inputs, deterministic uncertainty, and the recursive least squared filter . . . 287
6.6.4 Point-, interval- and optimal-predictive shutdown system designs . 289 6.7 Summary . . . 292
7 Results and Analysis 294 7.1 Simulation Results . . . 295
7.1.2 PSDS Case 1: Reduced-order multi-model . . . 301 7.1.2.1 Case 1a: KF-based point-predictive shutdown . . . 302 7.1.2.2 Case 1b: KF-based interval-predictive shutdown without
ALMF . . . 308 7.1.2.3 Case 1c: KF-based interval-predictive shutdown with ALMF314 7.1.2.4 Case 1d: KF-based optimal-predictive shutdown . . . 317 7.1.3 PSDS Case 2: Reduced-order multi-model with parameter error . 320 7.1.3.1 Case 2a: KF-based point-predictive shutdown . . . 321 7.1.3.2 Case 2b: KF/RLS-based point-predictive shutdown . . . 324 7.1.3.3 Case 2c: KF/RLS-based interval-predictive shutdown . . 326 7.1.3.4 Case 2d: KF/RLS-based optimal-predictive shutdown . . 327 7.1.4 Summary . . . 329 7.2 Experimental Results . . . 332 7.2.1 Benchmark: Conventional shutdown . . . 333 7.2.2 PSDS Case 1: Reduced-order multi-model with measured PIE . . 335 7.2.2.1 Case 1a: KF/RLSy-based point-predictive shutdown . . 335
7.2.2.2 Case 1b: KF/RLSy-based interval-predictive shutdown
with ALMF . . . 337 7.2.2.3 Case 1c: KF/RLSy-based optimal-predictive shutdown . 339
7.2.3 PSDS Case 2: Reduced-order multi-model with unmeasured PIE . 340 7.2.3.1 Case 2a: KF/RLSy-based point-predictive shutdown . . 341
7.2.3.2 Case 2b: KF/RLSy-based interval-predictive shutdown
with ALMF . . . 343 7.2.3.3 Case 2c: KF/RLSy-based optimal-predictive shutdown . 344
7.2.4 Summary . . . 345
8 Conclusions and Recommendations 348
8.1 Recommended future work . . . 352
Bibliography 354
Appendices 366
List of Figures
1.1 Operating conditions/modes, set-points/thresholds/limits, and conceptual events and system transients, trajectories, or paths of operation. . . 6 1.2 Improvement of a) conventional trip in terms of b) safety and c)
produc-tivity margins as a conceptual result of predictive trip. . . 9 1.3 Sample trip sequence and time-to-trip measure for SDS1 of the CANDU
NPP. Unless stated otherwise, time-to-trip is the total amount of time of these time components. . . 10 1.4 The concept of predictive shutdown, or predictive trip, for a single safety
parameter with a predictive trip occurring at time-step k. . . 18 2.1 The conventional SDS trip logic within the context of safety instrumented
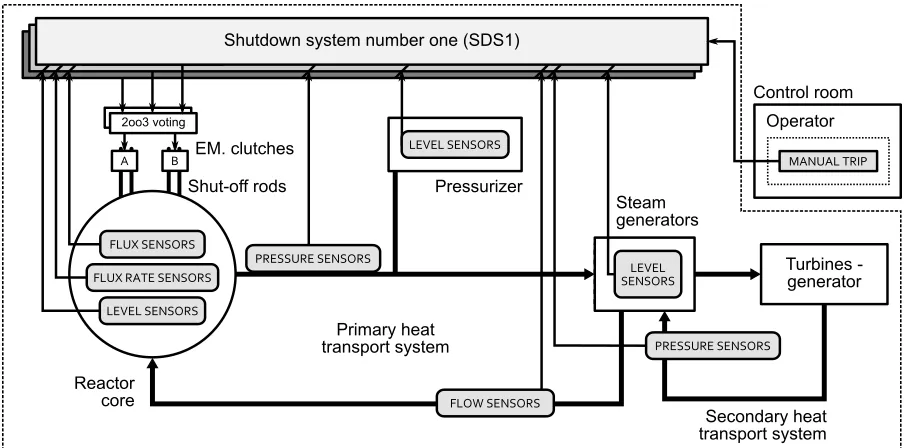
systems (SISs). . . 70 2.2 CANDU SDS1 safety parameters and related subsystems. . . 73
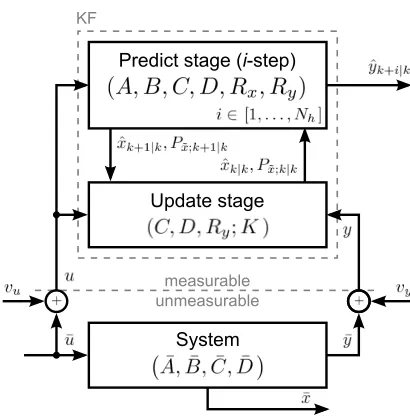
3.1 Combined state and measurement equations in (3.1) and (3.2) respectively. 86 3.2 Combined stochastic state and measurement equations in (3.9) and (3.10). 91 3.3 Connectivity between the system and a state observer, which may be
KF-based, within the context of state estimation. . . 93 3.4 Combined a posteriori and a priori state estimation equations in (3.16)
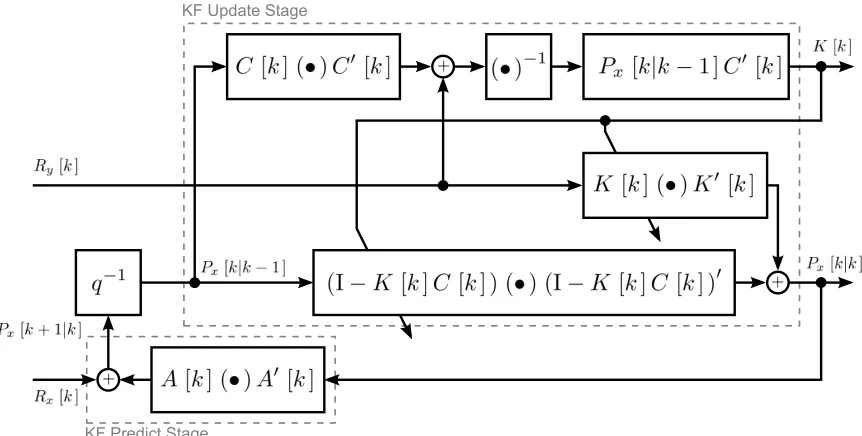
and (3.18) respectively; the angled arrow indicates an adaptive parameter, in this case K[k]. . . 98 3.5 Combined Kalman gain equation in (3.15) as well as thea posteriori and
a priori state estimation equations in (3.17) and (3.19) respectively; (•) indicates where the input variable is substituted within the equation of the corresponding block. . . 99 3.6 Connectivity between the system and the KF-based state estimation
pro-cedure of Algorithm 3.1. . . 100 3.7 The a priori state estimate equation in (3.18) under the assumption that
3.8 Connectivity between the system and the KF-based measurement predic-tion procedure of Algorithm 3.2. . . 112 3.9 Confidence intervals of significance levels α≈0.023 andα= 0.159 for the
a) respective outer and inner bounds of a sequence of measurement errors, ˜
y, and corresponding b) one-tailed bound as well as, c) two-tailed bound including probability density function (PDF). . . 117 3.10 Thea priori state error covariance equation in (3.19) under the assumption
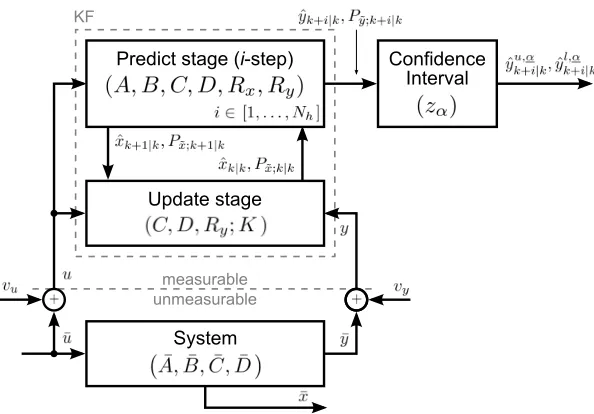
that the future model parameters and system inputs remain at the same values as for current time-step,k. . . 125 3.11 Connectivity between the KF-based measurement prediction as well as
confidence interval calculation procedures of Algorithm 3.3. . . 126 3.12 Confidence interval of significance level α= 0.0004 and level of confidence
equal to 99.96% for the a) bounds of a sequence of measurement errors, ˜
y, and corresponding b) two-tailed predictive decision problem including probability density function (PDF) and the value of the cumulative prob-ability outside of the bounds. . . 129 3.13 Confidence interval of one-tailed significance level α= 0.0002 and level of
confidence equal to 99.98% for the a) bounds of a sequence of measure-ment errors, ˜y, and corresponding b) one-tailed lower bound, as well as c) one-tailed upper bound including probability density function (PDF) and values of the cumulative probability within and outside of the bounds. . . 130 3.14 Connectivity between KF-based state estimation and the error covariance
procedures of Algorithm 3.5. . . 145
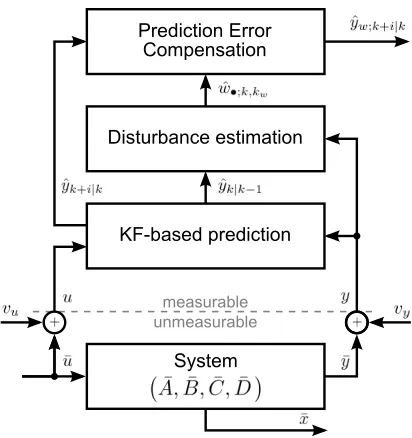
4.1 Disturbance estimation and prediction error compensation to complement the KF-based measurement prediction algorithms of Chapter 3. . . 154 4.2 Connectivity between KF-based measurement prediction and the
measure-ment disturbance estimation and prediction error compensation procedure of Algorithm 4.1. . . 188 4.3 Connectivity between KF-based measurement prediction and the
measure-ment disturbance estimation and prediction error compensation procedure of Algorithm 4.1. . . 194 4.4 Connectivity between KF-based measurement prediction and the
5.1 Modular modification of a) conventional SDS logic to include the following capabilities b) prediction quality assessment and alarm/trip optimization, c) safety parameter prediction, d) uncertainty or noise covariance estima-tion, and c) prediction error compensaestima-tion, all within the context of safety instrumented systems (SISs). . . 211 5.2 Conventional shutdown system (SDS) in the context of safety instrumented
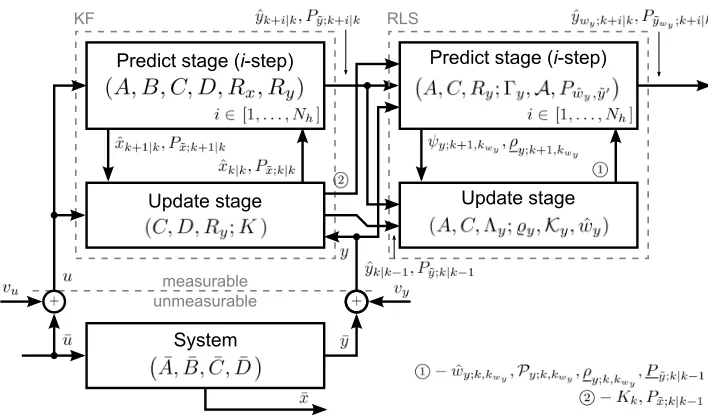
systems (SISs). . . 214 5.3 KF/RLS-based point-predictive shutdown system (point-PSDS) in the
context of safety instrumented systems (SISs) with the option for acti-vating RLS or ALMF algorithms. . . 221 5.4 KF/RLS-based interval-predictive shutdown system (interval-PSDS) in
the context of safety instrumented systems (SISs) with the option for ac-tivating RLS or ALMF algorithms. . . 224 5.5 IB or Z test statistics and critical values for unbiased prediction error as
well as positive and negative biases that are introduced at time-step 250. 239 5.6 NIS or χ2 test statistics and critical values for unbiased prediction error
as well as positive and negative biases, and over and underestimated error covariances that are introduced at time-step 250. . . 242 5.7 Receiver operating characteristic (ROC) space. . . 245 5.8 Constrained region and optimal behaviour of the optimal alarm within the
receiver operating characteristic (ROC) space. . . 250 5.9 KF/RLS-based optimal-predictive shutdown system (optimal-PSDS) in
the context of safety instrumented systems (SISs) with the option for ac-tivating RLS or ALMF algorithms. . . 252
6.1 U-tube steam generator with admissible range, yR. . . 258
6.2 The a) simulation and b) experimental platforms. . . 261 6.3 Functional diagram of the physical plate level system (PLS) in the a)
nominal and b) compensated, or modified, form. . . 264 6.4 Open-loop response of the scaled-Irving model to a 10kg/s step increase
in a) feedwater flow-rate,qe, and b) steam flow-rate, qv. . . 269
6.5 Swell-based point function, steam generator level low (SGLL) trip set-point and level high (SGLH) alarm threshold. . . 273 6.6 Steam generator water level responses to power transients a) step-wise
6.7 Steam generator water level response to an unanticipated step change in water level set-point at a power level of 30% with set-point made equal to 29.1% at 10s. This is the nontrip-SPD transient. . . 276
7.1 Benchmark: simulated conventional SGLL trip occurrences due to loss of feedwater flow PIE during a) SWPI and b) PRD power transients. . . 298 7.2 Benchmark: simulated conventional SGLL trip occurrences due to a
dis-turbance in the water level set-point from a normal value of 62.24% to an anomalous value of 29.0%. . . 299 7.3 Benchmark: time-steps surrounding conventional SGLL trip occurrences
plotted for a) SWPI as in Figure 7.1a), b) PRD as in Figure 7.1b), and c) trip-SPD as in Figure 7.2. . . 300 7.4 Case 1a: simulated KF-based point-predictive SGLL trip occurrences due
to loss of feedwater flow PIE during a) SWPI and b) PRD power transients under multi-model matching conditions. . . 304 7.5 Case 1a: simulated KF-based point-predictive SGLL trip occurrences due
to a disturbance in the water level set-point from a normal value of 62.24% to disturbed values of a) 29.0%, and b) 29.1% under multi-model matching conditions. . . 305 7.6 Case 1a: time-steps surrounding the simulated KF-based point-predictive
SGLL trip occurrences for a) SWPI, b) PRD, c) trip-SPD, and d) nontrip-SPD under multi-model matching conditions. . . 306 7.7 Case 1a: KF-based point-predictions being propagated over the prediction
window,i= 0,. . ., 3, while approaching the SGLL trip occurrence during a) SWPI, b) PRD, and c) trip-SPD transients under multi-model matching conditions. . . 308 7.8 Case 1b: time-steps surrounding the simulated KF-based interval-predictive
SGLL trip occurrences due to a loss of feedwater flow PIE during a) SWPI and b) PRD, c) trip-SPD, and d) nontrip-SPD transients under multi-model matching conditions without ALMF-based noise covariance estimation. . . 311 7.9 Case 1b: KF-based point-predictions being propagated over the prediction
7.10 Case 1b: KF-based point-predictions being propagated over the prediction window,i= 0,. . ., 3, while approaching the SGLL trip occurrence during an SWPI power transient with assumed state noise covariances of a) ˆRx =
diag (0.1), and b) ˆRx = diag (3120.0). . . 313
7.11 Case 1c: simulation of KF-based interval-predictive SGLL trip occurrences due to a loss of feedwater flow PIE during a) SWPI, b) PRD, c) trip-SPD, and d) nontrip-SPD transients under multi-model matching conditions with ALMF-based noise covariance estimation. . . 315 7.12 Case 1c: examples of the KF-based interval-predictions iterating over the
entire prediction time-interval, i = 0,. . ., 3, while approaching the SGLL trip occurrence during a) SWPI and b) PRD power transients under multi-model matching conditions with ALMF-based noise covariance estimation. 316 7.13 Case 1d: simulation of KF-based optimal-predictive SGLL trip occurrences
due to a loss of feedwater flow PIE during a) SWPI, b) PRD, c) trip-SPD, and d) nontrip-SPD transients under multi-model matching conditions. . 319 7.14 Case 2a: time-steps surrounding the simulated KF-based point-predictive
SGLL trip occurrences for a) SWPI, b) PRD, c) trip-SPD, and d) nontrip-SPD under the model parameter error condition. . . 322 7.15 Case 2a: time-steps surrounding the simulated KF-based point-predictive
SGLL trip occurrences for a) SWPI and c) trip-SPD under the model parameter error condition with only ALMF-based state noise covariance estimation and constant measurement noise covariance, ˆRy = 6.24. . . 323
7.16 Case 2b: time-steps surrounding the simulated KF/RLS-based point-predictive SGLL trip occurrences for a) SWPI and b) PRD under the model param-eter error condition. . . 324 7.17 Case 2b: simulated KF/RLS-based point-predictive SGLL missed-trip
oc-currence during the trip-SPD transient under the model parameter error condition. . . 325 7.18 Case 2c: time-steps surrounding the simulated KF/RLS-based
interval-predictive SGLL trip occurrences for a) SWPI and b) PRD under the model parameter error condition. . . 326 7.19 Case 2d: time-steps surrounding the simulated KF/RLS-based
7.20 Case 2d: time-steps surrounding the simulated KF/RLS-based optimal-predictive SGLL trip occurrences for a) SWPI, b) PRD, and, c) trip-SPD under the model parameter error condition. . . 329 7.21 Benchmark: experimental conventional SGLL trip occurrences due to loss
of feedwater flow PIE during a) SWPI and b) PRD power transients. . . 334 7.22 Case 1a: experimental point-predictive trip due to SGLL during power
transients a) SWPI and b) PRD under model mismatch. . . 337 7.23 Case 1b: interval-predictive trip due to SGLL during power transients a)
SWPI and b) PRD under model mismatch. . . 338 7.24 Case 1c: optimal-predictive trip due to SGLL during power transients a)
SWPI and b) PRD under model mismatch. . . 340 7.25 Case 1c: interval-predictive trip due to SGLL during power transients a)
SWPI and b) PRD under model mismatch. . . 341 7.26 Case 2a: point-predictive trip due to SGLL during power transients a)
SWPI and b) PRD under model mismatch and unmeasured initiating event.342 7.27 Case 2b: interval-predictive trip due to SGLL during power transients a)
SWPI and b) PRD under model mismatch and unmeasured initiating event.344 7.28 Case 2c: optimal-predictive trip due to SGLL during power transients a)
List of Tables
5.1 Error matrix. . . 233 5.2 Condition table for combination IB and NIS tests. . . 243
6.1 Irving model parameters, steam flow-rates as well as control intervals, and controller gains at specific power levels. . . 267 6.2 Control intervals, and controller gains for the discretized controller within
power level operating ranges. . . 272 6.3 State noise covariance estimates for use without ALMF. . . 286
7.1 Summary of the PSDS methods that are investigated within each simula-tion case. ∗ indicates both with and without the ALMF . . . 297 7.2 Power level selection by steam flow-rate to determine the active
scaled-Irving parameters within the KF of the PSDS. . . 302 7.3 Summary of simulation time-to-trip,kc orkp, and effective prediction
hori-zon, Npe, results.
∗ - a false trip occurs for nontrip-SPD . . . 330 7.4 Summary of experimental time-to-trip and effective prediction horizon
List of Algorithms
3.1 Kalman-filter-based (KF) state estimation, KFe. . . 100
3.2 Kalman-filter-based (KF) state and measurement point-prediction, KFp,
under the assumption that the future model parameters and system inputs remain at the same values as for current time-step, k. . . 113 3.3 Kalman-filter-based (KF) measurement interval-prediction, KFip, under
the assumption that the future model parameters and system inputs have the same values as for the current time-step, k. . . 127 3.4 Adaptive-limited-memory-filter-based (ALMF) measurement ALMFy and
state ALMFx noise covariance estimation . . . 143
3.5 Initialization of the noise covariance estimation subroutines using adaptive limited memory filter (ALMF) . . . 144 3.6 ALMF/KF-based state estimation . . . 146 4.1 Update and predict stages of the recursive least squares (RLS)
measure-ment disturbance input estimation and prediction error compensation pro-cedure,RLSy,ip. . . 187
4.2 Update and predict stages of the recursive least squares (RLS) state dis-turbance input estimation and prediction error compensation procedure
RLSx,ip. . . 193
4.3 RLS/KF-based measurement interval-prediction with combined measure-ment and state disturbance input estimation and prediction error compen-sation where the measurement disturbance is considered primary. . . 201 4.4 RLS/KF-based measurement interval-prediction with ALMF noise
List of Appendices
List of Abbreviations, Symbols,
Nomenclature
Acronyms and Initialisms
2oo3 Two out of three . . . 72
ALMF Adaptive limited memory filter . . . 28
AOO Anticipated operational occurrence . . . 5
BDBA Beyond design basis accident . . . 6
CANDU Canadian Deuterium Uranium . . . 10
CDF Cumulative distribution function . . . 116
CNSC Canadian Nuclear Safety Commission . . . 70
CP-1 Chicago Pile number 1 . . . 4
CPU Central processing unit . . . 8
DBA Design basis accident . . . 6
DCS Distributed control system . . . 7
EKF Extended Kalman filter . . . 44
EnKF Ensemble Kalman filter . . . 46
EPS Emergency protection system . . . .4
FNR False negative rate . . . 33
FPGA Field programmable gate array . . . 8
FPR False positive rate . . . 33
IAEA International Atomic Energy Agency . . . 4
IB Innovation bound . . . 32
IEC International Electrotechnical Commission . . . 67
IW Innovation whiteness . . . 32
KF Kalman filter . . . 11
LOCA Loss of coolant accident . . . 34
LS Least squares . . . 11
LSSS Limiting safety system setting . . . 7
LTI Linear time-invariant . . . 28
LTV Linear-time-varying . . . 28
µC Micro-controller . . . 265
MPC Model predictive control . . . 20
MWe Megawatts electric . . . 2
NIS Normalized innovations squared . . . 32
NPP Nuclear power plant . . . 1
NPV Negative preditive value . . . 234
OPG Ontario Power Generation . . . 279
OPL Operations per loop . . . 98
PI Proportional integral . . . 260
PIE Postulated initiating event . . . 5
PLC Programmable logic controller . . . 7
PLS Plate level system . . . 260
PDF Probability density function . . . 116
PSDS Predictive shutdown system . . . 11
RLS Recursive least squares . . . 22
ROC Receiver operating characteristic . . . 78
RPS Reactor protection system . . . 4
RRS Reactor regulating system . . . 15
RTS Reactor trip system . . . 4
SCRAM Safety control rod axe man . . . 4
SDS Shutdown system . . . .4
SDS1 Shutdown system number one . . . 10
SGLL Steam generator level low . . . 34
SIF Safety instrumented function . . . 67
SIS Safety instrumented system . . . 3
SPD Set-point disturbance . . . 274
SVD Singular value decomposition . . . .119
TPR True positive rate . . . 33
TSP Trip set-point . . . 7
UKF Unscented Kalman filter . . . .45
US-NRC United States Nuclear Regulatory Commission . . . 4
Mathematical Notations
• Symbol placeholder; represents any symbol that satisfies the accompany-ing context, or; the placement of an input variable within the block of a block diagram . . . 99 , Defined to be equal to . . . .86 | A value or event that is conditional given the occurrance of the respective time-step or event that is to the right of the operator . . . 95 ∈ Belongs to, or is within the set of . . . 85
q−1 Backward shift, or delay, operator; operates on an element of a time-series to produce the previous element within the time-time-series . . . 85 Pr (•) Probability of a specified event occurring . . . 117
S(•) LS objective function . . . 160 diag (•) A matrix of diagonal elements equal to• and off-diagonal elements equal to zero . . . 310 erf−1(•) Inverse Gaussian error function . . . 120
E{•} Expectation of a signal/sequence of samples . . . 94 •[k] Primary representation of time-dependency . . . 85 ¯
• The true value of a parameter or signal, vector, or matrix that is the exact representation of the actual system . . . 93 ˆ
• Estimate or approximation of a vector . . . 89 •k Alternative representation of time-dependency . . . 100 •n×n An n byn vector/matrix of• elements . . . 105 •′ The transpose of a matrix, or vector . . . .94 (•)2 Square of a value, vector, or matrix, calculated as (•)2 = (•) (•)′ . . . . 105 ˜
• Error between the estimated and true values of a vector or matrix . . . 95 • Symbol modifier that indicates an alternate interpretation of a variable . . . 105 •w A vector/matrix that is associated with the least squares estimation of
prediction error . . . 157
Roman Symbols
Ax Combined KF update and propagation matrices for additive disturbance
to state equation . . . 167
Ay Combined KF update and propagation matrices for additive disturbance
to measurement equation . . . 161 arg min
•
value . . . .162
A,B,C,D State, input-to-state, state-to-measurement, and feed-through matrices; together referred to as the system matrices . . . 85
Fe,Fv Digital filters for open-loop compensation of the feedwater and steam
flow-rate signals . . . 265
F N False negative . . . 232
F P False positive . . . 232
τ1,τ2 Irving steam generator model parameters . . . 267
G1,G2,G3 Irving steam generator model gain parameters . . . .267
hy,• Half-width of measurement confidence interval for corresponding signifi-cance level • . . . 125
H0 Null hypothesis . . . 232
H1 Alternate hypothesis . . . 232
HPLS Continuous time transfer function of the nominal plate level system 268
I Identity matrix of appropriate dimension . . . 97
j• Indices of time-steps within a sequence, window, range of time-steps; usu-ally within a series summation or product . . . 88 K RLS gain matrix . . . 180 KFe Standard Kalman filter (KF) state estimation algorithm . . . 105
KFe Standard Kalman filter (KF) state estimation algorithm . . . 101
KFip Kalman filter (KF) measurement interval-prediction algorithm . . . 126
KFp Kalman filter (KF) measurement point-prediction algorithm . . . 112
K Kalman gain matrix . . . 96
k Current time-step; number of time-steps that have passed since the onset of the simulation or experiment, t/Ts . . . 17
Kf,Km Frequency and magnitude scaling parameters for the scaled-Irving steam
generator model . . . .267
KCO Common gain for the level error within the three element proportional
integral controller . . . 272
KC Common gain within the three element proportional integral controller
. . . 272
kc Time-step of conventional trip . . . 17
kd Time-step of detecting an abnormal condition . . . 297
ke Time-step of initiating the postulated initiating event (PIE) . . . 297
KIO Interval gain for the level error within the three element proportional
KI Interval gain within the proportional integral controller . . . .272
kp Time-step of predictive trip . . . 17
N Positive integer representing a number of time-steps . . . 17
n Dimension of a matrix/vector . . . 85
NO Length of window over which detectability or observability is calculated . . . .89
Np Length of window over which predictions are calculated . . . 17
Np Length of window over which predictions are calculated . . . 297
Nv Length of window over which state error covariances are calculated . 139
O Observability matrix . . . 89
O Big O notation for computational complexity . . . .101 P Covariance of the RLS disturbance estimate . . . 181
P•1,•2 Cross-covariance between the signals included in the subscript . . . 165
P• Covariance of the signal included in subscript . . . 95
Qe,Qv Steam generator feedwater and steam flow-rates within the s-domain 267
qe,qv Feedwater and steam flow-rate signals . . . 266
Rn×n An n byn matrix/vector of real-valued elements . . . 85
R Steam generator water level set-point within the s-domain . . . .271
r Steam generator water level set-point . . . 273
rx Initial state covariance scaling parameter within the Kalman filter . . 107
Rx,Ry State and measurement noise covariance matrices . . . .93
RLSx,ip Recursive least squares (RLS) state disturbance input estimation . . . 194
RLSy,ip Recursive least squares (RLS) measurement disturbance input estimation
. . . 188
s Complex laplace variable and frequency parameter . . . 267 Θ Precentage reactor power level . . . 268
Υ Irving steam generator model parameter . . . 267
t Relative time; the amount of time that has passed since the onset of the simulation or experiment . . . 85
TCI Control interval within the process controller . . . 271
Ts Sampling interval; the amount of time between the samples at subsequent
discrete time-steps within the process controller as well as the shutdown system . . . 17
T N True negative . . . 233
T P True positive . . . 232
vx,vy State and measurement noise vectors/signals . . . 90
wx,•,wy,• Disturbance inputs to the individual components of the state and mea-surement disturbance models . . . 158
wx,wy State and measurement disturbance inputs . . . 157
x,y,u System state, system measurement, and system input signals . . . 85
xR Magnitude of the admissible range with the domain of the state . . . . 106
ˆ
yu,α, ˆyl,α Upper and lower limits of significance level α . . . 120
Y Steam generator water level within the s-domain . . . 267
ysim, yexp Simulated and experimental water levels, when included in the same plot . . . 274
yR Admissible range within the assumed Irving steam generator model 258
yR,PLS Admissible range within the plate level system . . . 268
Zn×n An n byn matrix/vector of integer-valued elements . . . 85
z• Statistical score associated with a specified significance level . . . 117
Greek Symbols
α One-sided significance level . . . .116
α Two-sided significance level . . . 118 Γx,•, Γy,• Equivalent state matrices for the individual components of the state and measurement disturbance profiles . . . 158
γx,•,γy,• Individual components of the state and measurement disturbance profiles . . . 158 Γx, Γy Dynamic profiles of the state and measurement disturbances . . . 157
Γx,•, Γy,• Equivalent state-to-measurement matrices for the individual components of the state and measurement disturbance profiles . . . 158 Λx Matrix of forgetting factors for least squares estimation of an additive
state disturbance . . . .169
λx Scalar forgetting factor for least squares estimation of an additive state
disturbance . . . 169 Λy Matrix of forgetting factors for least squares estimation of an additive
measurement disturbance . . . 163
λy Scalar forgetting factor for least squares estimation of an additive
mea-surement disturbance . . . 163
λ• Scalar forgetting factor for each time-step within the least squares esti-mation of an additive state disturbance . . . 168
estimate . . . 189
ψy Pseudo cumulative effect of measurement disturbance profile, Γy, on
mea-surement estimate . . . 182
ρx,ρy Effect of state and measurement disturbances on measuremnt estimate
. . . 160
ρx Cumulative effect of state disturbance model, Γx, on measurement
esti-mate . . . 167
ρy Cumulative effect of measurement disturbance model, Γy, on
measure-ment estimate . . . .161
ρ
x Cumulative effect of state disturbance model, Γx, on state estimate . 167
σ• Standard deviation of• . . . 107 Θ Switching function for the alternating disturbance estimation procedure . . . 203
θ Parameter vector . . . 86
ξ Conventional trip signal that contains a set of high and low trip signals,
ξh and ξl . . . 215
ξp Predictive trip signal that contains a set of high and low predictive trip
signals,ξp,h and ξp,l . . . 221
Ξc, Ξp Effective conventional and predictive trip set-point . . . 18
Ξl Steam generator level low trip set-point . . . 273
Chapter 1
Introduction
In general, an unsafe system has the potential for an uncontrolled release of large amounts
of energy. In contrast, a safely operating nuclear power plant (NPP) releases energy in a
controlled manner. Within an NPP, nuclear energy is first converted into thermal energy
within the reactor core by means of fissile material undergoing fission reactions. All NPP
designs utilize nuclear energy to produce electrical power. Within pressurized water reactor
and pressurized heavy water reactor NPP designs, the thermal energy is transferred between
the coolants of one or more subsequent heat transport loops to a subsystem known as the
steam generator or boiler. As thermal energy accumulates in the secondary-side coolant
of the steam generator, the coolant boils and the resulting steam is piped out of the top
of the steam generator. For electrical power generation, and within all NPPs, the net
positive kinetic energy of some flowing material is then made to rotate a set of turbines
that are affixed to the rotor of an electrical generator. This rotation results in the kinetic
energy being converted into electrical energy. Finally, electrical power is output from the
generator to a switch-yard where a small portion of the total power is returned to the
distribution, and consumption.
The thermodynamic efficiency of the a nuclear power generating system increases in
pro-portion to the nominal operating thermal power of the reactor core. This nominal amount
of thermal power, in turn, determines the amount of electrical power that is output by the
electrical generator. Thus, in order to improve thermodynamic efficiency, the electrical
power output of a single NPP unit is usually rather large, ranging from hundreds to
thou-sands of megawatts electric (MWe). Large amounts of energy therefore flow between, and
are stored throughout, the subsystems of an NPP. These large amounts of energy increase
the potential for accidents involving uncontrolled releases of energy to occur. In addition,
NPPs utilize a radioactive primary fuel source that, if affected, may significantly increase
the severity of such accidents. NPP designs therefore undergo continual enhancement to
include measures that aid in preventing and mitigating the consequences of severe
acci-dents, i.e. accidents that involve significant core degradation. These enhanced measures
aim to protect workers, the public, and the environment from the harmful effects of the
ionizing radiation that is produced as a result of fission reactions and is to be contained
during a severe accident [1]. The development of these enhanced measures is essential in
reducing the likelihood of future severe accidents like those that have occurred at Three
Mile Island NPP Unit 2 in 1979, Chernobyl NPP Unit 4 in 1986, and Fukushima Daiichi
NPP Units 1, 2, 3, and 4 in 2011.
In line with the concepts of prevention, mitigation, and protection, this dissertation
aims to enhance the decision-making mechanism or logic solver within a shutdown type
of NPP automatic protection system by including the capability of predicting an
functional replacements that have historically been performed when replacing existing
pro-tection systems with modern computer-based technologies. The predictive shutdown
meth-ods of this dissertation take advantage of increases in computational power and advanced
functional capabilities that are common to modern industrial computerized technologies.
These methods are, at the same time, constrained by the capabilities of these technologies
when compared against cutting edge computer processors and supercomputers.
In achieving the above aim, it is expected that abnormal conditions will be predicted
at a time which is earlier than conventional shutdown detection. This early detection
is essentially a reduction in the amount of time between a trip inducing fault, failure,
or initiating event and the activation of sufficient protective actions within the reactor
core. It is expected that this reduction in time will, in turn, result in increased margins
of safety between peak surges in energy, inventory, pressure, temperature, and flow, and
the physical limits of the subsystems and components within the NPP. Moreover, these
increased margins of safety are also expected to reduce the likelihood of the NPP dynamics
reaching unsafe, or accident conditions. The predictive decision-making methods developed
herein are also not limited to shutdown applications or the NPP systems. These methods
may therefore be applied within the logic solvers of a safety instrumented system (SIS)
for a variety of generic applications in order to make early decisions regarding impending
safety-related conditions.
The remainder of this chapter is organized as follows. Section 1.1 introduces industry
specific terminology, establishes context regarding the enhancement of NPP automatic
protection systems, and provides a brief introduction to the prediction methods. Section
reduce protection system response time and to achieve earlier activations of the related
safety function. Section 1.2 elaborates on the two high-level problems that are investigated
within this dissertation, conceptualizes a predictive shutdown sequence, and segments the
two problems into a list of objectives. Section 1.2 also states the scope of this research,
including high level limitations and assumptions. Section 1.3 describes the main theoretical
and practical contributions, and deliverables that are the result of this study. Finally, the
organization of this dissertation is outlined in Section 1.4.
1.1
Background and Motivation
According to the United States Nuclear Regulatory Commission (US-NRC), shutdown is
a decrease in the rate of fission and heat or thermal energy production within a reactor [2].
Shutdown may also be referred to as: trip, i.e. the activation of a mechanism, or safety
control rod axe man (SCRAM)1, as used during the first controlled release of energy by
nuclear fission at Chicago Pile number 1 (CP-1) [5,6]. The components within an NPP that
are responsible for shutdown are commonly referred to as a shutdown system (SDS) while
reactor protection system (RPS), reactor trip system (RTS), and emergency protection
system (EPS) may also be used [7, 8].
The International Atomic Energy Agency (IAEA) categorizes SDSs within a
sub-category of safety systems known as protection systems. According to the IAEA, a
protec-tion system “encompasses all electrical and mechanical devices and circuitry, from and
including the sensors up to the input terminals of the safety actuation systems and the
1
safety system support features, involved in generating the signals associated with the
pro-tective tasks” [9]. Further, the IAEA states that the purpose of a protection system within
an NPP is to “monitor the operation of a reactor and which, on sensing an abnormal
condition, automatically initiate actions to prevent unsafe conditions” [10]. An SDS is
therefore a collection of electrical and mechanical devices and circuitry that monitor the
operation of a reactor as well as supporting subsystems and, upon sensing an abnormal
condition, automatically initiates actions to decrease the rate of fission and heat or thermal
energy production within the reactor core. Each subsystem is referred to individually as a
system being protected when it is necessary to discern the system that is being protected
from an otherwise unprotected system.
The subsystems of an NPP operate within one of many different operating modes or
conditions; normal, abnormal, unsafe, and emergency or accident. These conditions are
illustrated in Figure 1.1 along with the thresholds that are the boundaries or limits between
the conditions. This conceptual illustration includes conditions that are two-dimensional,
y1andy2, although the conditions may also be single dimensional or have greater than two dimensions.
The operation of the various systems may follow any of the numbered paths or transients
as provided in Figure 1.1. For example, the system may deviate from (1) an anticipated
operational occurrence (AOO) as the result of a postulated initiating event (PIE) and
approach abnormal (2) and then unsafe (5) conditions. PIEs are those events are are
antic-ipated to cause a safety parameter to operate outside of the normal operating conditions.
Alternatively, a trip occurrence activates a safety function in order to prevent the system
oper-5 Uncertain Abnormal Unsafe Normal Accident/ Emergency Normal conditions 1 - Normal operation
2 - Postulated initiating event BPIE6 and Anticipated operational occurrence BAOO6 4 - Return to normal operation
Trip set-point BTSP6 Abnormal conditions
3 - Activation of safety function 5 - Insufficient safety actions
BDBA6 or BBDBA6 Safety limit
Unsafe conditions 6 - Accident Physical limit Accident/emergency condition 1 2 3 4 6 le ss sa fe m o re sa fe Safety margin
Figure 1.1: Operating conditions/modes, set-points/thresholds/limits, and conceptual events and system transients, trajectories, or paths of operation.
ating condition, and possibly the original operating point by means of start-up procedures
(4). It is therefore assumed, that a system operating beyond normal conditions will not
recover from the abnormal conditions without some form of safety action being performed.
The system may also exhibit unanticipated behaviours while operating under any on the
conditions as is indicated by the uncertain region of Figure 1.1.In Figure 1.1, the numbered
paths do not correspond with the uncertain condition. It is convenient to consider, however,
that a PIE causes the system behaviour to become uncertain as illustrated in Figure 1.1.
Moreover, paths (5) and (6) may correspond with either a design basis accident (DBA) or
a beyond design basis accident (BDBA) within the nuclear industry. These are postulated
accidents which have respectively been considered and are beyond consideration during
the design of the NPP according to established design criteria [10].
The first shutdown type of nuclear-related automatic protection system was that of
CP-1. This first protection system was responsible for releasing neutron absorbing rods
exceeded a predetermined trip set-point (TSP) which may also be referred to as a limiting
safety system setting (LSSS) [11]. Upon release, the shut-off rods were pulled into the
reactor pile by a 100lbs weight. The instrumentation for this and other early SDSs was
composed of simple amplifier circuits made up of triodes, diodes, and resistors, as well
as magnetic amplifiers and electro-mechanical relays. In addition, the TSPs for these
SDSs were calibrated to release safety actuators at predetermined values corresponding to
physical properties of the actuating devices, e.g. current to an electromagnet or position of
a solenoid catch mechanism [12]. More generally, the TSPs are the thresholds against which
safety parameters are compared within a protection system in order to detect abnormal
conditions. The TSP is therefore the boundary between normal and abnormal conditions
of Figure 1.1.
Since the days of CP-1, SDS instrumentation has undergone various functional and
technological enhancements. Although the main functionality of SDSs remains as it was in
CP-1, SDSs now include coincidence voting, hysteresis, and seal-in logic, as well as TSPs
that may vary as a function of major system parameters. These enhancements have resulted
in the rewriting of standards, regulations, and best practices, e.g. the extensive review of
software by formal methods [13]. Further, many safety concepts, including defence in depth,
diversity, redundancy, and other best-practices are now formally defined in a vast number of
safety reports and guides [14, 15]. Technologically, SDSs have evolved from a basic
electri-cal, electro-mechanielectri-cal, direct wired, analog signal form through an electronic, solid-state
form, to in some cases, an electronically programmable, fully computerized, digital form
within a safety-rated distributed control system (DCS) or programmable logic controller
software and central processing unit (CPU) of these fully computerized SDSs with an
elec-tronically programmable hardware implementation known as a field programmable gate
array (FPGA) [16, 17, 18].
Given proper safety and hazard analysis and selection of protective actions,
enhance-ments to protection systems are primarily concerned with: true and spurious trip; safety
variables, sensors, and TSPs; response time; environmental and power conditions; and
sys-tem reliability [19]. In fact, these design bases are the safety principles for automatic
protec-tion system development and, in some cases, are a means of measuring system performance,
i.e. response time, reliability, independence, availability, simplicity, and conformance to
environmental, power, and various other conditions [14, 20].
In general, protection system enhancements aim to improve either safety or productivity
and to maintain a balance between the two. For example, TSPs can be improved by
considering beyond design basis events [21]. In fact, it is common for nuclear utilities to
develop enhancements that reduce margins of uncertainty while maintaining or improving
margins of safety in order to utilize excess electrical generating capacity that was previously
unavailable [22]. For example, an increase in safety sensor accuracy may allow for an
increase in a TSP and subsequent increases in the nominal operating power of the reactor
as well as the electrical power generated by the NPP. The end result is a balanced increase
in safety and productivity, or alternatively, an increase in production while maintaining
safety margins. These two competing results are compared in Figure 1.2 for conventional
and conceptual predictive trip occurrences. The predictive trip of Figure 1.2 results in
an effective TSP that is a time-varying value or threshold equal to the safety parameter
le
ss
sa
fe
m
o
re
sa
fe
Safety limit
Trip set-point (TSP)
Safety margin Improved safety margin
Safety margin
Operating point Operating point
Improved productivity margin Effective TSP
Effective TSP
Operating point Conventional trip Predictive trip with
improved safety improved productivityPredictive trip with
Figure 1.2: Improvement of a) conventional trip in terms of b) safety and c) productivity margins as a conceptual result of predictive trip.
quality of the predictions as well as the length of the forecast window or prediction horizon.
The nuclear power generating industry is very conservative with respect to the
concep-tual modified operations of Figure 1.2 where rigorous analyses of any and all modifications
to protection systems are required to ensure identification and mitigation of any possible
negative impacts on safety [22]. For example, delaying the response time of the SDS may
result in a reduction in the number of spurious protective actions, otherwise known as
spurious or false trips. Reductions in spurious trips, in turn, increase the availability of the
NPP unit to generate electrical power. In this inadvisable example, the NPP has improved
production, or capacity factor, at the cost of reducing margins of safety since the delayed
SDS activation results the peak response of the safety parameter transients being closer to
the established safety limits; see (3) in Figure 1.1.
As previously stated, this dissertation aims to improve safety by detecting abnormal
conditions at a time that is earlier than is possible when using conventional SDSs. More
Sensors Conditioning Signals Amplifier Trip computer Display computer Relay logic Rod drop Relay delay Decision making Sampling and scan time
!
Fault propagation S h u t-o ff ro d s Fault or failureFigure 1.3: Sample trip sequence and time-to-trip measure for SDS1 of the CANDU NPP. Unless stated otherwise, time-to-trip is the total amount of time of these time components.
a trip inducing fault or failure and the insertion of sufficient negative reactivity into the
reactor core without causing a reduction in the margins of safety. This amount of time is
also referred to as time-to-trip, and includes the response time of the trip computer or logic
solver within the SDS. A sample trip sequence and time-to-trip measure are provided in
Figure 1.3 for the Canadian Deuterium Uranium (CANDU) shutdown system number one
(SDS1) design. The proposed SDS modifications, and more specifically the early detections,
are expected to provide the advantage of reducing the maximum values of the peak surges
in the parameters of the safety related subsystems as illustrated in Figure 1.2.
In terms of time-to-trip, conventional SDSs have the fundamental limit of, at best,
initi-ating the insertion of negative reactivity into the reactor core at the instant a safety
parame-ter reaches a TSP. Moreover, conventional SDSs are increasingly being implemented within
trip computers that are modern industrial computers, programmable electronic systems,
safety DCSs, PLCs, and even FPGAs. These modern platforms, however, are generally
underutilized in terms of computational power due to the relatively simple functionality
re-quired by protection systems when compared against advanced control system algorithms.
This research therefore overcomes the fundamental limit of conventional shutdown by
values and making anticipatory, or predictive trip decisions, i.e. a predictive shutdown
system (PSDS).
Prediction and forecasting dates back to over two millennia ago with the rudimentary
prediction of celestial body movements and a growing interest in the field of astronomy
[23]. The mathematical methods that form the foundation of optimal prediction were not
established, however, until 1632 when Galileo investigated the minimization of various
functions of error to help explain his experimental celestial observations [24]. Another
century and a half would pass before the first complete theory of linear estimation, known
as the method of least squares (LS), was formulated by Gauss in 1795. This achievement
in forecasting also centred around the study of celestial body movements, as reported and
independently formulated by Legendre in 1805 [24,25,26]. More recently, modern predictive
algorithms incorporate system models and also account for uncertainty in the model and
signals. For example, the stochastic state-space model assumed within the Kalman filter
(KF) published by Kalman in 1960 [27]. Nowadays, prediction algorithms have even been
used within NPP controls systems [28].
In utilizing a prediction algorithm for shutdown, it is expected that a PSDS will be able
to initiate shutdown actions at the instant a fault, failure, or initiating event is predicted
to result in an abnormal condition. At this limit, anticipatory or predictive shutdown is
conceptually similar to fault detection [29], a field which has numerous applications within
NPP systems [30, 31]. Moreover, given the well-established literature regarding prediction
of dynamical systems as well as the availability of capable industrial computer technologies,
it seems natural to investigate the development of a predictive automatic protection system.
quality decisions at a time which is earlier than the conventional case without reducing
margins of safety or productivity. It is further expected that these algorithms can be
implemented within modern safety-critical industrial computer platforms given limited
processing and memory resources.
In addition to reducing time-to-trip, the proposed SDS modifications deviate from the
historical practice of like-for-like functional transfer of SDS logic from existing to newly
commissioned technologies by developing, in an evolutionary manner, an advanced
safety-critical decision-making algorithm. Within the nuclear industry, plant life extensions and
related refurbishments have resulted in the replacement of antiquated and obsolescent
in-dustrial computers, programmable digital comparators, analog circuitry, and relay logic
with modern industrial computer technologies [8,32,33]. These platforms are capable of
ex-ecuting advanced functional, mathematical, and logical capabilities that enable a broader
set of decision-making algorithms to be implemented. Moreover, these algorithms include
well-established filtering and modelling methods that allow for control and protection
sys-tems to consider a larger set of prior knowledge regarding the system being controlled
or protected. For example, the automotive industry has recently developed and
imple-mented collision avoidance systems and automatic predictive braking within a variety of
automobiles [34].
Finally, this work considers the consequences of implementing advanced decision-making
algorithms within safety-critical industrial computers. For example, a given algorithm may
require additional execution time that may result in delayed decisions. The advanced
al-gorithms investigated herein are therefore designed to anticipate, or predict, impending
within the safety-critical shutdown task. Thus, in predicting the future behaviour of a
system being protected, the effects of uncertainty and the complexity of the prediction
algorithm on SDS performance, e.g. spurious trip rate, must also be well understood and
taken into consideration within the predictive trip detection mechanism.
1.2
Problem Statements, Objectives, and Scope
Two major problems are investigated within this dissertation. The main problem is the
enhancement of NPP SDSs to utilize the increased computational power as well as
func-tional capabilities of modern industrial computers in an effort to reduce the amount of time
required to activate a safety function. This primary problem is expected to be resolved by
incorporating a prediction algorithm within the SDS. In investigating this main problem, a
secondary problem is encountered. The secondary problem is the development of a
predic-tion algorithm that considers a larger set of prior informapredic-tion or knowledge to accurately
predict impending abnormal conditions even when the dynamic process is operating under
uncertain conditions. In addition, the functionality of the prediction algorithm is modified
to consider the quality of previously calculated multi-step-ahead predictions. These two
problems are expected to be resolved by incorporating prediction error compensation and
1.2.1
Shutdown system enhancement and reduction of
time-to-trip
The primary problem that is addressed within this dissertation is the enhancement of SDS
functionality in an effort to reduce time-to-trip. Within the nuclear power industry, SDS
enhancements are most often performed to address hardware obsolescence. These
enhance-ments may also, however, be performed to address insufficient electrical energy production
and safety margins. Of these enhancements, those that are due to obsolescence result
in the replacement of existing SDS components with new or more advanced technologies
while trip logic functionality remains largely unchanged. In contrast, those enhancements
that aim to improve energy production or safety generally focus on improving SDS
reliabil-ity, independence, availabilreliabil-ity, simplicreliabil-ity, or conformance to government regulations and
international standards rather than SDS response time.
The problem is not that these existing and upgraded SDS designs fail to meet regulatory
requirements for response times which are typically less than a few hundred of milliseconds
in length. The problem is instead that conventional SDSs at best initiate shutdown
ac-tions at the instant a safety parameter is determined to have reached a TSP. Thus, SDSs
currently utilize comparator-based trip functionality even though modern technologies are
capable of executing increasingly advanced model- and data-based prediction, detection,
and decision-making algorithms, many of which are straightforward, well-established and
have been proven through use. There is therefore an opportunity to detect in advance,
with predetermined confidence and without reducing safety or productivity margins, that
production, and economic benefits that may be realized by reducing time-to-trip. These
benefits are due to the nominal operating thermal power as well as the electrical power
output of a given NPP unit being functions of SDS response time. More precisely, it may
be possible to increase the operating power and electrical power output of the NPP as a
result of reducing time-to-trip.
A reduction in time-to-trip reduces the magnitude of fault-induced high power surge,
and in turn, the temperature within the reactor core and the potential for critical
com-ponents to be damaged [35]. Achieving near-immediate time-to-trip is essential during
operating conditions when fission reactions within the reactor core may be beyond the
control of the reactor regulating system (RRS) and the heat energy accumulating within
the reactor core may increase exponentially leading to unsafe operation, or even accident
conditions. For these reasons, a reduction in time-to-trip results in increased margins of
safety [36]. In addition, for existing NPPs where increased margins of safety can be
guaran-teed, it may be possible to take advantage of additional electrical power generating capacity
by undertaking power up-rating initiatives [22]. That said, the current state-of-the-art in
terms of SDS functionality is to use an FPGA to compare trip parameter measurements
against a TSP that is most often a constant value, and is at most a function of some major
safety-related system parameter.
By continuing along the path of like-for-like functional replacement of SDS
decision-making algorithms, it is expected that the ability of automatic protection systems to meet
the safety demands of increasingly complex and challenging engineering problems will be
hindered both within and beyond the nuclear power generating industry. In addition, it is
decisions have on safety and operability given that these strategies are now being
imple-mented within the monitoring and supporting controllers of potentially hazardous systems.
By considering the effects of predictive functions from the perspective of a safety-critical
system, it is expected that there will be a reduced likelihood of safety being compromised
in order to attain an increase in production value whether within the nuclear power
indus-try or otherwise. In addition, a paradigm shift to a continuing evolutionary enhancement
of automatic protection system algorithms will bring about improvements to safety and
production margins, the efficiency of existing NPP units, and the economic performance
of nuclear power generation in general. More specifically, a reduction in time-to-trip leads
to increased productivity as a direct result of increased margins of safety as illustrated in
Figure 1.2. In one report, it is stated that each additional percentage of increased
operat-ing trip margin increases revenue by a present value of 20 to 40 million dollars per reactor
unit [37].
In response to the SDS enhancement and reduction of time-to-trip problem, Chapter 3
investigates various theoretical methods for advanced and intelligent but well-established
prediction algorithms. These prediction algorithms are utilized to calculate predictions of
the safety parameter measurements that are available within conventional SDSs. Chapter
5 constructs various modular PSDS designs that each aim to reduce time-to-trip. The
predictions are then compared against a corresponding TSP to determine whether a trip
condition is imminent. This TSP is also referred to as an alarm threshold, and the trip
occurrence as a threshold-crossing event. Chapter 5 also aims to re-frame SDS enhancement
and safety-critical decision-making in general, by making accurate predictive decisions
controllers. These considerations are essential for implementation of the PSDS designs
within the Tricon v9 safety-PLC of the experimental platform presented in Chapter 6. By
performing these enhancements in an evolutionary manner, it is expected that the proposed
PSDS designs will maintain the reliability of the existing conventional SDSs.
1.2.2
Predictive shutdown concept
A conceptual predictive shutdown occurrence is illustrated in Figure 1.4. This figure
il-lustrates for a single safety parameter the measurement, corresponding TSP, as well as
past, present, and future safety parameter predictions. In Figure 1.4, discrete time index
kdenotes the current, or present, time-step with units equal to seconds over the sampling intervalTs, or s/Ts. Time-steps that have values less thank have occurred in the past and
time-steps that have values greater than k are yet to occur in the future. At each time-step, the prediction algorithm propagates the safety parameter predictions to a prediction
horizonNp time-steps into the future. The predictions are then compared against a
corre-sponding TSP. A predictive trip is initiated if any of the predictions within the prediction
window have reached the TSP. Thus, in the example sequence of Figure 1.4, a predictive
trip occurs at time-stepkdue to the predicted safety parameter measurements, propagated to prediction horizon (k+Np), having reached the TSP. Predictive trip therefore results
in a reduction in time-to-trip when compared against a conventional shutdown that occurs
at some future time-step. For example, a reduction in time-to-trip ofNp time-steps would
result for a hypothetical conventional shutdown occurring at time-step (k+Np).