70 | P a g e
DETERMINATION OF MOMENT RESISTING RC
FRAMES OF RESPONSE REDUCTION FACTORS
Podudolu Rani
1, D Rambabu
2.
1* M.Tech Student, Nova College of Engineering & Technology, Jangareddygudem, India.
2* Assistant Professor,
Nova College of Engineering & Technology, Jangareddygudem
, India.ABSTRACT
Moment resisting frames are commonly used as the dominant mode of lateral resisting system in
seismic regions for a long time. The poor performance of Ordinary Moment Resisting Frame (OMRF) in
past earthquakes suggested special design and detailing to warrant a ductile behaviour in seismic zones of
high earthquake (zone III, IV & V). Thus when a large earthquake occurs, Special Moment Resisting Frame
(SMRF) which is specially detailed with a response reduction factor, R = 5 is expected to have superior
ductility. The response reduction factor of 5 in SMRF reduces the design base shear and in such a case
these building rely greatly on their ductile performance. To ensure ductile performance, this type of frames
shall be detailed in a special manner recommended by IS 13920. The objective of the present study is to
evaluate the R factors of these frames from their nonlinear base shear versus roof displacement curves
(pushover curves) and to check its adequacy compared to code recommended R value.
The accurate estimation of strength and displacement capacity of nonlinear pushover curves
requires the confinement modelling of concrete as per an accepted confinement model. A review of various
concrete confinement models is carried out to select appropriate concrete confinement model. It is found
that modified Kent and Park model is an appropriate model and it is incorporated in the modelling of
nonlinearity in concrete sections. The frames with number of storeys 2, 4, 8, and 12 (with four bays) are
designed and detailed as SMRF and OMRF as per IS 1893 (2002). The pushover curves of each SMRF and
OMRF frames are generated and converted to a bilinear format to calculate the behaviour factors. The
response reduction factors obtained show in general that both the OMRF and SMRF frames, failed to
achieve the respective target values of response reduction factors recommended by IS 1893 (2002)
marginally. The components of response reduction factors such as over-strength and ductility factors also
evaluated for all the SMRF and OMRF frames. It was also found that shorter frames exhibit higher R
factors and as the height of the frames increases the R factors decreases.
Keywords: OMRF, SMRF, Response Reduction Factor, Pushover, Ductility, Confinementmodels
I.INTRODUCTION
Column shear failure has been identified as the frequently mentioned cause of concrete structure failure and
downfall during the past earthquakes. In the earthquake resistant design of reinforced concrete sections of
buildings, the plastic hinge regions should be strictly detailed for ductility in order to make sure that severe
71 | P a g e
consideration for ductility in plastic hinge regions of reinforced concrete columns is the provision of
adequate transverse reinforcement in the form of spirals or circular hoops or of rectangular arrangements of
steel. The cover concrete will be unconfined and will eventually become ineffective after the compressive
strength is attained, but the core concrete will continue to carry stress at high strains. Transverse
reinforcements which are mainly provided for resisting shear force, helps in confining the core concrete and
prevents buckling of the longitudinal bars. The core concrete which remains confined by the transverse
reinforcement is not permitted to dilate in the transverse direction, thereby helps in the enhancement of its
peak strength and ultimate strain capacities. Thus confinement of concrete by suitable arrangements of
transverse reinforcement results in a significant increase in both the strength and the ductility of compressed
concrete.
II.SPECIAL AND ORDNARY MOMENT RESISTING FRAMES (SMRF AND OMRF)
According to Indian standards moment resisting frames are classified as Ordinary Moment
Resisting Frames (OMRF) and Special Moment Resisting Frames (SMRF) with response reduction factors
3 and 5 respectively. Another main difference is the provision of ductile detailing according to IS 13920 as
explained in Section 1.1 for the SMRF structures. The differences between these two are given in Table 1.1.
Different international codes classify buildings in different ways which are elaborated in Section 2.2.
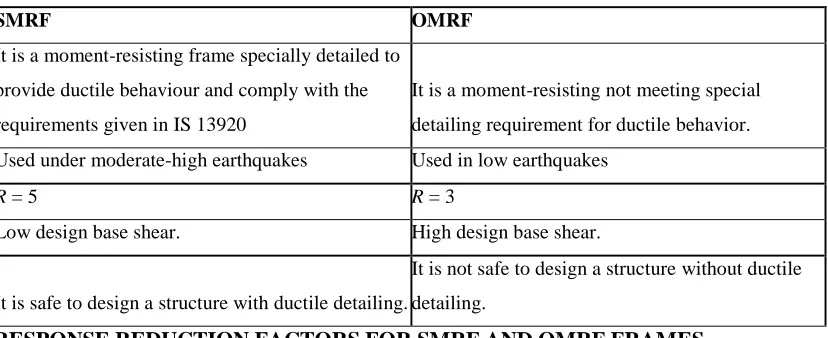
Table 1.1 Differences between SMRF and OMRF
SMRF OMRF
It is a moment-resisting frame specially detailed to
provide ductile behaviour and comply with the
requirements given in IS 13920
It is a moment-resisting not meeting special
detailing requirement for ductile behavior.
Used under moderate-high earthquakes Used in low earthquakes
R = 5 R = 3
Low design base shear. High design base shear.
It is safe to design a structure with ductile detailing.
It is not safe to design a structure without ductile
detailing.
RESPONSE REDUCTION FACTORS FOR SMRF AND OMRF FRAMES
III.RESPONSE REDUCTION FACTOR
Chugh (2004) conducted ductility studies on RC beams using several confinement models.The
response of a statically determinate structure to stress will be linear until yielding takes place. But as soon
as the yielding occurs at any section, the behaviour of the structure becomes inelastic and linear elastic
structural analysis can no longer be applied. As per the above study, it is mentioned that during an
earthquake, yielding of the reinforcement can be expected at many sections. It would be too costly to design
a structure based on the elastic spectrum. To reduce the seismic loads, IS 1893 introduces a “response
reduction factor” R. But this reduction can be made, only if adequate ductility is developed through proper
design and ductile detailing of the elements. So in-order to obtain the exact response, it is recommended to
72 | P a g e
MODELLING OF RC MEMBERS FOR NONLINEAR STATIC ANALYSIS
OpenSees (Open System for Earthquake Engineering Simulation) platform is used for modelling
of the structure.OpenSees is an object oriented open-source software framework used to model structural
and geotechnical systems and simulate their earthquake response. It is primarily written in C++ and uses
some FORTRAN and C numerical libraries for linear equation solving, and material and element customs.
The progressive capabilities for modelling and analysing the nonlinear response of systems using a wide
range of material models, elements, and solution algorithms makes this open source platform more popular.
PUSHOVER ANALYSIS
Pushover analysis is a static, nonlinear procedure to analyse the
seismic performance of a building where the computer model
of the structure is laterally pushed until a specified
displacement is attained or a collapse mechanism has occurred
as shown in Fig: 4.1.The loading is increased in increments
with a specific predefined pattern such as uniform or inverted
triangular pattern. The gravity load is kept as a constant during
the analysis. The structure is pushed until sufficient hinges are
formed such that a curve of base shear versus corresponding roof displacement can be developed and this
curve known as pushover curve. A typical Pushover curve is shown in Fig 4.1. The maximum base shear
the structure can resist and its corresponding lateral drift can be found out from the Pushover curve.
Roof displacement
Roof displacement
Fig: 4.1: Lateral Load Distribution and a Typical Pushover Curve
Bilinear Approximation of Pushover Curve
Most pushover methods adopt a bilinear approximation of the actual push-over curve to obtain an idealized
linear response curve, as shown in Fig: 4.2. This is done in such a way that the area under the actual curve
will be equal to the area under the bilinear approximate curve.
B
a
se
sh
ea
73 | P a g e
Fig: 4.2: Bilinear Approximation of Pushover Curve
Behaviour factors (Performance parameters)
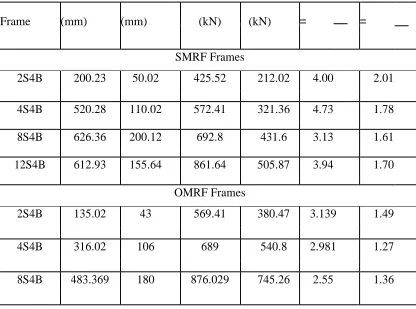
Table 4.2: Parameters of the pushover curves for SMRF and OMRF Frames
Frame
(mm)
(mm)
(kN)
(kN)
=
=
SMRF Frames
2S4B
200.23
50.02
425.52
212.02
4.00
2.01
4S4B
520.28
110.02
572.41
321.36
4.73
1.78
8S4B
626.36
200.12
692.8
431.6
3.13
1.61
12S4B
612.93
155.64
861.64
505.87
3.94
1.70
OMRF Frames
2S4B
135.02
43
569.41
380.47
3.139
1.49
4S4B
316.02
106
689
540.8
2.981
1.27
74 | P a g e
12S4B
505
190
952.5
853.03
2.65
1.116
Table 4.3: Response reduction factors and the components (Behaviour factors)
Frame
R
SMRF frames
2S4B
2.007
2.42
1
4.856
4S4B
1.781
2.71
1
4.827
8S4B
1.605
2.63
1
4.229
12S4B
1.703
2.52
1
4.305
OMRF frames
2S4B
1.49
2.007
1
2.99
4S4B
1.27
2.062
1
2.63
8S4B
1.176
1.893
1
2.226
12S4B
1.116
1.974
1
2.202
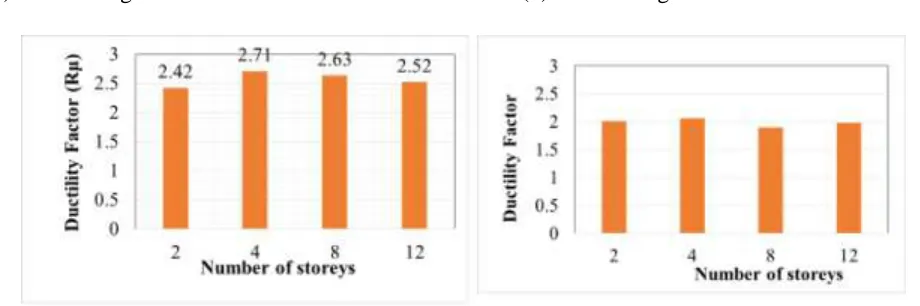
Performance parameters versus number of storeys (SMRF and OMRF frames)
75 | P a g e
(c) Ductility factor -SMRF
(c) Ductility factor -OMRF
(e) Response reduction factor -SMRF
(f) Response reduction factor -OMRF
Fig: 4.8: Variation of Performance parameters for SMRF and OMRF frames with number of stories
IV.CONCLUSIONS
REVIEW OF EXISTING CONFINEMENT MODELS FOR CONCRETE
Objectives of the thesis are to review the existing confinement models for concrete and to apply an
appropriate confinement model to SMRF and OMRF buildings designed as per IS 1893 (2002). A literature
is conducted that discusses the various topics such as the confinement models, response reduction factors or
behaviour factors and various confinement models for the stress-strain relationship of concrete and
pushover analysis.
The confinement in the concrete plays a major role in the strength and ductility of the RC members. In
order to show the effect of considering the confinement in the stress-strain curve and its effects in the
strength and ductility, various SMRF and OMRF frames (2, 4, 8 and 12 storeys with 4 bays) are designed
and detailed as per IS code.
The various existing stress-strain models are studied in-order to evaluate their relative differences in
76 | P a g e
stress-strain model suggested by IS 456 does not consider the strength enhancement due to confinement
while in reality concrete exhibits different performance in the confined and unconfined conditions.
A parametric study is conducted to understand how the various parameters such as spacing transverse
reinforcement, grade of transverse reinforcement and grade of concrete influence the stress-strain curve.
It was found that Razvi model and Modified Kent and Park model it was observed that the latter
shows higher percentage increase in column capacity and deformation. Percentage Strength enhancement
due to confinement in Modified Kent and Park model for various column sections is in the range of 32% –
58%.
The parametric study on Modified Kent and Park model showed that the ultimate strain is more
dependent on the spacing of transverse reinforcement than the grade of transverse steel and concrete. Hence
to ensure the ductile detailing, the spacing of stirrups shall be treated as an important factor. The increase in
strength enhancement factor (that define the measure of confinement) by 1.2 times increases the ultimate
strain by 46.89%.
PUSHOVER CURVES FOR SMRF AND OMRF FRAMES
The second objective is to estimate the response reduction factors for the specially and ordinary moment
resisting frames. The designed RC frames are modelled for nonlinearity using the Modified Kent and Park
confinement model. Nonlinear Static Pushover Analysis is carried out for all the frames to generate the
pushover curves.
The pushover analysis of the 12 storeyed SMRF frame modelling the concrete in the confined core
using the two concrete stress-strain models namely, modified Kent and Park model shows that the
unconfined stress-strain model (IS code) underestimates the displacement capacity of 12 storey SMRF
frames by 83%.
The pushover curves of SMRF buildings are compared with that of their corresponding OMRF
buildings. It is observed that the drift capacity of SMRF buildings is higher than OMRF buildings in all
the cases.
The percentage increase of displacement capacity of SMRF over the corresponding OMRF is in the
range of 29-65%. This validates the fact that SMRF buildings which are specially designed and
detailed as per IS 13920 guidelines exhibits more ductility compared to the less stringently designed
OMRF buildings.
While considering the base shear capacity, OMRF buildings exhibit higher values than SMRF
buildings of about 10-34%.The provision of R factor „3‟ increases the design base shear in OMRF
buildings. Due to the higher design base shear, the RC sections in the OMRF building will be heavier.
This is the reason for the higher base shear capacity.
The behaviour factors of the frames are evaluated from the pushover curve and a story-wise comparison
77 | P a g e
decreasing trend as the number of stories increases. The shorter frames show higher over-strength value
compared to taller frames.
It was found that the ductility factors do not show any specific trend with variation in the number of
stories for both SMRF and OMRF frames.
RESPONSE REDUCTION FACTORS FOR SMRF AND OMRF FRAMES
A study of the variation of Response Reduction Factor with number of stories is conducted. In SMRF
buildings it is observed that as the number of storeys increases the R factor tends to decrease. The shorter
frames exhibits higher R values compared totaller frame. 2- storey SMRF building shows the highest R
factor of 4.856 which is almost close to the IS(1893) code suggested value of „5‟.
The R factor for SMRF buildings varies in the range of 4.23 to 4.86. OMRF buildings also exhibit
decrease in R factor with increase in number of storeys. The value varies in the range 2.2 to 2.99 which
is less than the suggested R value of „3‟ as per IS 1893 guidelines.
In general, the present study shows that both the OMRF and SMRF frames, failed to achieve the
respective target values of response reduction factors recommended by IS 1893 (2002).
The study of effect of number of storeys in the base shear strength and displacement capacity of the
SMRF and OMRF frames show that for addition of every 4 storeys in the SMRF frames, it showed
about 20-25% increase in base shear capacity while about 13-15% increase in displacement capacity.
REFERENCE
1. Alam, Md. I. and Dookie Kim (2012) Effect of Constitutive Material Models on Seismic Response of
Two-Story Reinforced Concrete Frame. International Journal of Concrete Structures and Materials,
Vol.6, No.2, pp.101–110.
2. ASCE 7 (2005)Minimum Design Loads for Buildings and Other Structures. American Society of Civil
Engineers. USA.
3. Asgarian, B. and Shokrgozar, H.R. (2009) BRBF response modification factor,
Journal of Constructional Steel Research 65, 290_298.
4. ATC 40 (1996) Seismic Evaluation and Retrofit of Concrete Buildings: Vol. 1.Applied Technology
Council. USA.
5. Bansal, R. (2011) Pushover analysis of reinforced concrete frame. M.Tech project report. Department
of Civil engineering, Thapar University.
6. Borzi, B. and Elnashai, A. S. (2000) Refined force reduction factors for seismic design. Engineering
Structures 22(10): 1244–60.
7. Chandler, A.M. and Mendis, P.A. (2000) Performance of reinforced concrete frames using force and
displacement based seismic assessment methods.
Engineering Structures 22 352–363
8. Chugh, R.(2004) Studies on RC Beams, Columns and Joints for Earthquake Resistant Design. M. Tech.
78 | P a g e
9. Durga, M.P. and Seshu, R.D. (2013) Effect of Confinement on Load – Moment Interaction Behavior of
Reinforced Concrete Column,International Journal of Emerging Technology and Advanced
Engineering (ISSN 2250-2459)
10. EC 8 (2004) Design of Structures for Earthquake Resistance, Part-1: General Rules, Seismic Actions
and Rules for Buildings. European Committee for Standardization (CEN), Brussels. 2004.
11. FEMA (2000) Pre-standard and commentary for the seismic rehabilitation of buildings (FEMA-356).
Washington (USA): Federal Emergency Management Agency.
12. Gioncu, V. (2000) Framed structures ductility and seismic response General Report. Journal of
Constructional Steel Research, 55 125–154 2.
13. Han, S.W. and Jee, N.Y. (2005) Seismic behaviors of columns in ordinary and intermediate moment
resisting concrete frames. Engineering Structures 27, 951– 962.
14. Hoshikuma, J., Kazuhiko, K., Kazuhiro, N. and Taylor, A.W. (1996) A model of confinement effect on
stress-strain relation of reinforced concrete columns for seismic design, Eleventh world conference on
earthquake engineering.
15. IS 13920 (1993) Indian Standard Code of Practice for Ductile Detailing of Reinforced Concrete
Structures Subjected to Seismic Forces. Bureau of Indian Standards, New Delhi.
16. IS 1893 Part 1 (2002) Indian Standard Criteria for Earthquake Resistant Design of Structures. Bureau
of Indian Standards. New Delhi. 2002.
17. IS 456 (2000) Indian Standard for Plain and Reinforced Concrete - Code of Practice, Bureau of Indian
Standards, New Delhi. 2000.
18. Jain, S. K. and Uma, S.R. (2006) Seismic design of beam-column joints in RC moment resisting
frames. Structural Engineering and Mechanics 23, 5 579-597.
19. Jianguo, NIE. V. QIN. Kai, and XIAO Yan. (2006)Push-Over Analysis of the Seismic Behavior of a
Concrete-Filled Rectangular Tubular Frame Structure. Tsinghua science and technology, ISSN
1007-0214 20/21 pp124-130, Volume 11,Number 1.
20. Khose, V.N, Singh, Y. and Lang, D.H. (2012) A Comparative Study of Selected Seismic Design Codes
for RC frames Buildings. Earthquake Spectra 28, 3.
21. Krawinkler, H. and Nassar, A. (1992) Seismic design based on ductility and cumulative damage
demands and capacities. In: Nonlinear seismic analysis of reinforced concrete buildings, New York,