Novel Method for Detection of Genes With Altered
Expression Caused by Coronavirus Infection and
Screening of Candidate Drugs for SARS-CoV-2
Y-H. Taguchi and Turki Turki
Abstract—To better understand the genes with altered ex-pression caused by infection with the novel coronavirus strain SARS-CoV-2 causing COVID-19 infectious disease, a tensor decomposition (TD)-based unsupervised feature extraction (FE) approach was applied to a gene expression profile dataset of the mouse liver and spleen with experimental infection of mouse hepatitis virus, which is regarded as a suitable model of human coronavirus infection. TD-based unsupervised FE selected 134 altered genes, which were enriched in protein-protein interactions with orf1ab, polyprotein, and 3C-like protease that are well known to play critical roles in coronavirus infection, suggesting that these 134 genes can represent the coronavirus infectious process. We then selected compounds targeting the expression of the 134 selected genes based on a public domain database. The identified drug compounds were mainly related to known antiviral drugs, several of which were also included in those previously screened with anin silicomethod to identify candidate drugs for treating COVID-19.
Index Terms—COVID-19, SARS-CoV-2, in silico drug dis-covery, gene expression profile, tensor decomposition, feature extraction
I. INTRODUCTION
T
HE current pandemic of COVID-19 caused by infection of the new coronavirus strain SARS-CoV-2 is a severe public health problem that must be resolved as soon as possible. To achieve this goal, it is essential to understand the mechanism by which SARS-CoV-2 successfully invades human cells. Recently, Pfaender et al. [1] demonstrated that host lymphocyte antigen 6 (LY6E) complex impairs coron-avirus fusion and confers immune control of viral disease. The authors also used a transcriptome approach to evaluate the effect of infection of mouse hepatitis virus (MHV), a natural mouse pathogen that causes hepatitis and encephalomyelitis, which is a well-studied model of coronavirus infection. Al-though they found many pathways that were disturbed after MHV infection, they did not perform a detailed analysis of the genes with altered expression in response to MHV infection.In this study, we applied tensor decomposition (TD)-based unsupervised feature extraction (FE) [2] to identify genes with altered expression by MHV infection as a model of coronavirus. We further performed functional enrichment on the selected genes to determine their potential associations
Y-H. Taguchi is with the Department of Physics, Chuo University, Tokyo 112-8551, Japan, e-mail:[email protected] (see https://researchmap.jp/Yh Taguchi/).
Turki Turki is with the Department of Computer Science, King Abdulaziz University, Jeddah 21589, Saudi Arabia
with coronavirus infection processes, and screened candidate drug compounds targeting these genes. Overall, this work expands TD formalism by exploring the interpretation of six-dimensional tensors in an infectious disease context. Moreover, we demonstrate a novel application of TD to facilitate the drug discovery process, which can offer a valuable resource for researchers to obtain mechanistic insight for identifying effective drugs for infectious diseases such as COVID-19.
II. MATERIALS ANDMETHODS
A. Gene expression profile dataset
The gene expression profile was downloaded from the Gene Expression Omnibus (GEO) dataset GSE146074. This dataset comprises the gene expression profiles of the liver and spleen from female mice experimentally infected with MHV or injected with phosphate-buffered saline (PBS) as a control group for comparison. This experiment was performed with mice of two genetic backgrounds, including wild-type (WT) mice and an textit Ly6e-knockout (KO) mutant strain. The number of replicates for each group are listed in Table I. Seventy two files whose names start by “GSM” (processed file) were used for analyses.
TABLE I
NUMBER OF BIOLOGICAL REPLICATES. TWO TECHNICAL REPLICATES ARE AVAILABLE FOR EACH BIOLOGICAL REPLICATE.
PBS day 5 MHV day 3 MHV day 5 liver spleen liver spleen liver spleen
WT 3 3 3 3 3 3
KO 3 3 3 3 3 3
B. Additional gene expression profile data set
In order to validate the suitability of MHV as model SARS-CoV-2 infectious process, two additional gene expression profiles of mice lung SARS-CoV infectious processes (Table II. For GSE33266 and GSE50000, we download two files GSE33266 series matrix.txt.gz and GSE50000 series matrix.txt.gz, respectively. Although GSE50000 also includes files for SARS-CoV-MA15, they were omitted (the reason why we did not use files for MA15 can be available at Discussion section). For the cases that have less than five biological replicates, we used more than once some of replicates in order to have five biological replicates for invidual cases.
TABLE II
NUMBER OF BIOLOGICAL REPLICATES OFSARS-COVINFECTION TOWARD MOUSE LUNG GENE EXPRESSION PROFILES
GSE33266
days D1 D2 D4 D7
Mock 3 3 3 3
102pfu 5 5 5 5
103pfu 5 5 5 5
104pfu 5 5 5 5
105pfu 5 5 5 5
GSE50000
days d1 d2 d4 d7
BatSRBD 5 5 5 4
icSARS 4 5 5 5
Mock 4 4 4 4
C. TD-based unsupervised FE
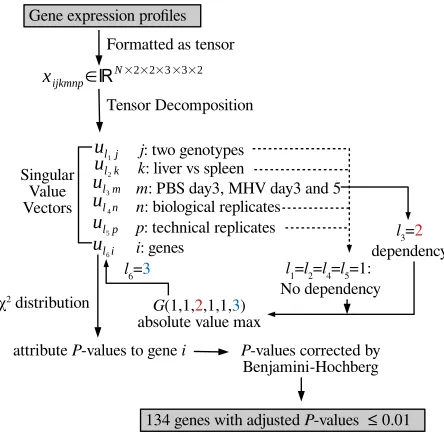
Figure 1 shows the flowchart of TD based unsupervised FE.
Gene expression profiles
xijkmnp∈ℝN×2×2×3×3×2
Formatted as tensor
Tensor Decomposition
ul1j ul 2k ul 3m ul 4n ul 5p Singular Value Vectors ul 6i
j: two genotypes
k: liver vs spleen
m: PBS day3, MHV day3 and 5
n: biological replicates
p: technical replicates
i: genes
l1=l2=l4=l5=1: No dependency
l3=2 dependency
G(1,1,2,1,1,3) absolute value max
l6=3
χ2 distribution
attribute P-values to gene i P-values corrected by Benjamini-Hochberg
134 genes with adjusted P-values ≤ 0.01
Fig. 1. Flow chart of TD based unsupervised FE
The gene expression profile dataset was formatted as a tensor, xijkmnp ∈ RN×2×2×3×3×2, which represents the expression level of theith gene of thejth genotype (j= 1:KO,
j = 2:WT) of thekth tissue (k = 1:liver, k = 2:spleen) of the mth treatment group (m = 1:PBS day 5, m = 2:MHV day 3, m = 3:MHV day 5) for the nth biological replicate (1≤n≤3) andpth technical replicate (1≤p≤2).
The TD is therefore expressed as
xijkmnp =
X
`1`2`3`4`5`6
G(`1`2`3`4`5`6)
× u`1ju`2ku`3mu`4nu`5pu`6i (1)
where G(`1`2`3`4`5`6) ∈ RN×2×2×3×3×2 is a core tensor, andu`1j ∈R
2×2,u
`2k ∈R 2×2,u
`3m∈R 3×3,u
`4n ∈R 3×3,
u`5p ∈R
2×2, and u
`6i ∈R
N×N are singular values vectors,
which can be obtained via the higher-order singular value decomposition (HOSVD) algorithm [2].
To select u`6i, attributed to selected genes, we need to
select u`1j attributed to the genotype, u`2k attributed to the
tissue, u`3m attributed to the treatment, u`4n attributed to
the biological replicate, and u`5p attributed to the technical
replicate, associated with desired properties.
For this study, we sought to identify genes whose expression is independent of the mouse genotype, tissue type, and repli-cate. Thus,u`1j,u`2k,u`4n, andu`5p should be independent
of j,k,n, andp.
By contrast, we require u`3m to be dependent on u`31 <
u`32 < u`33 or vice versa. This is because m = 2 (3 days
after MHV infection) must be between m= 1 (5 days after PBS injection as the control) andm= 3(5 days after MHV infection).
After selecting`1, `2, `3,`4, and`5based on the above con-siderations, we selected `6 associated with G(`1`2`3`4`5`6) as the largest absolute value, with fixed `1, `2, `3, `4, and
`5 values. Using the selected u`6i, The P-values, Pis, were
attributed to gene expression levels as
Pi=Pχ2
"
>
u
`6i
σ`6
2#
(2)
wherePχ2[> x] is the cumulative probability distribution of
theχ2distribution when the argument is larger thanxandσ`6
is the standard deviation of u`6i.
Pis were adjusted by the Benjamini and Hochberg (BH)
criterion [2], and only genes associated with an adjusted Pi
less than 0.01 were selected for further analysis.
We employed the almost same procedures excluding dif-ferent structure of tensors analyses toward two additional gene expression profiles of mice lung SARS-CoV infectious processes. The tensors formatted and TDs are for GSE33266
xijkn ∈ RN×5×4×5 (3)
= 5 X `1 4 X
`2=1 5
X
`3=1
N
X
`4=1
G(`1`2`3`4)
× u`1ju`2ku`3nu`4i (4)
which representsith gene expression profile ofjth expetiments (j = 1:Mock, j = 2:102pfu, j = 3:103pfu, j = 4:104pfu,
j = 5:105pfu) atkth daye after infection (k= 1:D1, day 1,
k= 2:D2, day 2,k= 3:D4, day 4,k= 4:D7, day 7) of nth biological replicates (1≤n≤5).G(`1`2`3`4)∈RN×5×4×5 is a core tensor that represents the weight of products of singu-lar value matrices, u`1j ∈R
5×5,u
`2k ∈R 4×4,u
`3n∈R 5×5,
and u`4i ∈R
N×N which are all orthogonal matrices. Those
for GSE50000 are
xijkn ∈ RN×3×4×5 (5)
= 5 X `1 4 X
`2=1 5
X
`3=1
N
X
`4=1
G(`1`2`3`4)
× u`1ju`2ku`3nu`4i (6)
which representsith gene expression profile ofjth expetiments (j = 1:BatSRBD, j = 2:icSARS, j = 3:Mock) at kth daye after infection (k = 1:d1, day 1, k = 2:d2, day 2,
u`1j ∈R 3×3,u
`2k ∈R 4×4,u
`3n ∈R
5×5, andu
`4i∈R
N×N
which are all orthogonal matrices.
The criteria for the selections of singular value vectors are as follows. For GSE33266,u`1j should be monotonic function of
j, since it represents the strength of infection,u`2kalso should
be monotonic function ofk, since it is time development, and
u`3n should be constant since biological replicates should not
differ from one another. For GSE50000,u`1jshould be distinct
betweenk= 3andk= 1,2, since it represents the distinction between Mock and infection, u`2k also should be monotonic
function of k, since it is time development, and u`3n should
be constant since biological replicates should not differ from one another.
Downstream procedures for gene selection after identifying singular value vectors are the same as those for MHV. Core tensors, G(`1`2`3`4)s, are investigated in order to see which
`4 associated with G(`1`2`3`4)having larger absolute values given `1, `2, `3. u`4is selected are used for attributing P
-values, Pi, to genes and genes associated with adjusted P
-values less than 0.01 were selected.
D. Enrichment analysis
Gene symbols of genes selected by TD-based unsupervised FE with significantly altered expression due to MHV infection were uploaded to Enricher [3] and Metascape [4], which are popular enrichment analysis servers that evaluate the biological properties of genes based on enrichment analysis.
III. RESULTS
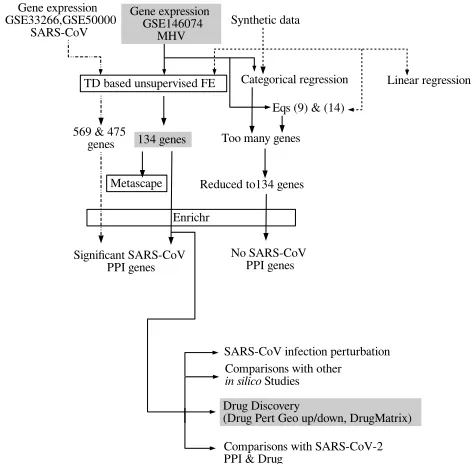
Figure 2 shows the overview of analyses performed in this study.
Gene expression GSE146074
MHV Gene expression
GSE33266,GSE50000
SARS-CoV Synthetic data
TD based unsupervised FE Categorical regression Linear regression
Eqs (9) & (14)
134 genes Too many genes
Reduced to134 genes
Enrichr
No SARS-CoV PPI genes Significant SARS-CoV
PPI genes 569 & 475
genes
Drug Discovery
(Drug Pert Geo up/down, DrugMatrix)
Comparisons with SARS-CoV-2 PPI & Drug
Comparisons with other
in silico Studies Metascape
SARS-CoV infection perturbation
Fig. 2. Overview of analyses
A. Synthetic data sets
In order to demonstrate how effective tensor is, we employ synthetic data sets composed of multiway and multiclass labels,xijks∈RN×M×K×S. Here,i representsN variables, among which partial collections having distinct values between
js as well as ks must be selected where S replicates are available for individual combinations of j and k. A typical example is that xijks represents expression of ith genes in kth tissue of patients who belong to jth group that consists of S patients. Then the purpose is to identify which genes are expressed distinctly in the tissue (k) -specific as well as patients group (j) specific ways.
The most popular approach to address this problem is linear regression,
xijks=αiaj+βibk+γi (7)
where aj and bk are the pre-defined variables that represent
some properties of jth patients group and kth tissue, respec-tively. αi, βi, γi are regression coefficients that are supposed
to be selected such that the discrepancy between both sides of equation is minimized. Thenis associated with significant
P-values are selected as those whose expression are distinct between distinctjs andks, respectively.
Of course, it is not guaranteed that liner regression correctly figure out the dependency of xijks upon j and k. Here we
generate synthetic data that follows
xijks=ξijkajbk+εijks (8)
where ξijk are drawn from N(1,0) for every combination
of i, j, k (this means that xijkss associated with distinct ss
share the same ξijk) and εijks are drawn from N(1,0) for
every combination ofi, j, k, s.N(µ, σ)represents the normal distribution that has mean of µ and standard deviation of σ. Fori≥N0,αijk is taken to be zero; this means thatxijksfor i ≥N0 is simply random variables. The task is to correctly selectN0variables associated with the dependence uponjand
k.
As an alternative regression analysis of liner regression, we employ
xijk =α0iajbk+γi0 (9)
which reflects the multiplicative nature whenxijkis generated
with eq. (8) although it cannot representxijkcompletely since αijk is replaced withαi (i.e., dependence uponj or kis not
assumed).
In addition to the above two regression analysis, we also applied categorical regression that is known to be equivalent to analysis of variance (ANOVA)
xijks= M
X
j0=1
K
X
k0=1
αij0k0δjj0δkk0+γi00 (10)
whereδjj0 andδkk0 are Kronecker’s delta andαijkandγ00i are regression coefficients, respectively. One should notice that eq. (10) can fully reproducexijkgenerated by eq. (8), whenαij0k0 is taken to beξij0k0aj0bk0 excluding randomness introduced by
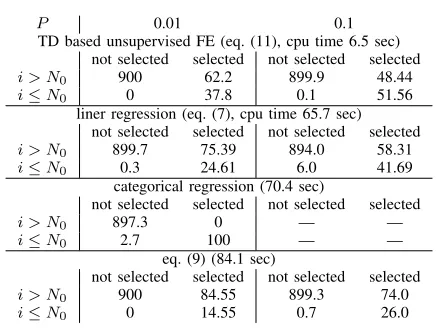
TABLE III
THE CONFUSION MATRICES OBTAINED USING SYNTHETIC DATA(EQ.(8), N= 1000, N0= 100, M=K= 3, S= 5)AND CPU TIME REQUIRED FOR EACH METHOD.PS ARE THRESHOLDP-VALUES;iASSOCIATED WITH
ADJUSTEDP-VALES LESS THAN THIS THRESHOLD VALUES ARE SELECTED.
P 0.01 0.1
TD based unsupervised FE (eq. (11), cpu time 6.5 sec) not selected selected not selected selected i > N0 900 62.2 899.9 48.44
i≤N0 0 37.8 0.1 51.56
liner regression (eq. (7), cpu time 65.7 sec) not selected selected not selected selected i > N0 899.7 75.39 894.0 58.31
i≤N0 0.3 24.61 6.0 41.69
categorical regression (70.4 sec)
not selected selected not selected selected
i > N0 897.3 0 — —
i≤N0 2.7 100 — —
eq. (9) (84.1 sec)
not selected selected not selected selected i > N0 900 84.55 899.3 74.0
i≤N0 0 14.55 0.7 26.0
Finally, we also applied TD based unsupervised FE toxijks.
TD is computed as
xijks= N
X
`4=1
M
X
`1=1
K
X
`2=1
S
X
`3=1
G(`1`2`3`4)u`1ju`2ku`3su`4i
(11) Then`1and`2that have largest absolute values of correlation coefficients betweenu`1j andaj or u`2k andbk are selected.
Then top two `1 that have larger absolute G(`1`21`4)s are selected. The reason why `3 is fixed to be 1 is becauseu1s
always represent u`3s that lacks s dependency, i.e., constant
independent ofs(Sincexijksshould take same values between
replicates,u`3sthat do not have anysdependence is selected).
ThenP-values are attributed to ias
Pi=Pχ2
"
>X `4
u
`4i
σ`4
2#
(12)
where summation is taken over two selected `4 only.
No matter which one of liner regression (eq.(7)), eq. (9), categorical regression (eq.(10)) or TD (eq.(11)) is used to computePi,Piis corrected by BH criterion [2] andis having
correctedPiless than thresholdP-values are selected as those
associated with dependency uponj andk, respectively. For simplicity, we employ aj = j and bk = k when
generating xijks using eq. (8) as well as eq. (9) is used for
regression analysis. Specifically, we chose N = 1000, N0 =
100, M =K = 3, S = 5. Generation of xijks and selection
ofis are repeated by 100 times with two distinct thresholdP -values0.01or0.1for each trial. Table III shows the averaged performance over 100 trials. Although categorical regression, eq. (10), can outperform other three since it is expected to completely reproduce eq. (8) as denoted in the above, it has one week point; it cannot explicitly consider the dependence of aj and bk upon j and k, since ξijkajbks are estimated as
one parameter αijk. This might prevent us from selecting is
that are specifically associated with the dependence upon j
andk that aj andbk represent. Even if someis are selected,
TABLE IV
G(1,1,2,1,1, `6)S COMPUTED BY THEHOSVDALGORITHM
`6 G(1,1,2,1,1, `6) `6 G(1,1,2,1,1, `6)
1 -11.846381 6 22.375546
2 -28.104674 7 -41.997092
3 312.362569 8 -9.048416
4 -71.001444 9 9.212773
5 -189.719321 10 3.394629
it might because of dependence upon j and k that aj and bk do not represent. There are no ways for us to check this
point. In this sense, TD based unsupervised FE, which is the second best, is better than categorical regression since TD based unsupervised FE can considerajandbk when selecting u`1j andu`2k correlated withaj andbk, respectively.
Another advantages of TD based unsupervised FE is short cpu time required (Table III). Roughly speaking, cpu time required for TD based unsupervised FE is one tench of other three methods that must repeat regression analysis byNtimes. This difference might matter when we are forced to deal with massive data set.
The reason why TD based unsupervised FE can consider dependence uponj andkthat aj andbk have although other
methods cannot is as follows; because of random nature of
ξijk in eq. (8), when individual i is considered, there are no
ways to consider dependence upon j and k that aj and bk
have. Nevertheless, when xijkss are averaged over multiple is, there are some possibilities that dependence uponj andk
thataj andbk have can appear, since randomness ofξijk can
be smeared out because of averaging. In actual, sinceu`1j as
well asu`2k can be such variables that can appear only after
averaging and can represent dependence uponj andkthataj
andbkhave. This is the reason why TD based unsupervised FE
can outperform eq. (9) that explicitly consider multiplicative nature whenxijkss are generated and can consider dependence
uponjandkthatajandbkhave, which categorical regression,
eq.(10), cannot.
B. Selection of genes
At first, we apply TD based unsupervised FE to gene expression profiles introduced in Materials and Methods. Then other methods applied to synthetic data set than TD based unsupervised FE are considered for the comparisons in the next section, discussions and conclusions.
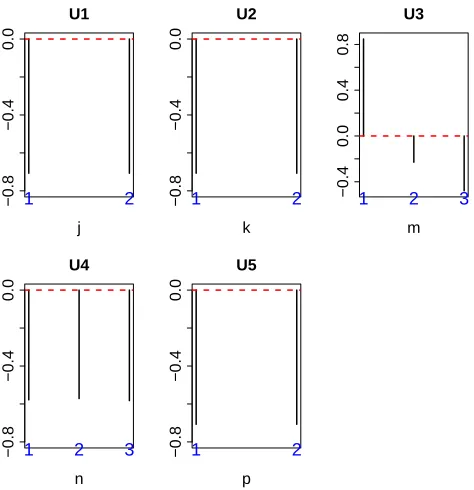
We selected `1 = 1, `2 = 1, `3 = 2, `4 = 1, and
`5 = 1 based on the criteria described above (Fig. 3), and the associated G(1,1,2,1,1, `6) values are listed in Table IV, demonstrating the largest value forG(1,1,2,1,1,3). The associated Pi values were computed using u3i as shown in
−0.8
−0.4
0.0
U1
j
1 2 −0.8
−0.4
0.0
U2
k
1 2 −0.4
0.0
0.4
0.8
U3
m
1 2 3
−0.8
−0.4
0.0
U4
n
1 2 3 −0.8
−0.4
0.0
U5
p
1 2
Fig. 3. Singular value vectors obtained by the HOSVD algorithm. U1:u1j,
U2:u1k, U3:u2m, U4:u1m, and U5:u1p. See Materials and Methods for the
meanings ofj, k, m, n, andp.
TABLE V
ONE HUNDRED AND THIRTY FOUR GENES SELECTED BYTD-BASED UNSUPERVISEDFE
Actb Actg1 Ahsg Alb Ambp Apoa1 Apoa2 Apoc1 Apoe B2m Bst2 C3 Ccnb1ip1 Cd74 Cfb Eef1a1 Eef1g Eef2 Fabp1 Fau Fga Fgb Fgg Fth1 Ftl1 Gapdh Gc Gm10800 Gm2000 Gpx1 H2-Aa H2-D1 H2-K1 H2-T23 Hamp Hba-a2 Hbb-bs Hbb-bt Hist1h3b Hist1h4h Hist2h2aa2 Hp Hpx Hsp90ab1 Hsp90b1 Hspa8 Ifi27l2a Ifitm3 Lars2 Lcn2 Lyz2 mt-Atp6 mt-Atp8 mt-Co1 mt-Co2 mt-Co3 mt-Cytb mt-Nd1 mt-Nd2 mt-Nd3 mt-Nd4 Mt1 Mt2 Myh9 Orm1 Orm2 Pabpc1 Psap Ptma Rack1 Rpl10-ps3 Rpl11 Rpl12 Rpl13 Rpl13a Rpl14 Rpl17 Rpl19 Rpl23a Rpl26 Rpl3 Rpl32 Rpl36 Rpl36a Rpl37a Rpl38 Rpl4 Rpl41 Rpl5 Rpl6 Rpl7 Rpl7a Rpl8 Rplp0 Rplp1 Rplp2 Rps11 Rps12 Rps14 Rps15 Rps17 Rps18 Rps2 Rps21 Rps23 Rps24 Rps27a Rps27rt Rps29 Rps3 Rps3a1 Rps4x Rps5 Rps6 Rps7 Rps8 Rps9 Rpsa S100a8 S100a9 Saa1 Saa2 Serpina1a Serpina1b Serpina1c Serpina1d Serpina3k Tmsb4x Tpt1 Trf Ttr Ubb Ubc Wfdc21
C. Protein-protein interaction with coronavirus infection
We first evaluated whether the 134 selected genes could reflect the process of coronavirus infection using the Enrichr server for functional enrichment analysis. Several of the genes were enriched in the category “Virus-Host PPI P-HIPSTer 2020”, which is related to SARS-CoV (Table VI, see the supplementary materials for the full list).
These genes were also related to ORF1ab, polyprotein, and 3C-like protease. Interestingly, Woo et al. [5] suggested that ORF1ab, which encodes a replicase polyprotein of CoV-HKU1, is cleaved by papain-like proteases and 3C-like pro-teinase. Thus, it is reasonable that ORF1ab, polyprotein, and 3C-like protease would be affected during MHV infection VI. Other PPIs detected that are not listed in Table VI (see supplementary materials) were also mainly associated with ORF1ab and polyproteins, suggesting that our strategy has clear capability to elucidate the basic infectious process at the
molecular level that is common among various coronaviruses.
D. Virus perturbation
We next evaluated whether genes with known altered ex-pression by virus perturbation overlapped with the 134 genes selected by our TD-based unsupervised FE approach (Table VII; see the supplementary material for the full list).
Among these, we detected the overlap of many genes that are pertubated in response to either SARS-CoV or SARS-like bat CoV, which are the genetically closest coronaviruses to the new SARS-CoV-2 strain. This further suggests that our results could have high similarity to the genes perturbated in SARS-CoV-2 infection.
E. TMPRSS2 as a scavenger receptor
For further functional enrichment analysis, we uploaded the 134 selected genes to Metascape to identify non-redundant bi-ological terms (Fig. 4). Among the terms identified, “R-HSA-2173782: Binding and Uptake of Ligands by Scavenger Recep-tors” was the third most significantly enriched term. Although it was initially surprising that a scavenger receptor might be related to the response to coronavirus infection, a search of the related literature revealed that the scavenger receptor TMPRSS2 plays a critical role in SARS-CoV-2 infection as well as SARS-CoV infection [6]. Isolation of SARS-CoV-2 was also reported to be enhanced by TMPRSS2-expressing cells [7]. Moreover, TMPRSS2 contains a scavenger receptor domain [8], suggesting that TMPRSS2 activity would be related to detection of scavenger receptor activity. This finding further demonstrates the outstanding capability of our strategy to detect factors related to the SARS-CoV-2 infectious process. Moreover, this analysis suggests that research on the SARS-CoV infection process could be informative for understanding the SARS-CoV-2 infection process when it is not possible to directly investigate SARS-CoV-2 infection.
F. Drug discovery
We previously demonstrated that genes selected by TD-based unsupervised FE are useful to screen for drugs that are effective in treating disease or those that may cause adverse effects [9]. Therefore, we used this approach to screen for candidate drugs to treat coronavirus infections based on the individual terms that emerged from the Enrichr analysis.
1) Drug Matrix: In the Enrichr category “DrugMatrix”, the top-ranked drug was related to virus infection (Table VIII; see the supplementary materials for the full list). Most of these viruses are enveloped, single-stranded RNA viruses. Coronaviruses, including SARS-CoV-2, are positive-sense, en-veloped, single-stranded RNA viruses, whereas influenza virus is a negative-sense, enveloped, single-stranded RNA virus.
TABLE VI
SARS-COV-RELATED VIRUSPPIINENRICHR
Term Overlap P-value Adjusted P-value
SARS coronavirus excised polyprotein 1..4369 (gene: orf1ab) 10/194 7.52×10⁻⁷ 1.68×10⁻³ SARS coronavirus P2 full polyprotein 1..4382 10/198 9.06×10⁻⁷ 1.01×10⁻³ SARS coronavirus nsp7-pp1a/pp1ab (gene: orf1ab) 4/36 9.61×10⁻⁵ 2.08×10⁻² SARS coronavirus 3C-like protease (gene: orf1ab) 3/19 2.63×10⁻⁴ 3.05×10⁻²
TABLE VII
VIRUS PERTURBATION INENRICHER
Term Overlap P-value Adjusted P-value
up
SARS-ddORF6 24Hour GSE47961 10/300 3.52×10⁻⁵ 3.79×10⁻³ cSARS Bat SRBD 60Hour GSE37827 9/300 1.93×10⁻⁴ 1.04×10⁻² SARS-BatSRBD 60Hour GSE47961 8/300 9.51×10⁻⁴ 4.38×10⁻² down
SARS-BatSRBD 96Hour GSE47960 11/300 5.77×10⁻⁶ 4.66×10⁻⁴ SARS-BatSRBD 84Hour GSE47960 9/300 1.93×10⁻⁴ 6.24×10⁻³ cSARS Bat SRBD 60Hour GSE37827 8/300 9.51×10⁻⁴ 2.36×10⁻²
Fig. 4. Redundant heatmap of enriched terms generated by uploading the selected 134 genes to Metascape
TABLE VIII
DRUGS ENRICHED IN THE“DRUGMATRIX”CATEGORY INENRICHR. THE FULL LIST IS AVAILABLE IN THE SUPPLEMENTARY MATERIAL
Term Overlap P-value Adjusted P-value
Primaquine-45 mg/kg in CMC-Rat-Liver-5d-up 23/315 1.40×10⁻¹⁷ 1.10×10⁻¹³ Meloxicam-33 mg/kg in Corn Oil-Rat-Kidney-1d-up 23/337 6.19×10⁻¹⁷ 2.44×10⁻¹³ Cytarabine-487 mg/kg in Saline-Rat-Liver-0.25d-up 22/300 6.87×10⁻¹⁷ 1.80×10⁻¹³ Clotrimazole-60 uM in DMSO-Rat-Primary rat hepatocytes-0.67d-dn 24/381 7.59×10⁻¹⁷ 1.49×10⁻¹³ Diclofenac-3.5 mg/kg in Corn Oil-Rat-Liver-5d-dn 21/269 1.04×10⁻¹⁶ 1.64×10⁻¹³ Pyrogallol-1000 mg/kg in Water-Rat-Liver-3d-up 23/349 1.33×10⁻¹⁶ 1.75×10⁻¹³ Clindamycin-161 mg/kg in Saline-Rat-Kidney-1d-up 23/366 3.76×10⁻¹⁶ 4.23×10⁻¹³ Catechol-195 mg/kg in Saline-Rat-Liver-0.25d-up 21/290 4.76×10⁻¹⁶ 4.69×10⁻¹³ Anisindione-75 mg/kg in CMC-Rat-Liver-5d-up 21/295 6.72×10⁻¹⁶ 5.88×10⁻¹³ Phenylhydrazine-78 mg/kg in Water-Rat-Liver-3d-up 22/335 7.00×10⁻¹⁶ 5.51×10⁻¹³ N-Nitrosodiethylamine-1.67 mg/kg in Saline-Rat-Liver-0.25d-up 23/377 7.15×10⁻¹⁶ 5.12×10⁻¹³ Neomycin-56 mg/kg in Corn Oil-Rat-Liver-1d-dn 20/259 7.28×10⁻¹⁶ 4.78×10⁻¹³
sarcoma virus. Myelocytomatosis virus is a retrovirus, which is an enveloped, negative-sense, single-stranded RNA virus, whereas Rous sarcoma virus is an enveloped, positive-sense, single-stranded RNA virus. Although there are no studies showing that cytarabine is effective against infection of an RNA virus, one report demonstrated that cytarabine can affect DNA virus infection [12]. Pyrogallol was reported to have
negative-sense, single-stranded RNA viruses. This suggests that a single drug can effectively inhibit a wide range of viruses from DNA viruses to both negative- and positive-sense RNA viruses. The structure-dependent antiviral activity of catechol derivatives in pyroligneous acid against encephalomyocarditis virus was reported, which is a non-enveloped single-stranded RNA virus [14]. To our knowledge, there are no reports that neomycin is effective against RNA viruses; however, one study showed that it could inhibit infection of fibroblasts with human cytomegalovirus [15], which is a DNA virus.
Although not all viruses identified to be related to the 134 genes selected by TD-based unsupervised FE are enveloped, positive-sense, single-stranded RNA viruses similar to SARS-CoV-2, since drugs shown to be effective against other viruses (e.g., DNA viruses) are also often effective against RNA viruses (including pyrogallol that was screened by our strat-egy), drugs in Table VIII warrant being tested as potential treatments for SARS-CoV-2 infection.
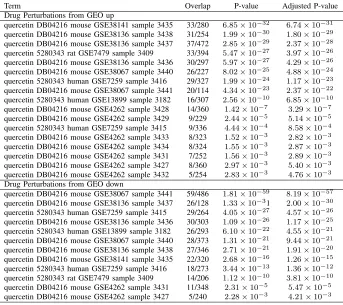
2) Drug Perturbations from GEO: Several promising drug compound candidates were also screened from the GEO “Drug Perturbations from GEO up” and “Drug Perturbations from GEO down” categories, along with available evidence for possible adverse effects (Table IX; see the supplementary material for the full list).
Drugs associated with upregulated genes that overlapped with the 134 genes selected by TD-based unsupervised FE are considered to be more likely to cause adverse effects, since they will enhance the expression of genes altered by SARS-CoV infection. Captoprilis is an angiotensin-converting enzyme (ACE) inhibitor, which is known to activate ACE2 that is the receptor that SARS-CoV-2 uses to infect human cells [16], suggesting that this drug might have negative effects for COVID-19 therapy. Coenzyme Q10, which frequently emerged in Table IX, has been reported to accelerate virus infection [17], which could therefore also have negative effects for COVID-19 therapy. Fenretinide is known to effectively inhibit HIV infection [18], and therefore might be a promising drug candidate for SARS-CoV-2 even though it was listed in the “Drug Perturbations from GEO up” category.
In contrast to the drugs in the above list, those associated with downregulated genes that overlapped with the 134 genes selected by TD-based unsupervised FE are considered to be able to effectively suppress SARS-CoV-2 infection, since they will inhibit the expression of genes altered by SARS-CoV infection. Pioglitazone was also included in the list of candidate compounds for SARS-CoV-2 screened by an
in silico method [19]. Quercetin was reported to inhibit the cell entry of SARS-CoV-2 [20], and was also included in the list of candidate compounds for SARS-CoV-2 screened by an in silico method [21]. Fenretinide was also included in the drugs identified as effective compounds in the “Drug perturbations from GEO up” category as described above. Decitabine is one of the drugs used in HIV combination therapy [22]. Troglitazone impedes the oligomerization of sodium taurocholate co-transporting polypeptide and entry of hepatitis B virus into hepatocytes [23], which is a partially double-stranded DNA virus. Finally, motexafin gadolinium was reported to selectively induce apoptosis in HIV-1-infected
CD4+ T helper cells [24].
Based on these observations, our strategy appears to be useful to identify potential drug compounds for SARS-CoV-2.
G. Comparison with in silico drug discovery
Finally, we compared the drugs screened out using our approach from the “Drug perturbations from GEO up/down” lists with those screened from two in silico drug discovery studies [19], [21]
1) Comparison with Wu et al. [19]: We found multiple hits, which are summarized in Table X. The main drugs identified included doxycycline, ascorbic acid, isotretinoin, pioglitazone, cortisone, and tibolone.
Wu et al. [19] identified 29 potential PLpro inhibitors, 27 potential 3CLpro inhibitors, and 20 potential RdRp inhibitors from the ZINC drug database, and identified 13 potential PLpro inhibitors, 26 potential 3Clpro inhibitors, and 20 Po-tential RdRp inhibitors from their in-house natural product database. Doxycycline was among both the potential PLpro and 3CLpro inhibitors; ascorbic acid and isotretinoin were among the potential PLpro inhibitors; pioglitazone was among the potential 3CLpro inhibitors; and cortisone and tibolone were included in the potential RdRp inhibitors from the ZINC drug database. These multiple hits also further support the suitability of our strategy.
2) Comparison with Ubani et al. [21]: Ubani et al. [21] screened a library of 22 phytochemicals with antiviral activity obtained from the PubChem database for activity against the spike envelope glycoprotein and main protease of SARS-CoV-2. Among these, we found only one hit that overlapped with our screened out drugs, which was quercetin (Table XI).
IV. DISCUSSION ANDCONCLUSION
In this paper, we present a novel evaluation method to identify drugs that could be used to effectively treat COVID-19. We applied a TD-based unsupervised FE method to select genes with altered expression caused by MHV infection in mice. Although the dataset analyzed for this study was not based on SARS-CoV-2 infection, the 134 genes selected by TD-based unsupervised FE can still be considered useful for gaining a better understanding of the infectious mechanism of SARS-CoV-2 for several reasons. First, the 134 genes selected were enriched in general RNA virus proteins that play important roles during infectious processes. This suggests that the infectious mechanism represented by the 134 genes in the mouse model is also applicable to SARS-CoV-2 infection. In fact, these genes were also enriched in processes related to scavenger receptor activity, which might reflect the critical role of TMPRSS2 activity in SARS-CoV-2 replication, suggesting a potential therapeutic target.
TABLE IX
DRUGS IDENTIFIED IN“DRUG PERTURBATIONS FROMGEOUP/DOWN”INENRICHR FOR THE134GENES SELECTED BYTD-BASED UNSUPERVISEDFE.
Term Overlap P-value Adjusted P-value
Drug Perturbations from GEO up
coenzyme Q10 5281915 mouse GSE15129 sample 3464 64/302 1.32×10−81 1.20×10−78 coenzyme Q10 5281915 mouse GSE15129 sample 3456 63/396 1.05×10−71 4.78×10−69 captopril DB01197 mouse GSE19286 sample 2689 47/134 1.76×10−70 5.33×10−68 ubiquinol 9962735 mouse GSE15129 sample 3463 60/346 2.28×10−70 5.15×10−68 N-METHYLFORMAMIDE 31254 rat GSE5509 sample 3570 56/283 8.87×10−69 1.61×10−66 1-Naphthyl isothiocyanate 11080 rat GSE5509 sample 3568 56/301 3.80×10−67 5.73×10−65 fenretinide 5288209 rat GSE3952 sample 3561 59/397 6.98×10−65 9.04×10−63 coenzyme Q10 5281915 mouse GSE15129 sample 3462 50/257 1.49×10−60 1.69×10−58 bexarotene DB00307 human GSE6914 sample 2680 43/147 3.03×10−60 3.05×10−58 FENRETINIDE 5288209 rat GSE3952 sample 3563 52/345 5.99×10−57 5.42×10−55 Drug Perturbations from GEO up
pioglitazone DB01132 rat GSE21329 sample 2841 56/321 1.85×10−65 1.67×10−62 quercetin DB04216 mouse GSE38067 sample 3441 59/486 1.81×10−59 8.19×10−57 ubiquinol 9962735 mouse GSE15129 sample 3461 53/349 2.64×10−58 7.95×10−56 fenretinide 5288209 rat GSE3952 sample 3559 56/440 2.31×10−57 5.21×10−55 decitabine 451668 mouse GSE4768 sample 3108 45/226 1.06×10−54 1.91×10−52 troglitazone DB00197 rat GSE21329 sample 2832 50/355 4.51×10−53 6.79×10−51 adenosine triphosphate 5957 human GSE30903 sample 3219 49/341 2.16×10−52 2.78×10−50 alitretinoin DB00523 rat GSE3952 sample 2673 53/483 1.54×10−50 1.74×10−48 bexarotene 82146 rat GSE3952 sample 3560 48/361 1.42×10−49 1.43×10−47 HYPOCHLOROUS ACID 24341 human GSE11630 sample 3201 41/221 2.67×10−48 2.41×10−46 streptozocin DB00428 mouse GSE38067 sample 3439 44/287 4.40×10−48 3.61×10−46 rosiglitazone DB00412 mouse GSE35011 sample 2813 44/290 7.13×10−48 5.36×10−46 motexafin gadolinium (4 h) DB05428 human GSE2189 sample 3125 43/302 1.70×10−45 1.18×10−43
TABLE X
LIST OFin silicoSCREENED DRUGS[19]WHOSE TARGET GENES WERE ALSO ENRICHED IN THE134GENES SELECTED BYTD-BASED UNSUPERVISEDFE.
Term Overlap P-value Adjusted P-value
Drug Perturbations from GEO up
doxycycline DB00254 mouse GSE29848 sample 3209 32/267 3.73×10⁻³¹ 3.56×10⁻³⁰ doxycycline DB00254 human GSE2624 sample 3074 28/175 6.59×10⁻³¹ 6.22×10⁻³⁰ doxycycline DB00254 human GSE2624 sample 3077 27/209 3.34×10⁻²⁷ 2.46×10⁻²⁶ doxycycline DB00254 human GSE2624 sample 3076 25/272 1.71×10⁻²¹ 8.32×10⁻²¹ doxycycline DB00254 mouse GSE29848 sample 3207 22/225 1.40×10⁻¹⁹ 6.10×10⁻¹⁹ doxycycline DB00254 mouse GSE29848 sample 3208 12/291 6.24×10⁻⁷ 1.40×10⁻⁶ ascorbic acid 54670067 human GSE11919 sample 3190 8/313 1.25×10⁻³ 2.33×10⁻³ isotretinoin DB00982 human GSE10432 sample 2772 8/308 1.13×10⁻³ 2.11×10⁻³ pioglitazone DB01132 rat GSE21329 sample 2843 48/400 2.31×10−47 7.49×10−46 pioglitazone DB01132 rat GSE21329 sample 2842 42/349 3.21×10−41 6.19×10−40 pioglitazone DB01132 rat GSE21329 sample 2842 42/349 3.21×10−41 6.19×10−40 pioglitazone DB01132 rat GSE20219 sample 2794 13/292 8.57×10⁻⁸ 2.01×10⁻⁷ pioglitazone 4829 mouse GSE1458 sample 2587 11/318 1.00×10⁻⁵ 2.13×10⁻⁵ pioglitazone DB01132 mouse GSE32536 sample 2797 7/307 4.69×10⁻³ 8.40×10⁻³ pioglitazone DB01132 rat GSE20219 sample 2795 7/330 6.90×10⁻³ 1.22×10⁻² hydrocortisone DB00741 human GSE7890 sample 2751 40/305 1.01×10−40 1.75×10−39 tibolone 444008 human GSE12446 sample 3204 15/287 9.26×10⁻¹⁰ 2.38×10⁻⁹ Drug Perturbations from GEO down
doxycycline DB00254 human GSE2624 sample 3075 20/358 3.39×10⁻¹³ 1.34×10⁻¹² doxycycline DB00254 mouse GSE29848 sample 3208 17/309 2.91×10⁻¹¹ 1.02×10⁻¹⁰ doxycycline DB00254 human GSE2624 sample 3077 18/391 1.37×10⁻¹⁰ 4.58×10⁻¹⁰ doxycycline DB00254 mouse GSE29848 sample 3207 17/375 5.85×10⁻¹⁰ 1.86×10⁻⁹ doxycycline DB00254 human GSE2624 sample 3074 17/425 3.88×10⁻⁹ 1.16×10⁻⁸ doxycycline DB00254 mouse GSE29848 sample 3209 9/333 4.16×10⁻⁴ 8.91×10⁻⁴ ascorbic acid 54670067 human GSE11919 sample 3190 19/287 6.71×10⁻¹⁴ 2.75×10⁻¹³ Ascorbic acid 54670067 mouse GSE37676 sample 3132 15/306 2.23×10⁻⁹ 6.89×10⁻⁹ pioglitazone DB01132 rat GSE21329 sample 2841 56/321 1.85×10−65 1.67×10−62 pioglitazone 4829 mouse GSE1458 sample 2587 28/282 5.89×10⁻²⁵ 5.26×10⁻²⁴ pioglitazone DB01132 rat GSE20219 sample 2794 25/308 3.62×10⁻²⁰ 2.25×10⁻¹⁹ pioglitazone DB01132 rat GSE20219 sample 2795 21/270 1.12×10⁻¹⁶ 5.41×10⁻¹⁶ pioglitazone DB01132 human GSE8157 sample 2796 12/269 2.70×10⁻⁷ 7.17×10⁻⁷ tibolone 444008 human GSE12446 sample 3204 35/313 4.90×10⁻³³ 8.68×10⁻³²
One might wonder if MHV is a suitable model to be consider SARS-CoV-2 infection, since there are more data set
SARS-CoV-TABLE XI
LIST OFin silicoSCREENED DRUGS[21]WHOSE TARGET GENES ARE ALSO ENRICHED IN THE134GENES SELECTED BYTDBASED UNSUPERVISEDFE.
Term Overlap P-value Adjusted P-value
Drug Perturbations from GEO up
quercetin DB04216 mouse GSE38141 sample 3435 33/280 6.85×10⁻³² 6.74×10⁻³¹ quercetin DB04216 mouse GSE38136 sample 3438 31/254 1.99×10⁻³⁰ 1.80×10⁻²⁹ quercetin DB04216 mouse GSE38136 sample 3437 37/472 2.85×10⁻²⁹ 2.37×10⁻²⁸ quercetin 5280343 rat GSE7479 sample 3409 33/394 5.47×10⁻²⁷ 3.97×10⁻²⁶ quercetin DB04216 mouse GSE38136 sample 3436 30/297 5.97×10⁻²⁷ 4.29×10⁻²⁶ quercetin DB04216 mouse GSE38067 sample 3440 26/227 8.02×10⁻²⁵ 4.88×10⁻²⁴ quercetin 5280343 human GSE7259 sample 3416 29/327 1.99×10⁻²⁴ 1.17×10⁻²³ quercetin DB04216 mouse GSE38067 sample 3441 20/114 4.34×10⁻²³ 2.37×10⁻²² quercetin 5280343 human GSE13899 sample 3182 16/307 2.56×10⁻¹⁰ 6.85×10⁻¹⁰ quercetin DB04216 mouse GSE4262 sample 3428 14/360 1.42×10⁻⁷ 3.29×10⁻⁷ quercetin DB04216 mouse GSE4262 sample 3429 9/229 2.44×10⁻⁵ 5.14×10⁻⁵ quercetin 5280343 human GSE7259 sample 3415 9/336 4.44×10⁻⁴ 8.58×10⁻⁴ quercetin DB04216 mouse GSE4262 sample 3433 8/323 1.52×10⁻³ 2.82×10⁻³ quercetin DB04216 mouse GSE4262 sample 3434 8/324 1.55×10⁻³ 2.87×10⁻³ quercetin DB04216 mouse GSE4262 sample 3431 7/252 1.56×10⁻³ 2.89×10⁻³ quercetin DB04216 mouse GSE4262 sample 3427 8/360 2.97×10⁻³ 5.40×10⁻³ quercetin DB04216 mouse GSE4262 sample 3432 5/254 2.83×10⁻³ 4.76×10⁻³ Drug Perturbations from GEO down
quercetin DB04216 mouse GSE38067 sample 3441 59/486 1.81×10−59 8.19×10−57 quercetin DB04216 mouse GSE38136 sample 3437 26/128 1.33×10⁻³¹ 2.00×10⁻³⁰ quercetin 5280343 human GSE7259 sample 3415 29/264 4.05×10⁻²⁷ 4.57×10⁻²⁶ quercetin DB04216 mouse GSE38136 sample 3436 30/303 1.09×10⁻²⁶ 1.17×10⁻²⁵ quercetin 5280343 human GSE13899 sample 3182 26/293 6.10×10⁻²² 4.55×10⁻²¹ quercetin DB04216 mouse GSE38067 sample 3440 28/373 1.31×10⁻²¹ 9.44×10⁻²¹ quercetin DB04216 mouse GSE38136 sample 3438 27/346 2.71×10⁻²¹ 1.91×10⁻²⁰ quercetin DB04216 mouse GSE38141 sample 3435 22/320 2.68×10⁻¹⁶ 1.26×10⁻¹⁵ quercetin 5280343 human GSE7259 sample 3416 18/273 3.44×10⁻¹³ 1.36×10⁻¹² quercetin 5280343 rat GSE7479 sample 3409 14/206 1.12×10⁻¹⁰ 3.81×10⁻¹⁰ quercetin DB04216 mouse GSE4262 sample 3431 11/348 2.31×10⁻⁵ 5.47×10⁻⁵ quercetin DB04216 mouse GSE4262 sample 3427 5/240 2.28×10⁻³ 4.21×10⁻³
2 infectious process, we also performed additional analyses using two SARS-CoV infectious processes toward mouse lung (see Materials and Methods). As can be seen in Figs. 5 and 6, `1 = 2 is selected as singular value vector u`1j that has
monotonic dependence upon j,`2= 2is selected as singular value vectoru`2k that has monotonic dependence uponk, and
`3 = 1 is selected as singular value vector u`3n that has
constant values regardless n for GSE33266 while `1 = 2 is selected as singular value vectoru`1j that has distinct values
between Mock (j = 3) and infectious samples (j = 1,2),
`2 = 3 is selected as singular value vector u`2k that has
monotonic dependence upon k, and `3 = 1 is selected as singular value vectoru`3n that has constant values regardless
n for GSE50000. Then `4 = 2,3 and`4 = 1 are selected as those associated with the larger absolute values ofG(`1`2`3`4) given `1, `2, `3. P-values, Pi, are attributed to gene i using
cumulativeχ2distribution,P
χ2[> x], as described in Materials
and Methods, 569 and 475 gene symbols associated with selected genes are selected for GSE33266 and GSE50000, respectively (see supplementary materials). Figure 7 shows Venn diagram of these two sets of genes and 134 genes selected by TD based unsupervised FE using GSE146074. Although there are some overlaps, majority of genes are not shared among these three gene sets.
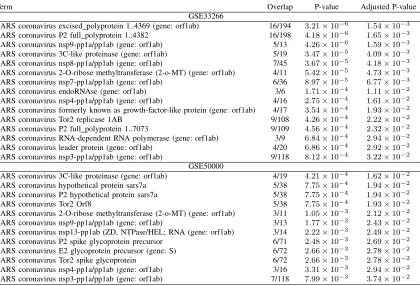
These two sets of genes are uploaded to Enrichr and it is checked if they are significantly overlapped with corona virus PPI genes (Table XII). It is obvious that two sets of selected genes are significantly overlapping with genes that are
●
●
● ●
●
−0.4
0.0
0.2
0.4
0.6
0.8
U1
j
1 2 3 4 5
●
●
●
●
−0.6
−0.2
0.0
0.2
0.4
U2
days
D1 D2 D4 D7 −0.5
−0.4
−0.3
−0.2
−0.1
0.0
U3
n
1 2 3 4 5
Fig. 5. Singular value vectors obtained by the HOSVD algorithm applied to GSE33266 (Table II). U1:u2j, U2:u2k, and U3:u1n. See Materials and
Methods for the meanings ofj, kandn.
supposed to interact with SARS-CoV proteins in spite of that these two gene sets are not highly coincident with 134 genes selected by TD based unsupervised FE using GSE146074 (Fig. 7). This means that TD based unsupervised FE generally has ability to predict PPI using gene expression profiles no matter which data sets are used. It also suggests that the achievement in Table VI is not unlikely accidental but really an evidence that genes selected by TD based unsupervised FE are those interacting with SARS-CoV proteins during infectious processes.
TABLE XII
SARS-COV-RELATED VIRUSPPIINENRICHR
Term Overlap P-value Adjusted P-value
GSE33266
SARS coronavirus excised polyprotein 1..4369 (gene: orf1ab) 16/194 3.21×10⁻⁶ 1.54×10⁻³ SARS coronavirus P2 full polyprotein 1..4382 16/198 4.18×10⁻⁶ 1.65×10⁻³ SARS coronavirus nsp9-pp1a/pp1ab (gene: orf1ab) 5/13 4.26×10⁻⁶ 1.59×10⁻³ SARS coronavirus 3C-like proteinase (gene: orf1ab) 5/19 3.47×10⁻⁵ 4.09×10⁻³ SARS coronavirus nsp8-pp1a/pp1ab (gene: orf1ab) 7/45 3.67×10⁻⁵ 4.18×10⁻³ SARS coronavirus 2-O-ribose methyltransferase (2-o-MT) (gene: orf1ab) 4/11 5.42×10⁻⁵ 4.73×10⁻³ SARS coronavirus nsp7-pp1a/pp1ab (gene: orf1ab) 6/36 8.97×10⁻⁵ 6.77×10⁻³
SARS coronavirus endoRNAse (gene: orf1ab) 3/6 1.71×10⁻⁴ 1.11×10⁻²
SARS coronavirus nsp4-pp1a/pp1ab (gene: orf1ab) 4/16 2.75×10⁻⁴ 1.61×10⁻² SARS coronavirus formerly known as growth-factor-like protein (gene: orf1ab) 4/17 3.54×10⁻⁴ 1.93×10⁻²
SARS coronavirus Tor2 replicase 1AB 9/108 4.26×10⁻⁴ 2.22×10⁻²
SARS coronavirus P2 full polyprotein 1..7073 9/109 4.56×10⁻⁴ 2.32×10⁻² SARS coronavirus RNA-dependent RNA polymerase (gene: orf1ab) 3/9 6.84×10⁻⁴ 2.94×10⁻² SARS coronavirus leader protein (gene: orf1ab) 4/20 6.86×10⁻⁴ 2.92×10⁻² SARS coronavirus nsp3-pp1a/pp1ab (gene: orf1ab) 9/118 8.12×10⁻⁴ 3.22×10⁻²
GSE50000
SARS coronavirus 3C-like proteinase (gene: orf1ab) 4/19 4.21×10⁻⁴ 1.62×10⁻² SARS coronavirus hypothetical protein sars7a 5/38 7.75×10⁻⁴ 1.94×10⁻² SARS coronavirus P2 hypothetical protein sars7a 5/38 7.75×10⁻⁴ 1.94×10⁻²
SARS coronavirus Tor2 Orf8 5/38 7.75×10⁻⁴ 1.93×10⁻²
SARS coronavirus 2-O-ribose methyltransferase (2-o-MT) (gene: orf1ab) 3/11 1.05×10⁻³ 2.12×10⁻² SARS coronavirus nsp9-pp1a/pp1ab (gene: orf1ab) 3/13 1.77×10⁻³ 2.43×10⁻² SARS coronavirus nsp13-pp1ab (ZD, NTPase/HEL; RNA (gene: orf1ab) 3/14 2.22×10⁻³ 2.49×10⁻² SARS coronavirus P2 spike glycoprotein precursor 6/71 2.48×10⁻³ 2.69×10⁻² SARS coronavirus E2 glycoprotein precursor (gene: S) 6/72 2.66×10⁻³ 2.78×10⁻²
SARS coronavirus Tor2 spike glycoprotein 6/72 2.66×10⁻³ 2.78×10⁻²
SARS coronavirus nsp4-pp1a/pp1ab (gene: orf1ab) 3/16 3.31×10⁻³ 2.94×10⁻² SARS coronavirus nsp3-pp1a/pp1ab (gene: orf1ab) 7/118 7.99×10⁻³ 3.74×10⁻²
−0.8
−0.4
0.0
0.2
0.4
0.6
U1
j
1 2 3
●
● ●
●
−0.6
−0.2
0.0
0.2
0.4
0.6
U2
days
d1 d2 d4 d7 −0.5
−0.4
−0.3
−0.2
−0.1
0.0
U3
n
1 2 3 4 5
Fig. 6. Singular value vectors obtained by the HOSVD algorithm applied to GSE50000 (Table II). U1:u2j, U2:u3k, and U3:u1n. See Materials and
Methods for the meanings ofj, kandn.
identified here might not be applicable to SARS-CoV-2 at all. In order to address this point, we compare the 134 genes (Table V) with genes reported to be interacting with SARS-CoV-2 proteins [25] (Table XIII). It is obvious that 134 genes are significantly overlapping with human genes reported to be interacting with SARS-CoV-2 proteins. This means that TD based unsupervised FE has ability to predict PPI even when only gene expression profiles during related virus infection are available.
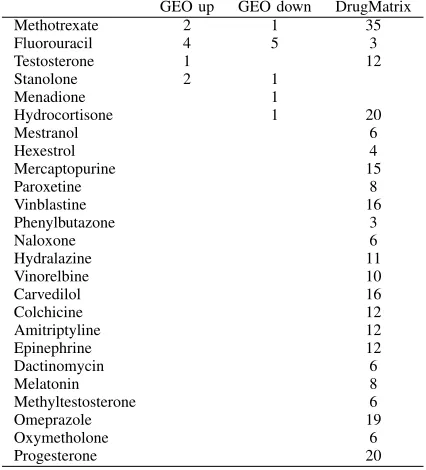
Finally, we also compared identified drugs (“Drug Pert GEO up/down” and “DrugMarix“ in supplementary materials) with those reported to be possible drugs toward SARS-CoV-2 [26]. Among 142 drugs identified by Zhou et al [26], as many as 25 drugs were found to significantly affect 134 genes in at
TABLE XIII
COINCIDENCE BETWEEN134GENES AND HUMAN GENES REPORTED TO BE INTERACTING WITHSARS-COV-2PROTEINS[25]
SARS-CoV-2 proteins P values Odds Ratio
SARS-CoV2 E 1.59×10−41 20.2
SARS-CoV2 M 1.53×10⁻³⁴ 13.7
SARS-CoV2 N 1.69×10−51 31.8
SARS-CoV2 nsp1 5.56×10⁻³³ 19.8
SARS-CoV2 nsp10 4.16×10⁻³² 23.0 SARS-CoV2 nsp11 3.59×10−41 19.1 SARS-CoV2 nsp12 4.29×10⁻³¹ 18.3 SARS-CoV2 nsp13 7.26×10−42 18.6 SARS-CoV2 nsp14 1.64×10⁻³² 22.3 SARS-CoV2 nsp15 3.72×10⁻²⁶ 16.4
SARS-CoV2 nsp2 5.25×10−48 22.7
SARS-CoV2 nsp4 2.18×10⁻³⁵ 16.0
SARS-CoV2 nsp5 4.30×10−40 25.5
SARS-CoV2 nsp5 C145A 8.22×10⁻³¹ 25.1
SARS-CoV2 nsp6 1.52×10−36 16.0
SARS-CoV2 nsp7 6.93×10⁻³¹ 14.7
SARS-CoV2 nsp8 3.51×10−44 19.6
SARS-CoV2 nsp9 2.62×10−42 23.3
SARS-CoV2 orf10 2.67×10−46 22.3 SARS-CoV2 orf3a 8.57×10−44 19.8 SARS-CoV2 orf3b 3.79×10−47 24.8
SARS-CoV2 orf6 1.51×10−42 21.9
SARS-CoV2 orf7a 6.28×10⁻³⁴ 15.3
SARS-CoV2 orf8 1.90×10⁻³³ 14.0
Fig. 7. Venn diagrams of 134 genes selected by TD bases unsupervised FE using GSE146074, 569 genes selected by TD bases unsupervised FE using GSE33266, and 475 genes selected by TD bases unsupervised FE using GSE50000.
TABLE XIV
NUMBER OF EXPERIMENTS ASSOCIATED WITH ADJUSTEDP-VALUES IN VARIOUSENRICHR CATEGORIES FOR THE DRUGS IDENTIFIED IN ANOTHER
STUDY[26]
GEO up GEO down DrugMatrix
Methotrexate 2 1 35
Fluorouracil 4 5 3
Testosterone 1 12
Stanolone 2 1
Menadione 1
Hydrocortisone 1 20
Mestranol 6
Hexestrol 4
Mercaptopurine 15
Paroxetine 8
Vinblastine 16
Phenylbutazone 3
Naloxone 6
Hydralazine 11
Vinorelbine 10
Carvedilol 16
Colchicine 12
Amitriptyline 12
Epinephrine 12
Dactinomycin 6
Melatonin 8
Methyltestosterone 6
Omeprazole 19
Oxymetholone 6
Progesterone 20
least one experiment within either DrugMatrix, or GEO, in Enrichr with adjusted P-values less than 0.05 (XIV). Thus, our proposal of drug repositioning is also reliable.
Since it is unlikely that this level of agreements mentioned in the above is purely accidental, the drugs identified in the present study can be useful candidates for further evaluation in COVID-19 therapy. This work therefore provides a foundation for further research pertaining to utilizing advanced learning concepts to analyze COVID-19 infectious disease.
Final concerns to be addressed might be the comparison
with other methods applied to synthetic data sets than TD based unsupervised FE. When considering synthetic data set, categorical regression, eq. (10), outperformed TD based unsu-pervised FE. Although eq. (9) cannot be better than TD based unsupervised FE (Table III), it is still comparative. If these two more easily understood methods are better than or comparative to TD based unsupervised FE, TD based unsupervised FE, which is more difficult to interpret, is useless. In order to check this point, we applied categorical regression and eq. (9), which are modified as
xijkmnp=
2
X
j0=1 2
X
k0=1 3
X
m0=1
αij0k0m0δjj0δkk0δmm0+γi00 (13)
and
xijkmnp=α0iajbkcm+γi0 (14)
where ai = i, bk = k, cm = m, to the present set
(GSE146074). Thenis associated with adjustedP-values less than 0.01 are selected; it turned out that there are too many genes that pass this screening, 25609 and 20217, respectively. This suggests that these two methods lack the ability to screen limited number of genes that are likely interacting SARS-CoV-2 proteins, since not most of genes but only limited number of humna genes are interacting SARS-CoV-2 proteins (2×10⁴ are as many as all of human protein coding genes). Although this fact is enough to deny to employ these two methods replaced with TD based unsupervised FE, we still seek other possibility; even if these two methods fail to screen limited number of genes, if only top ranked genes are selected, it might be possible to select limited number of genes that significantly overlap with genes reported to interact with SARS-CoV-2 proteins. In order to see this, we select top ranked 134 gene using P-values that these two methods compute and upload them to Enrichr. Nevertheless, we found that there are no SARS-CoV-2 proteins that significantly interact with these uploaded 134 genes. Since the significant interaction with SARS-CoV-2 proteins is the primary requirement for genes to be used to screen candidate drug compounds, these two methods are definitely useless fo the present purpose.
If we employ more complicated and sophisticated methods to select genes, it might be possible for us to have limited number of genes that significantly interact with SARS-CoV-2 protein. Nonetheless, since TD based unsupervised FE is simple and rapid (see cpu time in Table III) enough to achieve the present purpose, we are not willing to test more complicated and advanced methods in the present study.
ACKNOWLEDGMENT
REFERENCES
[1] S. Pfaender, K. B. Mar, E. Michailidis, A. Kratzel, D. Hirt, P. V’kovski, W. Fan, N. Ebert, H. Stalder, H. Kleine-Weber, M. Hoffmann, H. H. Hoffmann, M. Saeed, R. Dijkman, E. Steinmann, M. Wight-Carter, N. W. Hanners, S. P¨ohlmann, T. Gallagher, D. Todt, G. Zimmer, C. M. Rice, J. W. Schoggins, and V. Thiel, “LY6E impairs coronavirus fusion and confers immune control of viral disease,” bioRxiv, 2020. [Online]. Available: https://www.biorxiv.org/content/early/2020/03/07/2020.03.05.979260 [2] Y. h. Taguchi,Unsupervised festure extraction applied to bioinformatics:
PCA and TD based approach. Switzerland: Springer International, 2020.
[3] M. V. Kuleshov, M. R. Jones, A. D. Rouillard, N. F. Fernandez, Q. Duan, Z. Wang, S. Koplev, S. L. Jenkins, K. M. Jagodnik, A. Lachmann, M. G. McDermott, C. D. Monteiro, G. W. Gundersen, and A. Ma’ayan, “Enrichr: a comprehensive gene set enrichment analysis web server 2016 update,”Nucleic Acids Research, vol. 44, no. W1, pp. W90–W97, 05 2016. [Online]. Available: https://doi.org/10.1093/nar/gkw377 [4] Y. Zhou, B. Zhou, L. Pache, M. Chang, A. H. Khodabakhshi,
O. Tanaseichuk, C. Benner, and S. K. Chanda, “Metascape provides a biologist-oriented resource for the analysis of systems-level datasets,”
Nature Communications, vol. 10, no. 1, apr 2019. [Online]. Available: https://doi.org/10.1038/s41467-019-09234-6
[5] P. C. Woo, Y. Huang, S. K. Lau, H.-w. Tsoi, and K.-y. Yuen, “In silico analysis of orf1ab in coronavirus hku1 genome reveals a unique putative cleavage site of coronavirus hku1 3c-like protease,”
Microbiology and Immunology, vol. 49, no. 10, pp. 899–908, 2005. [On-line]. Available: https://onlinelibrary.wiley.com/doi/abs/10.1111/j.1348-0421.2005.tb03681.x
[6] M. Hoffmann, H. Kleine-Weber, S. Schroeder, N. Kr¨uger, T. Herrler, S. Erichsen, T. S. Schiergens, G. Herrler, N.-H. Wu, A. Nitsche, M. A. M¨uller, C. Drosten, and S. p¨ohlmann, “Sars-cov-2 cell entry depends on ace2 and tmprss2 and is blocked by a clinically proven protease inhibitor,” Cell, vol. 181, no. 2, pp. 271 – 280.e8, 2020. [Online]. Available: http://www.sciencedirect.com/science/article/pii/S0092867420302294 [7] S. Matsuyama, N. Nao, K. Shirato, M. Kawase, S. Saito, I. Takayama,
N. Nagata, T. Sekizuka, H. Katoh, F. Kato, M. Sakata, M. Tahara, S. Kutsuna, N. Ohmagari, M. Kuroda, T. Suzuki, T. Kageyama, and M. Takeda, “Enhanced isolation of sars-cov-2 by tmprss2-expressing cells,” Proceedings of the National Academy of Sciences, vol. 117, no. 13, pp. 7001–7003, 2020. [Online]. Available: https://www.pnas.org/content/117/13/7001
[8] T. H. Bugge, T. M. Antalis, and Q. Wu, “Type ii transmembrane serine proteases,” Journal of Biological Chemistry, vol. 284, no. 35, pp. 23 177–23 181, 2009. [Online]. Available: http://www.jbc.org/content/284/35/23177.abstract
[9] Y. h. Taguchi and T. Turki, “Neurological disorder drug discovery from gene expression with tensor decomposition,” Current Pharmaceutical Design, vol. 25, no. 43, pp. 4589–4599, 2019. [Online]. Available: http://www.eurekaselect.com/node/177329/article
[10] J. R. Burdick and D. P. Durand, “Primaquine diphosphate: Inhibition of newcastle disease virus replication,” Antimicrobial Agents and Chemotherapy, vol. 6, no. 4, pp. 460–464, 1974. [Online]. Available: https://aac.asm.org/content/6/4/460
[11] D. C. CULITA1, R. ALEXANDROVA, L. DYAKOVA, G. MARI-NESCU, L. PATRON, R. KALFIN, and M. ALEXANDROV, “Eval-uation of cytotoxic and antiproliferative activity of co(ii), ni(ii), cu(ii) and zn(ii) complexes with meloxicam on virus – transformed tumor cells daniela,”Revista de Chimie, vol. 63, no. 4, pp. 384–389, 2012. [12] H. E. Renis, “Antiviral activity of cytarabine in herpesvirus–infected
rats,” Antimicrobial Agents and Chemotherapy, vol. 4, no. 4, pp. 439–444, 1973. [Online]. Available: https://aac.asm.org/content/4/4/439 [13] K. Ueda, R. Kawabata, T. Irie, Y. Nakai, Y. Tohya, and T. Sakaguchi, “Inactivation of pathogenic viruses by plant-derived tannins: Strong effects of extracts from persimmon (diospyros kaki) on a broad range of viruses,”PLOS ONE, vol. 8, no. 1, pp. 1–10, 01 2013. [Online]. Available: https://doi.org/10.1371/journal.pone.0055343
[14] R. Li, R. Narita, R. Ouda, C. Kimura, H. Nishimura, M. Yatagai, T. Fujita, and T. Watanabe, “Structure-dependent antiviral activity of catechol derivatives in pyroligneous acid against the encephalomycarditis virus,” RSC Adv., vol. 8, pp. 35 888–35 896, 2018. [Online]. Available: http://dx.doi.org/10.1039/C8RA07096B [15] P. E. Lobert, D. Hober, A. S. Delannoy, and P. Wattr´e, “Evidence
that neomycin inhibits human cytomegalovirus infection of fibroblasts,”
Archives of Virology, vol. 141, no. 8, pp. 1453–1462, aug 1996. [Online]. Available: https://doi.org/10.1007/bf01718247
[16] H. M. Abuohashish, M. M. Ahmed, D. Sabry, M. M. Khattab, and S. S. Al-Rejaie, “Ace-2/ang1-7/mas cascade mediates ace inhibitor, captopril, protective effects in estrogen-deficient osteoporotic rats,” Biomedicine & Pharmacotherapy, vol. 92, pp. 58 – 68, 2017. [Online]. Available: http://www.sciencedirect.com/science/article/pii/S0753332217311873 [17] W. Cheng, C. Song, K. M. Anjum, M. Chen, D. Li, H. Zhou,
W. Wang, and J. Chen, “Coenzyme q plays opposing roles on bacteria/fungi and viruses in drosophila innate immunity,”International Journal of Immunogenetics, vol. 38, no. 4, pp. 331–337, 2011. [On-line]. Available: https://onlinelibrary.wiley.com/doi/abs/10.1111/j.1744-313X.2011.01012.x
[18] C. M. Finnegan and R. Blumenthal, “Fenretinide inhibits hiv infection by promoting viral endocytosis,” Antiviral Research, vol. 69, no. 2, pp. 116 – 123, 2006. [Online]. Available: http://www.sciencedirect.com/science/article/pii/S016635420500241X [19] C. Wu, Y. Liu, Y. Yang, P. Zhang, W. Zhong, Y. Wang,
Q. Wang, Y. Xu, M. Li, X. Li, M. Zheng, L. Chen, and H. Li, “Analysis of therapeutic targets for SARS-CoV-2 and discovery of potential drugs by computational methods,” Acta Pharmaceutica Sinica B, 2020. [Online]. Available: http://www.sciencedirect.com/science/article/pii/S2211383520302999 [20] L. Yi, Z. Li, K. Yuan, X. Qu, J. Chen, G. Wang, H. Zhang,
H. Luo, L. Zhu, P. Jiang, L. Chen, Y. Shen, M. Luo, G. Zuo, J. Hu, D. Duan, Y. Nie, X. Shi, W. Wang, Y. Han, T. Li, Y. Liu, M. Ding, H. Deng, and X. Xu, “Small molecules blocking the entry of severe acute respiratory syndrome coronavirus into host cells,” Journal of Virology, vol. 78, no. 20, pp. 11 334–11 339, 2004. [Online]. Available: https://jvi.asm.org/content/78/20/11334
[21] A. Ubani, F. Agwom, N. Y. Shehu, P. Luka, A. Umera, U. Umar, S. Omale, N. E. Nnadi, and J. C. Aguiyi, “Molecular docking analysis of some phytochemicals on two Sars-Cov-2 targets,” bioRxiv, 2020. [Online]. Available: https://www.biorxiv.org/content/early/2020/04/01/2020.03.31.017657 [22] C. L. Clouser, S. E. Patterson, and L. M. Mansky, “Exploiting drug
repositioning for discovery of a novel hiv combination therapy,”Journal of Virology, vol. 84, no. 18, pp. 9301–9309, 2010. [Online]. Available: https://jvi.asm.org/content/84/18/9301
[23] K. Fukano, S. Tsukuda, M. Oshima, R. Suzuki, H. Aizaki, M. Ohki, S.-Y. Park, M. Muramatsu, T. Wakita, C. Sureau, Y. Ogasawara, and K. Watashi, “Troglitazone impedes the oligomerization of sodium taurocholate cotransporting polypeptide and entry of hepatitis b virus into hepatocytes,” Frontiers in Microbiology, vol. 9, p. 3257, 2019. [Online]. Available: https://www.frontiersin.org/article/10.3389/fmicb.2018.03257
[24] O. D. Perez, G. P. Nolan, D. Magda, R. A. Miller, L. A. Herzenberg, and L. A. Herzenberg, “Motexafin gadolinium (gd-tex) selectively induces apoptosis in hiv-1 infected cd4+ t helper cells,”Proceedings of the National Academy of Sciences, vol. 99, no. 4, pp. 2270–2274, 2002. [Online]. Available: https://www.pnas.org/content/99/4/2270 [25] D. E. Gordon, G. M. Jang, M. Bouhaddou, J. Xu, K. Obernier, M. J.
O’Meara, J. Z. Guo, D. L. Swaney, T. A. Tummino, R. Huettenhain, R. M. Kaake, A. L. Richards, B. Tutuncuoglu, H. Foussard, J. Batra, K. Haas, M. Modak, M. Kim, P. Haas, B. J. Polacco, H. Braberg, J. M. Fabius, M. Eckhardt, M. Soucheray, M. J. Bennett, M. Cakir, M. J. McGregor, Q. Li, Z. Z. C. Naing, Y. Zhou, S. Peng, I. T. Kirby, J. E. Melnyk, J. S. Chorba, K. Lou, S. A. Dai, W. Shen, Y. Shi, Z. Zhang, I. Barrio-Hernandez, D. Memon, C. Hernandez-Armenta, C. J. Mathy, T. Perica, K. B. Pilla, S. J. Ganesan, D. J. Saltzberg, R. Ramachandran, X. Liu, S. B. Rosenthal, L. Calviello, S. Venkataramanan, J. Liboy-Lugo, Y. Lin, S. A. Wankowicz, M. Bohn, P. P. Sharp, R. Trenker, J. M. Young, D. A. Cavero, J. Hiatt, T. L. Roth, U. Rathore, A. Subramanian, J. Noack, M. Hubert, F. Roesch, T. Vallet, B. Meyer, K. M. White, L. Miorin, O. S. Rosenberg, K. A. Verba, D. Agard, M. Ott, M. Emerman, D. Ruggero, A. Garc´ıa-Sastre, N. Jura, M. von Zastrow, J. Taunton, A. Ashworth, O. Schwartz, M. Vignuzzi, C. d’Enfert, S. Mukherjee, M. Jacobson, H. S. Malik, D. G. Fujimori, T. Ideker, C. S. Craik, S. Floor, J. S. Fraser, J. Gross, A. Sali, T. Kortemme, P. Beltrao, K. Shokat, B. K. Shoichet, and N. J. Krogan, “A SARS-CoV-2-human protein-protein interaction map reveals drug targets and potential drug-repurposing,” bioRxiv, 2020. [Online]. Available: https://www.biorxiv.org/content/early/2020/03/27/2020.03.22.002386 [26] Y. Zhou, Y. Hou, J. Shen, Y. Huang, W. Martin, and F. Cheng,
Y-H. TAGUCHIreceived a B.S. degree in physics from the Tokyo Institute of Technology and a Ph.D. degree in physics from the Tokyo Institute of Tech-nology. He is currently a full professor with the Department of Physics, Chuo University, Japan. His works have been published in leading journals such as Physical Review Letters, Bioinformatics, and Sci-entific Reports. His research interests include bioin-formatics, machine learning, and nonlinear physics. He is also an editorial board member of Frontiers in Genetics:RNA, PloS ONE, BMC Medical Ge-nomics, Medicine (Lippincott Williams & Wilkins journal), BMC Research Notes, non-coding RNA (MDPI), and IPSJ Transaction on Bioinformatics.