3521
Environment Drivers Of DHF Disease In Jakarta
2017 – 2018
Margareta Maria Sintorini, Nurusysyarifah Aliyyah, Epi Ria Kristina Sinaga
Abstract: The purpose of this study was to identify the ecological factors underlying the increase of DHF (Dengue Hemorrhagic Fever), an endemic disease in Jakarta. The environmental pattern and social behavior are the main factors triggering the prevalence of this condition, reaching the morbidity rate of 50.75 in 2015. This study used the hypothesis test to identify the strongest correlation of environmental factors to the DHF cases. Importantly, the sample population involved 550 respondents from 2017 – 2018 at five regions in Jakarta. The environmental factors were used as independent variables and DHF cases as the outcome variable to build multivariate regression, while spatial analysis was performed to identify the local condition. Generally, the DHF Breeding Places might be decreased through community participation to control water places, the potentials for mosqui to breeding. The study indicates a significant relationship between rainfall (p: 0.003), local temperature (p: 0.006), humidity (p: 0.000), Aedes population (p: 0.002), community knowledge about DHF (p:0.008). Additionally, climatic factors and the local environmental condition such as rainfall, temperature, humidity, knowledge about DHF, human behavior, and Aedes population, are essential in explaining the link between the spread and the increase of DHF. From findings, the rule of Larvae Monitor, knowledge attitude, and practice (KAP), improvement of the health support system are essential.
Index Terms : Aedes population, environmental factors, Dengue Hemorrhagic Fever, knowledge of DHF —————————— ——————————
1.
INTRODUCTION
The increase in population has caused cases of communal diseases to be more prevalent across the world. In Indonesia, the claims of Dengue Hemorrhagic Fever first appeared in Surabaya in 1968 and recently, the country ranked second after Thailand. According to the Ministry of Health, the number of DHF morbidity in Surabaya continued to increase from 0.05 in 1968 to 35.19 in 1998. In 1968, there was a correlation between environmental changes and their prevalence. Furthermore, the morbidity rate continues to grow every year, raising even more concerns. For instance, in 2005 it was 43.31, a significant difference compared to the previous year where it was and 39.80 with a total of 100,347 cases [1]. The year 2014 recorded 71,668 dengue fever patients in 34 provinces in Indonesia, and 641 of them died. Moreover, several environmental factors with effects on the incidence of DHF encouraged the study to determine the aspects used as indicators in predicting the occurrence of the disorder and its transmission system [2]. The researchers intended to predict the incidence of DHF through intervention models on system dynamics [3]. This study therefore produces a dynamics model of DHF transmission with climate variability patterns which contribute to improvements in development on a local and national scale, especially in Jakarta.
2
RESEARCH
METHODOLOGI
This study includes ecological studies by using a hypothesis test. Modeling and simulation are carried out to identify the factors relevant to future DHF cases. The eminence of this study links environmental factors in ecology such as rainfall, temperature, and humidity as well as primary indicators of air quality, which is CO2, with vectors of DHF [2].
Study relating to the determination of the dynamics model to recognize early warning of the emergence of DHF cases started in 2006. It is expected that the patterns found are continued for a broader area, in Jakarta, Bogor, Depok, Tangerang, and Bekasi (Jabodetabek) [1]. The samples used include air quality, vector, case, example, and respondents. The air quality sample is taken from the research location while vector involves adult Aedes mosquitoes caught from the respondents' house. The case samples were experienced in the last two years. House sample is determined based on WHO standards for larvae and mosquito surveys according to the area and population "Cluster Design Sampling" [4]. The respondent sample is taken for the PSP study obtained based on calculations for a hypothesis test for two proportions. The minimum number of samples based on the prevalence of the disorder in the preliminary survey was 14%, while the incidence of control variables was 4%. The hypothesis test used a 5% confidence level and 90% test strength [5]. The distribution of the household sample was carried out by dividing the sample proportionally according to the number of cities in the Special Capital Region of Jakarta, including Central Jakarta, East Jakarta, South Jakarta, West Jakarta, and North Jakarta. In each region, a total of 40 houses were taken with individual analysis units [1].
The study was conducted in 2017-2018. Basically, the data was collected from the Special Capital Region of Jakarta, including rainfall, temperature, humidity, vector, and CO2 level
in the ambient air through direct measurements at the sampling point [6]. Temperature and humidity were measured using thermohydrometer, and CO2 level using RAC sampler.
The vector data collection of adult Aedes mosquitoes was carried out through purposive sampling in several households in each region [7]. To obtain the concept of DHF control in the future. The study employed two stages, which include (1) validation of environmental components and (2) report on comprehensive activities. In this study, the case of DHF is considered as one of the elements of the causal through intervention [3].
3.
RESULT
AND
DISCUSSIONS
The first year of the study was conducted in the Special ————————————————
Margareta Maria Sintorini is a lecturer of Environmental Engineering Department, Universitas Trisakti, Indonesia, PH+62813415143. E-mail: [email protected]
Nurusysyarifah Aliyyah is a lecturer of Environmental Health Study Program, Institut of Health Indonesia.
3522 Capital Region of Jakarta, which include the Central Jakarta
(Harapan Mulya Urban Village, Kemayoran Sub-district), East Jakarta (Malaka Jaya Urban Village, Duren Sawit Sub-district), South Jakarta (Lenteng Agung Urban Village, Jagakarsa Sub-district), West Jakarta (Tomang Urban Village, Grogol Petamburan Sub-district), and North Jakarta (Kelapa Gading Timur Urban Village, Kelapa Gading Sub-district). The collection of environmental and community data was carried out in the five regions from July 2017 to June 2018. Figure 1 shows the DHF Case Prediction. The climate variability patterns affect the incidence of DHF since the life of the disease vectors, and dengue virus as an agent is very dependent on environmental conditions [1].
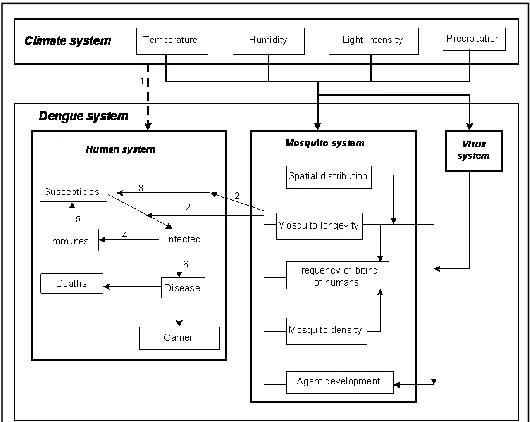
In general, temperature, humidity, air chemical composition, water chemical composition are the breeding places for mosquitoes, while rainfall, wind speed, and other environmental factors are the limiting factors of their life [4]. Therefore, the ecological system associated with the incidence of DHF has four subsystems, which include climate, Aedes mosquito, human, and DHF. These four subsystems are interconnected, and they influence each other [8]. Climate subsystem involves a series of climate factors related to global weather change, which triggers an increase in global temperature. As a result, the global warming phenomenon affects living things, and the most dominant insect causing DHF is Aedes aegypti. Importantly, CH4, N2O, CO2, and
CFC-11 cause the global climate change, commonly referred to us greenhouse effect if it exceeds average concentration. The increase in global temperatures upsurges Sea surface temperatures, encouraging the chances of El Nino [9]. According to the World Meteorological Organization (WMO), there is a relationship between the occurrence of El Nino and the incidence of DHF in Indonesia. This cycle forms the climate subsystem in the model [10]. The second subsystem is the Aedes mosquitoes, from eggs to adult, which is indicated by a positive arrow. The connecting factor of the climate and mosquito subsystem is the breeding places for mosquitoes which are profoundly affected by rainfall. In case rainfall is high, containers are easily filled with water, and a positive arrow indicates this relationship [11]. Another connecting
factor of the climate subsystem is the ambient temperature, which affects the Extrinsic Incubation Period (EIP). According to Matthew [5], EIP is influenced by environmental temperature, humidity, level of viremia in humans, and viral strains. Temperature increase shortens EIP and upsurge transmission. A hike to 34oC affects the temperature of the water in breeding places, which also accelerates the hatching of eggs into larvae [12]. Vector and disease subsystems are connected by Landing Rate and the role of dengue virus factors. The contact between mosquitoes and humans determines the presence of DHF. It is assumed that the larger the mosquito population, the higher the Landing Rate, and therefore, the connecting arrow becomes positive. The larger the Aedes mosquito population, the larger the infective Aedes populace carrying the Dengue virus. A positive arrow indicates this relationship [13]. After the Aedes mosquito bites a human, the virus replicates in the human body. The more viruses incubated into humans, the more infectious they become, increasing the number of DHF cases in the community. A positive arrow indicates this link. The intensity of petroleum fuels usage indicates human activity, while the impact of fuel utilization is the increase in CO2 emissions. Also, the Landing
Rate factor is related to the social subsystem through the individual activeness factor. The more inactive a person is, the more natural for mosquitoes to approach, especially during peak hours [14]. In this case, intervention in increasing the knowledge, attitudes, and behavior of the community is required. From the analysis, the factors which are significantly related to the occurrence of DHF in the community include knowledge, attitudes, and behavior factors. This program provides community awareness education [15]. The research on the first year had been conducted in the Special Capital Region of Jakarta (DKI Jakarta) area, in the Central Jakarta (Harapan Mulya Urban Village, Kemayoran Subdistrict), East Jakarta (Malaka Jaya Urban Village, Duren Sawit Subdistrict), South Jakarta (Lenteng Agung Urban Village, Jagakarsa Subdistrict), West Jakarta (Tomang Urban Village, Grogol Petamburan District), and North Jakarta (East Kelapa Gading Urban Village, Kelapa Gading Subdistrict). Environmental and community data collection about dengue fever was carried out in these five areas, starting July 2017 and continued to June 2018. Figure 2 shows the correlation DHF cases and Aedes population.
West East North South Central
Jakarta
7
6
5
4
3
2
1
0
DHF cases Aedes population Fig.1 The relation between environtment factor and DHF
3523
Environmental
The environmental data measurement was carried out simultaneously in the five research areas from July 2017 to June 2018. The environment data measured included CO2
concentration, temperature and humidity, and rainfall. From the data, the highest average environmental temperature in North Jakarta and the highest ecological humidity in West Jakarta.
TABLE 1
ENVIRONMENTAL TEMPERATURE (oC) IN JAKARTA
JULY 2017-JUNE 2018
Mon th
South East North West Centra l
Average 1 34.44 33.78 34.86 34.33 34.23 34.33 2 35.25 34.46 35.57 33.85 34.55 34.74 3 33.62 34.85 35.73 35.77 35.38 35.07 4 32.47 31.12 33.36 33.05 33.75 32.75 5 33.14 31.93 33.11 33.00 33.37 32.91 6 34.37 32.07 34.28 34.20 35.40 34.06 7 35.35 32.89 33.85 33.15 34.20 33.87 8 34.25 32.76 34.49 34.18 34.78 34.09 9 31.72 32.55 34.72 34.50 32.45 33.19 10 32.35 31.82 33.55 34.05 32.86 33.12 11 32.70 32.49 33.83 32.40 32.87 33.50 12 33.10 32.97 34.47 33.15 33.45 33.63
There was the graphic of temperature in Jakarta from July 2017-June 2018 (Fig. 3).
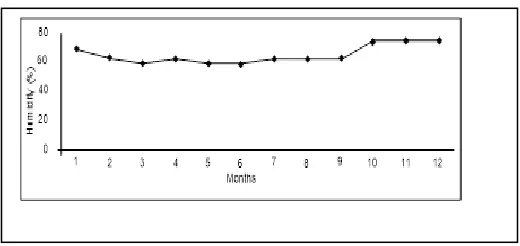
In Table 2, there was relative humidity in Jakarta during the research in July 2017 – June 2018. The highest humidity was in West Jakarta.
TABLE 2
HUMIDITY (%) IN JAKARTA JULY 2017-JUNE 2018
Mon th
South East North West Central Average 1 67.73 68.53 68.65 71.05 71.73 69.54 2 58.15 65.27 67.35 61.73 62.15 62.93 3 58.32 63.65 63.57 57.67 58.68 60.09 4 59.17 58.13 63.61 61.40 61.73 60.81 5 59.80 58.56 61.45 55.65 56.15 58.32 6 60.05 59.68 62.27 57.60 56.23 59.17 7
58.05 55.45 64.75 63.65 63.30 61.04 8 60.18 60.69 64.13 61.12 61.55 61.53 9 61.65 62.23 63.21 59.65 65.35 62.42 10 77.90 70.05 72.05 74.55 77.40 74.39 11 77.00 73.55 72.72 76.70 78.10 75.61 12 71.85 71.16 74.47 77.65 77.95 74.62
Figure 4 shows the graphic of outdoor humidity in all sampling location.
Disease vectors (such as DHF) are susceptible to climate factors, and their transmission increase with changes, especially in temperature, humidity, and rainfall. Shifts in rainfall patterns and temperatures affect the species in ecosystem groups, vector distribution patterns, and disease viruses in a different way concerning warm weather. The rate of spread of the virus increased in the transition season marked by high rainfall and air temperatures. Several studies show climate variability affects the transmission of Ae aegypti mosquito [5]. High temperatures reduce the time needed for the dengue virus to replicate and infect the Aedes mosquito. In case the mosquitoes become infectious agents, the potential to infect humans is enormous before the parasite dies. Furthermore, warmer air and water temperatures increase larval development, adult biting behavior, gonotrophic development, and extrinsic viral incubation period in mosquitoes [3]. Significant dengue outbreaks generally occur during warm, dry periods with extreme limited daily temperatures between 18°C and 32°C, the optimal range for the survival of mosquitoes and transmission of the virus. The increase in global surface temperature is indirectly affected by a surge in the concentration of greenhouse gases (one of which is CO2). The results also show that Ae. aegypti is
positively associated with high relative humidity. At less than 60% humidity, the mosquito's life is shorter, lessening the growth cycle [16]. Table 3. shows the data of CO2 concentration, and Figure 5 the graphic of CO2 concentration. These parameters need to explore because of the effect of CO2 made the climate became warmer, which it could be increase Extrinsic Incubation Periodic (EIP).
TABLE 3
THE CO2 CONCENTRATION IN JAKARTA JULY 2017-JUNE 2018
Mon th
South East North West Central Average 1 180.51 118.46 163.84 192.65 181.64 167.42 2 183.52 169.64 187.75 204.09 197.35 186.15 3 177.41 147.74 186.25 195.43 192.26 179.82 4 167.16 168.21 162.52 137.47 152.61 157.59 5 119.21 76.44 102.52 87.65 131.33 103.43 6 52.36 85.92 97.36 155.52 67.05 91.64 7 137.90 123.66 187.54 149.59 179.31 155.60 8 133.63 145.16 170.02 176.36 172.35 159.50 9 135.58 137.11 169.50 160.89 163.45 153.31 10 140.04 137.83 176.11 168.00 162.86 156.97 11 124.91 125.70 170.61 160.91 158.64 148.15 12 136.36 159.51 117.17 168.01 146.62 145.53 Fig 3. Temperaturein Jakarta July 2017-June 2018
3524 The use of petroleum fuels indicates the extent of human
activities. CO2 emissions increase the impact of using this fuel;
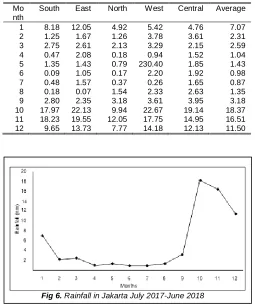
a positive arrow illustrates the relationship. Landing Rate Factors are also related to human subsystems through individual activeness factors. The more inactive someone is, the easier it is for mosquitoes to approach, especially during peak hours of biting. In this case, an intervention is needed to improve the knowledge, attitudes, and behavior of the community. From the analysis, the factors which are significantly related to the occurrence of DHF in the community include knowledge, attitudes, and behavior. This program provides the community awareness education needed. Table 4 shows rainfall in all sampling location during the research, and Figure 6 shows the graphic. There was increased rainfall in the tenth month.
TABLE 4
RAINFALL IN JAKARTA JULY 2017-JUNE 2018
Mo nth
South East North West Central Average 1 8.18 12.05 4.92 5.42 4.76 7.07 2 1.25 1.67 1.26 3.78 3.61 2.31 3 2.75 2.61 2.13 3.29 2.15 2.59 4 0.47 2.08 0.18 0.94 1.52 1.04 5 1.35 1.43 0.79 230.40 1.85 1.43 6 0.09 1.05 0.17 2.20 1.92 0.98 7 0.48 1.57 0.37 0.26 1.65 0.87 8 0.18 0.07 1.54 2.33 2.63 1.35 9 2.80 2.35 3.18 3.61 3.95 3.18 10 17.97 22.13 9.94 22.67 19.14 18.37 11 18.23 19.55 12.05 17.75 14.95 16.51 12 9.65 13.73 7.77 14.18 12.13 11.50
To ripen the eggs, the mosquito search for human, increasing the tendency to bite. However, in case the Aedes mosquito
carries the dengue virus and bites humans, the infection moves and causes dengue disease [17]. Therefore, high rainfall followed by an increase in the mosquito population, and the breeding places increase the Dengue cases in the community.
Figure 7. shows the correlation between DHF cases, Temperature, humidity, Light Intensity, and CO2 concentration. There was a positive correlation in all those parameters.
4.
CONCLUSION
From the finding and discussion, there is a significant relationship between the total of DHF cases (p: 0.008) and rainfall (p: 0.003), temperature (p: 0.006), humidity (p: 0.000). The climate factor which influences the population Aedes included rainfall, temperature, relative humidity. Furthermore, the total DHF cases have a significant relationship with the Aedes population (p: 0.002). DHF disease shows the intervention program has a considerable influence in decreasing the breeding places. The DHF cases in the community were to joint with Larvae Monitor.
ACKNOWLEDGMENT
This research was supported by Ministry of Research and Technology in the scheme of Leading Applied Research 2017 – 2020. Number of contracts: NKB-1709/UN2.R3.1/HKP.05.00/2019
REFERENCES
[1] Sintorini, Margareta Maria. 2007. The Impact of Climate on Dengue Hemorrhaghic Fever Cases. Kesmas National Public Health Journal, Vol. 12 No.1 August 2007
[2] Chowell G, et al. (2011). The influence of geographic and climate factors on the timing of dengue epidemics in Peru, 1994–2008. United Kingdom. BMC Infect Dis 11: 164. [3] Kensuke, Goto, et al. (2013). Analysis of effects of
meteorological factors on dengue incidence in Sri Lanka using time series data. PLoS One. May 2013 | Volume 8 | Issue 5 | e63717.
[4] Thomas, S J., Rothman, AL., Srikiatkhachorn, A. ,
Siripen Kalayanarooj. (2012) ―Global Strategy for Dengue Prevention and Control, 2012 – 2020‖ ISBN: 9789241504034,
Fig 5. The CO2 concentration in Jakarta July 2017-June 2018
Fig 6. Rainfall in Jakarta July 2017-June 2018
3525 WHO reference number: WHO/HTM/NTD/VEM/2012.5
https://www.who.int/denguecontrol/resources/978924150 4034/en/
[5] Matthew, D. (2014). Intra and Interseasonal Autoregressive Prediction of Dengue Outbreaks Using Local Weather and regional climate for a tropical environment in Colombia. Am. J. Trop. Med. Hyg., 91(3), 2014, pp. 598–610.
[6] IPCC working group II. 2007.Regional Vulnerable Impacts, adaptation and Vulnerability. IPCC fourth assessment reports
[7] Hayden M.H., et al. (2010). Microclimate and human factors in the divergent ecology of Aedes aegypti along the Arizona, US/Sonora, MX Border. Eco Health 7: 64–77 [8] Sankhadeep Chatterjee, Nilanjan Dey, Fuqian Shi, Amira S. Ashour, Simon James Fong, Soumya Sen (2017). ―Clinical application of modified bag-of-features coupled with hybrid neural-based classifier in dengue fever classification using gene expression data‖. 11 Sept 2017.
https://link.springer.com/article/10.1007/s11517-017-1722-y
[9] World Health Organization. (2019) ―Dengue and Severe Dengue‖ 15 April 2019.
https://www.who.int/news-room/fact-sheets/detail/dengue- and-severe-dengue [10] WHO and Pan American Health Organization (2019). ―Epidemiological Update Dengue, 22 Feb 2019‖
https://www.paho.org/hq/index.php?option=com_docman
&view=download&category_slug=dengue- 2217&alias=47782-22-february-2019-dengue-epidemiological-update&Itemid=270&lang=en
[11] Vector Borne Disease Control Programme Department of Public
Health Ministry of Health and Sports The Republic of the Union of
Myanmar June, 2018 ―National Guideline for Clinical Management of
Dengue‖
Downloads/National%20Guideline%20for%20Clinical%20 Management%20of%20Dengue%20(Version%2001).pdf [12] World Health Organization, (2016) ―Dengue and Dengue Haemorrhagic Fever‖ Dengue Bulletin - World Health Organization.
Volume 39, December 2011 apps.searo.who.int/PDS_DOCS/B5318.pdf
[13] World Health Organization, (2017), ―WHO handbook for dengue
outbreak contingency planning‖ http://www.who.int/denguecontrol/en/
[14] Ahmad, Mohd Hanief, Ibrahim, Mohd Ismail, Mohamed, Z.,
Nabilah Ismail. Muhammad Amiruddin Abdullah. Rafidah Hanim Shueb and Mohd Nazri Shafei. (2018)
―The Sensitivity, Specificity and Accuracy of Warning Signs in Predicting Severe Dengue, the Severe Dengue Prevalence and Its Associated Factors‖ Int. J. Environ. Res. Public Health 2018, 15, 2018; doi:10.3390/ijerph15092018
https://www.mdpi.com/journal/ijerph
[15] World Health Organization. (2019) ―Dengue virus infection:
Clinical manifestations and diagnosis‖.
https://www.uptodate.com/contents/dengue-virus-infection-clinical-manifestations-and-diagnosis/print
[16] Ministry of Health Malaysia and Academy of Medicine Malaysia,
Clinical Practice Guidelines, MOH/P/PAK/209.10 (GU) ―Management
of Dengue Infection in Adults‖ (Revised 2 nd Edition), 2014
Electronic version available on the following websites: http://www.moh.gov.my http://www.acadmed.org.my [17] Thomas, S J., Rothman, AL., Srikiatkhachorn, A. ,
Siripen Kalayanarooj, (2019). ―Dengue Virus Infection: Prevention
and Treatment‖.
https://www.uptodate.com/contents/dengue-virus-infection-prevention-and-treatment