University of South Carolina
Scholar Commons
Theses and Dissertations
2017
Mast Cells and Lipid Cross-Talk in Skin
Inflammation
Piper Alexandra Wedman
University of South Carolina
Follow this and additional works at:https://scholarcommons.sc.edu/etd Part of theMedical Sciences Commons
This Open Access Dissertation is brought to you by Scholar Commons. It has been accepted for inclusion in Theses and Dissertations by an authorized administrator of Scholar Commons. For more information, please [email protected].
Recommended Citation
Wedman, P. A.(2017).Mast Cells and Lipid Cross-Talk in Skin Inflammation.(Doctoral dissertation). Retrieved from
Mast Cells and Lipid Cross-Talk in Skin Inflammation
By
PIPER ALEXANDRA WEDMAN
Bachelor of Science
Metropolitan State College of Denver, 2011
Submitted in Partial Fulfillment of the Requirements
For the Degree of Doctor of Philosophy in
Biomedical Science
School of Medicine
University of South Carolina
2017
Accepted by:
Carole Oskeritzian, Major Professor
Mitzi Nagarkatti, Chair, Examining Committee
Gregorio Gomez, Committee Member
Joseph Janicki, Committee Member
Angela Murphy, Committee Member
Maria Marjorette Peña, Committee Member
DEDICATION
I was 21 when I met my husband, Scott, and decided to return to high
school to complete the 15 English credits needed to earn my high school
diploma. I graduated that spring and started college Fall 2006. The reason was
simple, I wanted to return to school to ensure my kids would have a good future.
From the beginning, Scott has been supportive of my decisions and helped me
raise our kids while I attended school. I dedicate this work to them, my family,
ACKNOWLEDGEMENTS
There are so many people who have been there for me throughout this
journey…
Dr. Carole, thank you for giving me the honor of working with you. You
have both challenged me and supported me and because of that I have grown in
ways I didn’t think possible! Alena, your friendship and coffee breaks made all
the difficult days easier. Ahmed, thank you for your happiness and positivity. Dr.
John, thank you for your expertise and your stories. My committee members, Dr.
Nagarkatti, Dr. Murphy, Dr. Gomez, Dr. Peña and Dr. Janicki, thank you for your
time and commitment to me throughout the years! To all the people in the PMI
department, your willingness to help was always appreciated!
Scott, thank you for believing in me when I didn’t believe in myself.
Without you, this path would have been even more challenging! Korbin and Kyra,
thank you for loving me unconditionally! Mom, thanks for making time to visit the
kids and I each year. Your love and guidance encouraged me to reach for the
stars! Alia and Brady, thank you for always listening to me and for helping me
weigh the pros and cons when I can’t make decisions. The rest of my family and
friends, thank you for your time and laughter. I love you all!
This work was supported by NIH/NIAID R01 AI095494 and NIH/NIAMS
ABSTRACT
Atopic dermatitis (AD) is an inflammatory skin disease whose pathogenic
mechanisms remain unclear. Using a validated human AD-like mouse model, we
observed that skin remodeling started at a pre-symptomatic stage of AD that
included cellular infiltration of the hypodermis, accompanied with
activated/degranulated mast cells (MC). Local MC activation was quantified using
a novel method of computer-assisted image analysis we developed and reported.
Using a variation of this method, we defined morphometric parameters allowing
for quantitation rather than scoring of cellular infiltration. Cell recruitment
correlated with MC activation, chemokine production and increased levels of
sphingolipid sphingosine-1-phosphate (S1P), produced by sphingosine kinase-1
(SphK1). MC or SphK1 deficiency significantly hindered early AD inflammation.
Chronic AD features skin barrier dysfunction leading to skin lesions due to
decreased lipid ceramide (CER) content. Interestingly, local CER species C16
and C24 were significantly increased in pre-symptomatic AD. Accordingly, skin
CER synthase (CerS, CER synthesis) CerS4, 5 and 6 mRNA mRNA levels were
statistically augmented. Because of the overall proapoptotic functions of CER, we
next measured local cleaved/activated caspase 3 levels, the executioner
caspase in apoptosis. Skin cleaved caspase 3/apoptosis was significantly
ER stress-induced apoptosis, CER profiling was similarly conducted in treated
skin samples collected from MC-deficient mice. MC deficiency prevented CER
increase and local apoptosis that were restored following MC reconstitution.
Epigenetic regulation of the molecular pathways that drive AD is unknown.
We identified and validated a microRNA triad 34a-485-486 whose
downregulation promoted the AD-related pathogenic pathways we have
unraveled.
We conclude that MC may initiate AD by driving early skin remodeling and
cell recruitment through local chemokine and S1P production and CER-elicited
apoptosis. Moreover, the down-regulation of a miRNA triad de-represses these
key players of AD pathogenesis. Targeting these pre-symptomatic effector
mechanisms may offer new prophylactic strategies for AD whose treatment
TABLE OF CONTENTS
DEDICATION ... iii
ACKNOWLEDGEMENTS ... iv
ABSTRACT ... v
LIST OF TABLES ... ix
LIST OF FIGURES ... x
LIST OF ABBREVIATIONS ...xii
FOREWORD ... 1
CHAPTER 1:INTRODUCTION ... 5
1.1 MAST CELLS AND SPHINGOSINE-1-PHOSPHATE IN EARLY ALLERGIC LUNG INFLAMMATION ... 5
1.2ATOPIC DERMATITIS ... 6
1.3STATEMENT OF HYPOTHESIS AND AIMS ... 8
CHAPTER 2: ANEW IMAGE ANALYSIS METHOD BASED ON MORPHOMETRIC AND FRACTAL PARAMETERS FOR RAPID EVALUATION OF IN SITU MAMMALIAN MAST CELL STATUS ... 10
2.1INTRODUCTION... 10
2.2MATERIALS AND METHODS ... 12
2.3RESULTS ... 18
CHAPTER 3: MAST CELLS AND SPHINGOSINE-1-PHOSPHATE UNDERLIE EARLY
PATHOGENIC REMODELING IN PRE-LESIONAL ECZEMA ... 34
3.1INTRODUCTION... 34
3.2MATERIALS AND METHODS ... 36
3.3RESULTS AND DISCUSSION ... 43
CHAPTER 4: AMAST CELL-MEDIATED ELEVATION OF CERAMIDES TRIGGERS APOPTOSIS IN PRE-LESIONAL ATOPIC DERMATITIS ... 62
4.1INTRODUCTION... 62
4.2MATERIALS AND METHODS ... 64
4.3RESULTS ... 67
4.4DISCUSSION ... 70
CHAPTER 5:AMIRNATRIAD EPIGENETICALLY REGULATES ADPATHOGENESIS ... 80
5.1INTRODUCTION... 80
5.2MATERIALS AND METHODS ... 82
5.3RESULTS ... 83
5.4DISCUSSION AND FUTURE DIRECTIONS ... 85
CHAPTER 6:SUMMARY AND CONCLUSIONS ... 91
6.1MOLECULAR MECHANISMS UNDERLYING EARLY SKIN REMODELING AT THE ONSET OF ATOPIC DERMATITIS ... 91
6.2SPHINGOSINE-1-PHOSPHATE AND MAST CELLS CONTRIBUTE TO SKIN INFLAMMATION IN EARLY-PHASE ATOPIC DERMATITIS ... 91
6.3OVATRIGGERS MC-RELATED PRODUCTION OF PRO-APOPTOTIC CERAMIDES AT ATOPIC DERMATITIS ONSET ... 93
6.4DOWN-REGULATION OF MIRNA34A,485AND 486REGULATES AD PATHOGENESIS ... 94
REFERENCES ... 97
LIST OF TABLES
Table 3.1 Mouse primer sequences used for qPCR in AD experiments ... 61
Table 4.1 Mouse primer sequences used for qPCR in CER experiments ... 79
LIST OF FIGURES
Figure 2.1 Methylene-blue stained mouse skin for MC detection and analysis ... 30
Figure 2.2 Mass descriptors distinguish intact from degranulated MC ... 31
Figure 2.3 Fractal dimension (D) independently validates definitions of intact vs. degranulated MC ... 32
Figure 2.4 D of degranulated MC is higher than D of intact MC ... 33
Figure 3.1 Skin remodeling starts after a single epicutaneous (EC) exposure to OVA ... 52
Figure 3.2 Chemokines are up-regulated after a single exposure to OVA ... 54
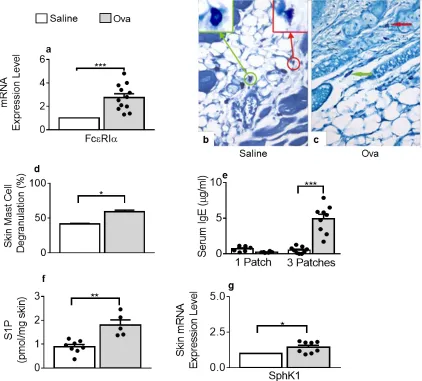
Figure 3.3 Mast cells degranulation and S1P levels increase in OVA-treated skin tissues ... 55
Figure 3.4 Skin remodeling and chemokine expression are mitigated in mice deficient for SphK1 or mast cells: S1P-mediated skin mast cell degranulation and mast cell-dependent local S1P production ... 57
Figure 3.5 Cellular infiltration, mast cell degranulation and S1P increase are abated in mouse back skins exposed to LPS-free OVA ... 59
Figure 4.1 Skin exposure to OVA leads to increased ceramides in WT mice ... 74
Figure 4.2 Increased cleaved Caspase 3 is observed following OVA exposure . 75
Figure 4.3 OVA treatment leads to endoplasmic reticulum stress-induced apoptosis ... 76
Figure 4.4 Ceramides, mRNA coding for genes involved in ceramide production
remain unaltered and apoptosis undetectable upon OVA treatment of KitW-sh/W-sh
MC-deficient mice ... 77
Figure 4.5 In vitro S1P stimulation triggers ceramide generation in BMMC ... 78
Figure 5.2 A newly identified AD-associated microRNA signature is also relevant to AD pathogenesis with validated target gene de-repression ... 89
LIST OF ABBREVIATIONS
A ... Area
AD ... Atopic Dermatitis
Ag ... Antigen
ATF4 ... Activating Transcription Factor 4
BiP ... Binding Immunoglobulin Protein
BMMC ... Bone Marrow-Derived Mast Cells
Bv ... Blood Vessel
C ... Carbon
Casp3 ... Caspase 3
CER ... Ceramides
CerS ...Ceramide Synthase
CHOP ... CCAAT-Enhancer-Binding Protein Homologous Protein
CS ... Chondroitin Sulfate
CTLA-4 ... Cytotoxic T Lymphocyte–Associated Antigen 4
CTMC ... Connective Tissue Mast Cells
D ... Fractal Dimension
DNP ... Dinitrophenol
EC ... Epicutaneous
ER ... Endoplasmic Reticulum
FcεRIα... High-Affinity IgE Receptor
GAPDH ... Glyceraldehyde 3-Phosphate Dehydrogenase
GV ... Pixel Gray Value
H&E ... Hematoxylin and Eosin
H(GV) ... Gray Level Histogram
HSA ... Human Serum Albumin
HSI ... Hue, Saturation, Intensity
HPF ... High Power Field
IgE ... Immunoglobulin E
IOD ... Integrative Optical Density
LPS ... Lipopolysaccharide
MB ... Methylene Blue
MC ... Mast Cells
MCP-1, CCL2... Monocyte Chemoattractant Protein 1
MIP-1α, CCL3 ... Macrophage Inflammatory Protein 1α
MMC ... Mucosal Mast Cells
OVA ... Ovalbumin
PSA ... Passive Systemic Anaphylaxis
PVDF ... Polyvinylidene Difluoride
RANTES, CCL5...Regulated on Activation, Normal T-Cell Expressed and Secreted
ROI ... Regions of Interest
S1P ... Sphingosine-1-Phosphate
S1PR ... Sphingosine-1-Phosphate Receptor
SC ... Stratum Corneum
SCF ... Stem Cell Factor
SphK ... Sphingosine Kinase
UPR ... Unfolded Protein Response
WT ... Wild-Type
F
OREWORDMast cells are immune cells of hematopoietic lineage. Differentiation and
maturation of MC occurs as they reach the vascularized tissues where they will
reside (Kitamura, 1989). MC exist as two distinct subsets, distinguishable by the
protease composition of secretory granules. In humans, MCTC contain tryptase,
chymase, and other proteases, while MCT contain only tryptase (Oskeritzian et
al., 2005). MCTC (equivalent to connective tissue MC, CTMC) are located in the
skin, heart, muscle, and submucosa of the small intestines while MCT (equivalent
to mucosal MC, MMC) are localized to airway epithelia and small intestine
mucosa (Schwartz, 2005).
MC, uniquely identified by dual expression of c-kit, stem cell factor (SCF)
receptor, and high affinity immunoglobulin (Ig) E receptor (FcεRI), are key
effector cells of IgE-mediated immune responses, including allergic diseases.
IgE-dependent MC activation occurs following antigen (Ag) cross-linking of
surface-bound IgE, triggering the release of many mediators. Some mediators,
such as vasoactive amines (e.g. histamine), neutral proteases (e.g. tryptases and
chymases), proteoglycans (e.g. heparin)some cytokines and growth factors and
sphingolipid S1P are pre-stored within MC and released immediately upon
activation, while prostaglandins, leukotrienes and other pro-inflammatory lipid
growth factors, cytokines, and chemokines in response to various stimuli in a
tissue and/or species-dependent manner (Galli et al., 2015).
Human MC and mouse bone marrow-derived MC (BMMC)are important
tools for analyzing MC responses in vitro. Primary MC can be isolated from
tissues and expanded ex vivoin the presence of MC-specific growth factors,
which include SCF (and interleukin (IL)-3 for mouse MC). In addition, MC lines
are available. The most common MC lines are rat basophilic leukemia (RBL)-2H3
cells, human HMC-1 and LAD2 cells, derived from patients with MC leukemia
(Butterfield et al., 1988; Kirshenbaum et al., 2003), and commercially available
LUVA cells, that spontaneously developed from human blood CD34+ cells
(Laidlaw et al., 2011). While convenient, cell lines present transformed
phenotypes with constitutively activated signaling pathways, making primary cells
preferable for studying MC functions in vitro.
MC-deficient mice have proven useful for studying the relevance of MC in
health and disease. Kit, receptor for stem cell factor (SCF, previously called MC
growth factor), is expressed on all hematopoietic stem cells. While most cells
gradually lose Kit expression as they mature, MC remain Kit+. Kit W/W-v and Kit
W-sh/W-sh MC-deficient mice feature c-kit mutations. Kit W-sh/W-sh mice present fewer
abnormalities than Kit W/W-v mice, which are anemic and difficult to breed. In
addition, Kit W/W-v mice display other phenotypic abnormalities including
decreased numbers of TCRγδ and spontaneous dermatitis, thus Kit W-sh/W-sh mice
are preferred (Grimbaldeston et al., 2005). Nonetheless, mutations in Kit may
alternative MC-deficient mice were generated, in which Cre recombinase (Cre) is
expressed under the control of “MC-restricted” promoters. The mast cell protease
(Mcpt) 5-Cre; R-DTA mice feature diphtheria toxin alpha (DTA)-induced deletion
of CTMC only and have an otherwise normal immune system (Dudeck et al.,
2011). Cpa3Cre/+, or “Cre-Master”, mice display a carboxypeptidase A3
(Cpa3)-directed activation of Cre, which results in eradication of all MC, but also affects
some T cell populations and basophils (Feyerabend et al., 2011).
Cpa3-Cre;Mcl-1fl/fl, affectionately called “Hello Kitty” mice by Dr. Steve Galli who generated
them, are similar to the Cpa3Cre/+strain as constitutive reduction in all MC is
observed with concomitant depletion of basophils (Lilla et al., 2011). Perhaps
more clinically relevant than MC-deficient models, another approach has been to
induce MCablation when desired. To this end, Mcpt5-Cre;iDTR mice (Dudeck et
al., 2011), “Mas-TRECK mice (Otsuka et al., 2011; Sawaguchi et al., 2012), and
Cpa3-Cre;iDTR mice (Reber et al., 2014) are all inducible models of MC
depletion (Galli et al., 2015). To confirm the importance of MC to a specific
disease state, MC-deficient mice can be conveniently reconstituted through
adoptive transfer of BMMC from WT or knockout mice of similar C57Bl/6 genetic
background.
Sphingosine-1-phosphate (S1P) is a potent sphingolipid metabolite
important for cell trafficking, proliferation and survival responses. The pleiotropic
properties of S1P can be attributed to the fact that S1P can bind to 5 specific G
various combinations by a variety of different cell types, including T and B cell
lymphocytes, dendritic cells and mast cells (Spiegel and Milstien, 2011).
MC can produce S1P both constitutively and upon IgE/Ag activation,
which concomitantly activates SphK (Oskeritzian et al., 2008) that phosphorylate
sphingosine to produce S1P. The two isoforms of SphK have distinct functions in
MC. SphK2 is most important for production of S1P in the nucleus and other
subcellular compartments, while SphK1-derived S1P may be transported outside
of the cell to ligate cell surface S1PR in an autocrine and/or paracrine manner
(Mitra et al., 2006; Oskeritzian et al., 2008). MC express S1PR1, which plays a
role in immune cell trafficking and migration, and S1PR2, which stops movement
mediated by S1PR1 and triggers release of MC granules (Jolly et al., 2004;
C
HAPTER1:
I
NTRODUCTION1.1
M
ASTC
ELLS ANDS
PHINGOSINE-1-P
HOSPHATEI
NE
ARLYA
LLERGICL
UNGI
NFLAMMATIONWe recently demonstrated the importance of MC/S1P signaling, through
S1PR2, for early T cell recruitment to inflamed lungs in a model of passive
systemic anaphylaxis (PSA) (Oskeritzian et al., 2015). Mice were passively
sensitized with IgE anti-2,4-dinitrophenyl (DNP) and later challenged with antigen
(Ag) DNP-human serum albumin (DNP-HSA). We found that the neutralization of
extracellular S1P with a specific anti-S1P mAb (SphingomabTM), prior to Ag
challenge, resulted in significantly decreased levels of circulating histamine,
monocyte chemoattractant protein 1 (MCP-1)/CCL2), macrophage inflammatory
protein 1α (MIP-1α)/CCL3 and RANTES/CCL5 compared to an isotype-matched
negative control Ab. We established that these chemokines were important for
CD3+ T cell recruitment. Moreover, we identified MC as a local source of CCL2
and CCL5. Significantly reduced levels of circulating chemokines were detected
in MC-deficient Kit W-sh/W-sh mice following Ag challenge, compared to WT
controls. Furthermore, when MC-deficient mice were reconstituted with MC by
adoptive transfer of BMMC, production of circulating chemokines observed in WT
mice was restored. Following Ag challenge, Sphingomab recipients and
indicative of anaphylaxis and early pulmonary edema observed in isotype or WT
controls. These results highlighted MC/S1P axis as a major contributor of tissue
remodeling during the early phase of allergic responses in the lungs and were
publicized as the Editor’s Choice of The Journal of Allergy and Clinical
Immunology and again as a part of the “Advances and highlights in mechanisms
of allergic disease in 2015” (Wawrzyniak et al., 2016).
1.2
A
TOPICD
ERMATITISAtopic dermatitis (AD) is a recurring inflammatory skin disease which
affects 10-25% of individuals residing in developed countries. Primarily starting in
early childhood, 85% of patients experience onset of symptoms prior to age 5.
Individuals affected with AD often develop other allergic disorders, such as
asthma, food allergies or rhinitis later in life, making it the first manifestation of
allergies in what has become known as the atopic march. AD occurrence has
increased in recent years, but is less prevalent in rural areas supporting the
“hygiene hypothesis” which states that early exposure to infectious agents aids
immune system development and decreases susceptibility to allergic (and
autoimmune) disease (Bieber, 2010).
AD pathogenesis has been attributed to Ag penetration through a
compromised barrier, which triggers activation of skin resident cells and release
of many pro-inflammatory mediators, leading to severe itchiness, dry-flaky skin
and lesions. AD skin displays thickening of the epidermis and dermis layers
accompanied by accumulation of immune cells (Bieber, 2010; Yoon et al., 2016),
et al., 2013; Werfel et al., 2016). Molecularly, inflammatory pathways of AD are
biphasic. The acute phase is thought to be driven by Th2 cells whereas Th1
immune responses dominate chronic lesions (Bieber, 2010). Observations of
chronic inflammation associated with AD has prompted many studies, resulting in
suggested potential targets for therapeutic intervention, including cytokines and
chemokines present once the disease has developed. Available treatment
options, for moderate to severe AD, consist in symptom management with
undesirable side effects such as diabetes, hypertension, gastric ulcers,
osteoporosis, glaucoma, growth retardation, renal toxicity, liver dysfunction and
leukopenia (Simon and Bieber, 2014).
For mild AD, moisturizers can contribute to restoration of the skin barrier.
Many of these topical skin care products feature addition of the sphingolipid
ceramide (CER), critical for maintaining barrier functions in healthy individuals.
AD patients present a loss of very long chain ceramides that compose the
stratum corneum (SC) layer of epidermis. It has been thought that adding
ceramides to moisturizer would positively affect SC structure and lipid
organization. However, a recent study, comparing efficacy of ceramide-rich
moisturizer on AD patients, found no significant difference in disease severity
when compared with other moisturizing products (Miller et al., 2011).
Inflammation results from the coordinated actions of diverse molecular
pathways driving a variety of altered gene and protein expression. The discovery
of miRNA, small noncoding molecules that control translation of target mRNA
prompted new lines of research to better understand AD etiology (Plank et al.,
2013). Sonkoly et al. were the first to conduct a genome-wide analysis of miRNA
expression in human biopsies of healthy, psoriatic and AD skin samples but were
ultimately unable to define an AD-specific signature (Sonkoly et al., 2007). In a
later study, they linked overexpression of miR-155, which targets cytotoxic T
lymphocyte–associated antigen 4 (CTLA-4), to increased proliferation of TH cells
in AD (Sonkoly et al., 2010). More recently, Rebane et al. reported that miRNA
146a is upregulated in keratinocytes from chronic lesions of AD patients,
contributing to suppression of innate immune responses (Rebane et al., 2014).
However, there is no study defining the miRNA signature of AD pathogenesis.
1.3
S
TATEMENT OFH
YPOTHESIS ANDA
IMSAllergenic stimulation releases the multifaceted sphingolipid S1P from
tissue-resident MC (Mitra et al., 2006; Oskeritzian et al., 2008; Oskeritzian et al.,
2010). Our most recent studies revealed that S1P serves to further propagate
inflammatory responses through autocrine/paracrine stimulation of MC, creating
an inflammatory amplification loop, which we have shown is essential to the
onset of acute pulmonary inflammation As MC are present in normal skin at
homeostasis and they become more numerous and activated in inflamed skin
(Bieber, 2010; Liu et al., 2011), we suggest a similar critical role for MC and S1P
in the onset and progression of skin inflammation. We are proposing to establish
the contribution of MC in diseased mouse skin samples, compared to healthy
skins, at the initiation of AD. We anticipate an early-defined MC-driven molecular
strategies to prevent further disease development. Next, we propose local S1P
plays a key role in inflammatory cell recruitment through its stimulatory effects on
MC degranulation, likely propagating inflammation. Moreover, since AD is
associated with loss of skin barrier functions and because lesional skin of AD
patients displays decreased ceramide content, we will investigate changes in
CER levels at early-phase skin inflammation, a time-point which may be more
receptive to repair strategies. As little is known pertaining to the epigenetic
regulation of AD by miRNAs, we also propose to investigate miRNA expression
during AD pathogenesis.
For this study, we designed the following aims:
• Aim 1: Establish the molecular mechanisms underlying early skin
remodeling at the onset of AD
• Aim 2: Examine how S1P and MC contribute to skin inflammation in
early-phase AD
• Aim 3: Investigate ceramide species at the initiation of AD
• Aim 4: Define the regulatory function of miRNA in AD development and
progression
To study the direct implication of MC during AD inception, we first developed a
C
HAPTER2: A
N
EWI
MAGEA
NALYSISM
ETHODB
ASED ONM
ORPHOMETRICAND
F
RACTALP
ARAMETERS FORR
APIDE
VALUATION OFI
NS
ITUM
AMMALIANM
ASTC
ELLS
TATUS12.1
I
NTRODUCTIONMast cells (MC) are long-lived tissue-dwelling cells, found in all
vascularized tissues at homeostasis, especially at the host/environment
interfaces, including skin, airways and the gastrointestinal and genitourinary
tracts (Galli et al., 2011). There is mounting evidence that MC manifest
substantial immunomodulatory functions in many physiological processes
through the vast repertoire of mediators they release upon activation (Galli et al.,
2011; Oskeritzian, 2015). Degranulation represents the canonical process
through which activated MC secrete mediators (Wernersson and Pejler, 2014). It
refers to rapid exocytosis of granules that occupy about 80% of MC cytoplasm
and harbor a wide array of preformed bio-active substances (Galli and Tsai,
2012; Moon et al., 2014). A spectrum of receptor-dependent and independent
stimuli can activate MC, including physical and mechanical triggers, and the
1 Wedman, P., A. Aladhami, M. Beste, M.K. Edwards, A. Chumanevich, J.W. Fuseler, and
subsequent secretion of histamine, proteases, lipid mediators, cytokines, and
chemokines (da Silva et al., 2014). To date, investigators are taking advantage of
MC cytoplasm replete withgranules as intragranular proteoglycans interact with
metachromatic dyes such as methylene blue (MB) to allow for visualization,
anatomical distribution and enumeration of MC in tissue sections (Wolters et al.,
2005). The interaction of these highly sulphated structures with dye molecules
yields a distinct blue/purple color uniquely staining MC cytoplasmic granules
(Lagunoff, 1974; Wolters et al., 2005). Other commonly used histological
methods include chloroacetate esterase, but this technique may also stain
granulocytes (Rafail et al., 2015). Although local MC identification may be
straightforward, microscopic discrimination between intact and degranulated MC
could be daunting even for trained observers as tissue MC are polymorphic and
staining intensity may vary even when routinely used. Thus, the universally
accepted method to substantiate MC activation remains circulating level
determination of MC-restricted mediators, including tryptase (Schwartz et al.,
1987). However, while unequivocally quantitative, systemic measurements do
not reflect in situ alterations of MC. Because of their strategic location, MC can
regulate vascular permeability and cell recruitment to initiate local inflammation,
therefore exerting important pathogenic functions (Marshall, 2004). We reasoned
that image analysis could aid to develop a reproducible, objective and thus
reliable method to quantify rather than score MC activation. To this end, we
investigated normal mouse skin samples for MC using the well-established MB
four different mice. Next, we considered MC granule-filled cytoplasm as an object
and MC as regions of interest (ROI), endowed with size, volume and staining
intensity parameters. We reasoned that an intact MC should feature higher
values for these parameters, compared to degranulated MC. Our results
demonstrate these morphometric parameters precisely classify MC into two
objective groups, intact and degranulated MC. We further complemented these
measurements by quantification of fractal dimension values for each cellular
state. Taken together, we have established a rigorous analytical method based
on acquisition of morphometric data collected from digitized images of tissue
sections that allows for reliable and objective quantitation of MC activation status.
Thus, MC disorders may involve aberrant proliferation of MC exemplified by
mastocytosis, a myeloproliferative neoplasm, but many primary MC diseases
feature normal MC numbers of abnormal hyperactivity (Hamilton et al., 2011;
Valent et al., 2011). Chronic MC activation could be challenging to diagnose,
often accompanied with mild, episodic or atypical symptoms of idiopathic origin
(Valent et al., 2011). Based on our study, pathological specimens could be
surveyed for MC status at a greater scale for diagnostic/prognostic purposes in
MC related disorders or in diseases where MC dysfunction is suspected in the
absence of pathognomonic signs.
2.2
M
ATERIALS ANDM
ETHODSReagents
All chemicals were purchased from Fisher Scientific (Pittsburgh, PA,
Animals
Gender- and aged- matched C57BL/6 mice were purchased from Charles
River NCI (Frederick, MD, USA). All mice were used at 8–12 weeks of age and
maintained in a pathogen-free facility. Studies were performed in accordance
with institutional animal care and use committee guidelines.
Histology
For skin tissue collection, mice were euthanized by CO2 asphyxiation. The
skin from the dorsal back was shaved. Skin samples were collected and fixed in
10 %-buffered formalin. Fixed tissues were embedded in paraffin, sectioned (5
μm thickness) and mounted on microscope slides. Some slides were stained with
hematoxylin and eosin. Other slides were de-paraffinized in xylene, hydrated
through graded alcohols, and equilibrated in phosphate-buffered saline. To
visualize MC, slides were placed in 0.1 % methylene blue (MB) for 5 s, rinsed
with water, dehydrated in 100 % ethanol and mounted under coverslips with
cytoseal 60 (Wolters et al., 2005). Sections were imaged with a Nikon E-600
microscope (Nikon Inc., Melville, NY, USA) equipped with a Micropublisher digital
camera and images collected with 10× and 40× objectives. Fourteen adjacent
images were recorded from each section as TIFF files. Morphometric parameters
of MC were measured using the MetaMorph® 6.1 Microscopy Automation and
Image Analysis software (MolecularDevices, Sunnyvale, CA, USA).
Descriptors of MC Morphology in the Skin
The morphometric descriptors of area (A), integrated optical density (IOD)
for thresholded and isolated MC residing in the hypodermis and dermis of
isolated regions of the skin (n = 4 mice).
Isolation and Area of MC
In the hypodermis and dermis of digitized images, MC were isolated as
individual ROI using the hue, saturation, intensity (HSI) color model of the set
color threshold subroutine of MetaMorph 6.1 software. The area of the cell
measured excluded holes (non-stained regions) within the ROI.
IOD of MB-stained MC
The HSI values were adjusted to isolate the blue/purple metachromatic
color characteristic of MC as a thresholded region. The cytoplasmic blue/purple
metachromatic color distinguishes MC from other blue staining in the tissue.
From the thresholded region, the area (A) of the cell and its IOD were measured
using the integrated morphometry subroutine of MetaMorph 6.1. The image of
the individual isolated MC was converted to a gray scale image for further
analysis of its fractal dimension using the free HarFa imaging software
(www.fch.vutbr.cz/lectures/imagesci/).
When using threshold boundaries in an image, the IOD is defined as the
weighted sum of the image histogram in which each term in the histogram is
multiplied by the gray value it represents (Walter and Berns, 1981) and is
expressed by the following equation:
𝐼𝑂𝐷(𝑇1, 𝑇2) = ∑𝑇2𝐺𝑉=𝑇1H(GV)𝑥 𝐺𝑉
where T1 and T2 represent the upper and lower thresholds defining the ROI in
histogram. Values of IOD were calculated directly from the integrated
morphometry subroutine of MetaMorph 6.1 software. Using the software’s optical
calipers, the measurements were refined by setting specific boundary conditions
for area and IOD for acceptance of the signal from the individual MC and to
minimize or eliminate the contributions of any non-specific and background
staining. This concept of IOD representing the mass or total amount of stained
material in an ROI of an image is well-established and has been previously
applied to diverse topics including the translocation of nuclear factor κB in the
nucleus (Fuseler et al., 2006; Rogers and Fuseler, 2007), changes in actin
cytoskeleton in cardiac fibroblasts (Fuseler et al., 2007) and adult stromal stem
cells (Fuseler and Valarmathi, 2012), and comparison of the architecture of
normal and tumor microvasculature (Fuseler et al., 2010).
The IOD measured for the MB-stained MC is a representation of the mass
and a measurement of the total amount of material in the delineated region. The
values of the IOD were normalized by being divided by the area (A) of the
thresholded ROI for the MC. The resulting term of IOD/A allows for comparisons
to be made between intact MC and MC that have experienced degranulation as
result of activation. Additionally, IOD/A provides the concept of mass density or
relative density (Smith et al., 1996) of the intact and degranulated MC. As a mass
measurement, the values of IOD/A provide further information on the structure
and distribution of pixels constituting the mass MC granules present within the
Fractal Dimension
MC granular cytoplasm is an irregular and complex object composed of
proteoglycan-containing granules at different levels of resolution, which are
functionally and physiologically similar (self-similar). Because of the complexity of
form, MC cytoplasm cannot be characterized or defined by regular Euclidean
geometry or dimensions. Regular Euclidean dimension assigns an integer to
each point or set of points in Euclidean space and includes the familiar
geometrical descriptors or numbers: 0 to a point,1 to a straight line, 2 to a plane
surface, and 3 to a volume or three dimensional figures. These integer
descriptors are exponents of power functions that describe these objects (Brown
et al., 2002). Complex macro- or micro-anatomical structures cannot be analyzed
by regular Euclidean geometry, but can be described quantitatively by fractal
geometry (Mandelbrot, 1983; Smith et al., 1996). The fractal dimension of
complex or irregular structures can be described by non-integer numbers, with
values falling between two-integer topological dimensions. These non-integer
numbers are described as non-Euclidean and define the fractal dimension (D) of
an object. The concept of fractals currently provides a useful method to quantify
the inherent irregularity or complexity of phenomena (Zhang et al., 2006). In
general, a fractal is any rough and irregular object consisting of parts that are in
some way similar to the whole. Because of the self-similar conditions, MC
cytoplasm can be considered a fractal object and its fractal dimension (D),
expressed by a non-integer number lying between two Euclidean integer
images analyzed in this study, the values of D characterizing MC cytoplasm are
therefore fractional and lie between the Euclidean integers of 1 and 2.
The box-counting method has been the most widely used and general
model for applying fractal analysis to biological and non-biological systems and is
expressed by the formula:
D = lim 𝑒→0
Log𝑁(𝑒)
Log(1𝑒)
The box-counting method consists of a grid of boxes of side length size (e)
superimposed over the image of the structure and N(e) the smallest number of
boxes of side (e) required to cover the surface or outline of the object completely
(Dioguardi et al., 2006; Fuseler et al., 2007; Grizzi and Dioguardi, 1999). Since a
zero limit cannot be applied to a biological object, here the MC, the fractal
dimension is determined as the slope of a regression line when Log [N(e)] is
plotted against Log(1/e) i.e., D = Log [N(e)]/Log(1/e). From the images of
previously isolated and thresholded MC, the D values of the ROI were
determined using HarFA (full version 5.5.31) software (Nezadal et al., 2001). The
thresholded images of MC are assigned mesh sizes of boxes with (e) values
ranging from 2 to 215 pixels and 30 steps within this range were calculated to
generate the Log [N(e)] versus Log(1/e) plots, the slopes of which determine the
D values. In these 40× images, one pixel is equal to 0.229 μm. Fourteen images
were analyzed from each skin section of each animal (n = 4 mice).
Statistics
using Sigma-Plot software (Systat Software Inc., San Jose, CA, USA) and is
shown in figures.
2.3
R
ESULTSMethylene Blue Staining of Normal Mouse Skin Sections for MC Detection
and Analysis
We used a classic staining technique to visualize MC in skin tissue
sections. Methylene blue (0.1 % MB) stains all nuclei of cells in blue. Because of
the metachromatic nature of the proteoglycans that compose the frame of MC
granules, the interaction of the dye molecules with proteoglycans results in an
absorption spectrum shift from blue to purple. Thus, metachromasia features
blue/purple cytoplasmic granules, unique to MC (Wolters et al., 2005). Even
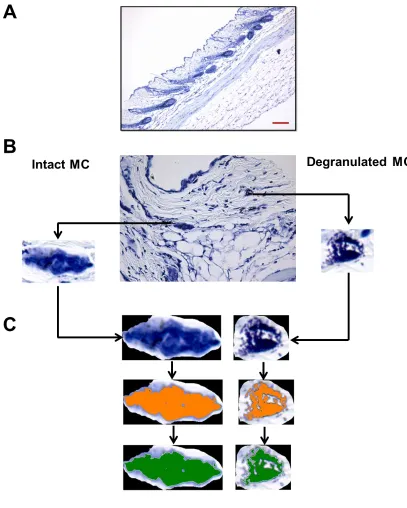
though the metachromatic cytoplasmic staining is MC-specific, Figure 2.1a
shows that in situ MC detection can be challenging, at low magnification using a
10× objective of MB-stained skin section. Higher magnification using a 40×
objective (or High Power Field, HPF) of similar MC-stained skin tissue sections
allows for MC identification, but illustrates the difficulty to decide, even with
blinded analysis and microscope aided human eyes, whether a particular MC
presents features of an intact or a degranulated cell (Fig. 2.1b). We developed a
method for rapid and unequivocal identification of MC status, as follows: an intact
MC was defined as a MC within and/or at the periphery of which no distinct
granule could be singled out in high power field (HPF) (Fig. 2.1b, Intact MC).
Next, we defined as degranulated, MC for which distinct individual granules could
Degranulated MC). Figure 2.1c describes the analytic flow chart employed to
quantitatively identify and distinguish between an intact and a degranulated MC.
To this end, two MC were randomly selected (Fig. 2.1b, Intact MC and
Degranulated MC), and then isolated as specific ROI to remove the background
(Fig. 2.1c, upper panels). Next, isolated MC images were color-thresholded (Fig.
2.1c, middle panels, orange coloring). The thresholding process was followed by
the actual determination of pixel intensity (Fig. 2.1c, lower panels, green coloring)
to measure the IOD parameter which sums the values of all the pixels in the
selection (cell). We noticed that the area occupied by and the morphology of
each MC could vary greatly. To take this variable into account, the area (A)
occupied by each cell was measured next and expressed in square μm. Because
intact MC granules are fully equipped with a variety of mediators whereas
degranulated MC have partly released the mediators harbored in their granules,
we reasoned that intact and degranulated MC must be characterized by
differential mass or IOD/A measurements, allowing for objective definition of
each of these cellular states.
Relative Mass Calculations Based on IOD/A Ratios Distinctly and
Quantitatively Characterize Intact and Degranulated MC
We further analyzed skin tissue sections collected from four different
animals, and randomly selected 90 intact and 90 degranulated MC, as described
above. Next, IOD and A parameters were calculated as described in Figure 2.1.
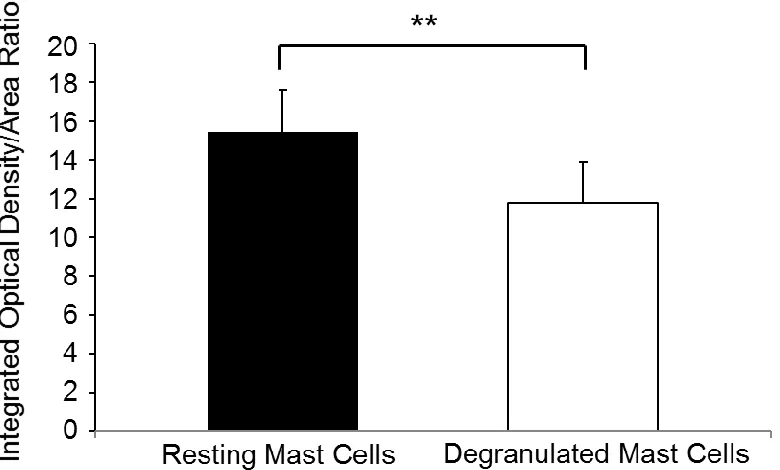
Quantitation of IOD/A ratios were carried out. As shown in Figure 2.2, intact MC
decreased to 11.782 ± 2.109 in degranulated MC. Importantly, these results
quantitatively substantiate the notion that intact MC feature a higher mass
compared to degranulated MC. This procedure actually measures relative MC
mass and demonstrates this parameter to be significantly attenuated upon
degranulation, in agreement with the biological relevance of the process.
Fractal Dimension Analysis Constitutes a Suitable Analytical Approach to
Further Define Morphometric Evaluations of Intact and Degranulated MC
We next considered that the size and volume parameters previously
calculated for each MC status could be complemented by quantification of
comparative fractal dimension values. To this end, we sought to determine
whether fractal dimension, a measure of chaos and space filling capacity, could
be a useful discriminating factor between intact and degranulated MC, as there is
an increasing use of applied fractal geometry in the medical field for pattern
recognition, texture analysis and segmentation. This type of analysis has been
performed to study cell nuclei and nuclear chromatin and has been demonstrated
as a useful prognostic tool in cancer (Ferro et al., 2011; Streba et al., 2015).
Therefore, we reasoned that the more ordered cytoplasm of an intact MC should
display contrasted fractal characteristics compared to a more heterogeneous,
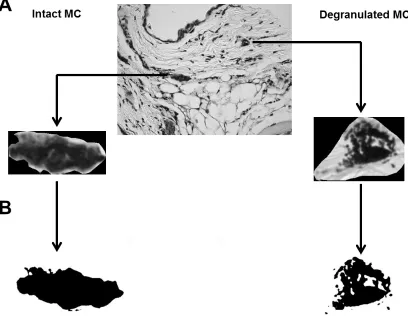
less uniform cytoplasm of a degranulated MC. Figure 2.3a shows the procedure
to first isolate cells to be analyzed from the tissue and second, proceed with
binarization of the image (i.e., generate a black and white image from a
gray-scale one). Binarized images are next used to calculate fractal dimension (D),
two-dimensional images analyzed were between the Euclidean values of 1 (a straight
line) and 2 (an irregular, complex structure). Of note, fractal dimensions
constitute numerical descriptors which are exponents of power functions, i.e.,
nonlinear functions.
Fractal Analysis is a Reliable Method for Objective Quantification of in situ
MC Degranulation
Analysis of normal skin samples collected from four different mice was
conducted using 14 images per animal and randomly chosen intact MC (n = 29 -
60 cells per animal) and degranulated MC (n = 14 - 29 cells per animal). The
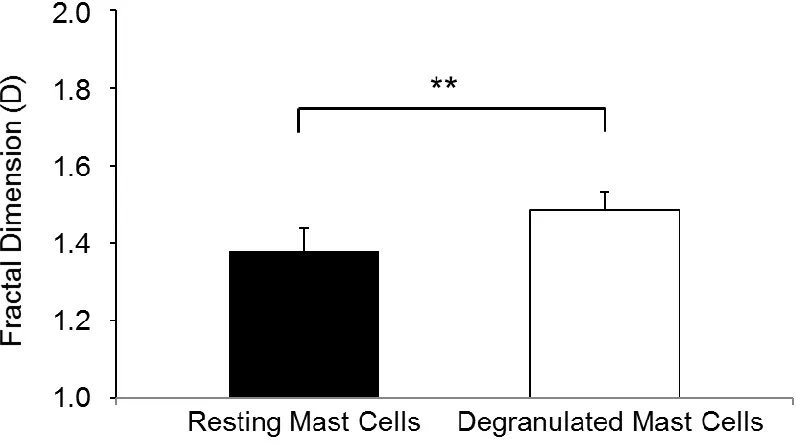
fractal dimension of each cell was determined. The discriminatory performance of
D parameters is shown in Figure 2.4, indicating mean D values of 1.378 ± 0.621
and 1.484 ± 0.0489 for intact and degranulated MC, respectively. Surprisingly,
the D values characterizing each MC status were very consistent from animal to
animal, suggesting the potential relevance of fractal signatures to objectively
evaluate MC activation status. Moreover, mean D values of degranulated MC
were significantly augmented compared to mean D values of intact MC. We
established that computer-assisted morphometric MC analysis performed on
microscopy images of tissue samples may overcome the time-consuming and
subjective examination that necessitates expertise and extensive observer
training.
2.4
D
ISCUSSIONKey components of innate immunity, MC are present in tissues apposed to
numerous intracytoplasmic granules, large dense core vesicles composed of a
proteoglycan matrix where many mediators are pre-stored, including vasodilating
histamine, cytokines and chemokines (Wernersson and Pejler, 2014). Beside
their canonical activation through the cross-linking by antigen (Ag) of
immunoglobulin E (IgE) bound to their high-affinity receptors, MC express a
plethora of receptors, including Toll-like receptors, and receptors for complement,
cytokines, chemokines, neurotransmitters and sphingosine-1-phosphate (S1P),
the ligation of which could also trigger further MC activation (Oskeritzian, 2015;
Oskeritzian et al., 2008; Oskeritzian et al., 2015; Oskeritzian et al., 2010;
Theoharides et al., 2012). Moreover, microenvironmental physical/mechanical,
pH, osmolarity and temperature alterations and UV radiation can also activate
MC. Degranulation or the exocytosis of granules is the most prominent process
indicative of MC activation. MC stimulation is traditionally monitored through the
detection of granule-associated mediators measured in the circulation upon
release. However, a systemic appreciation of MC activation, though relevant and
sometimes life-threatening such as upon anaphylactic shock, does not inform on
the status of local MC in tissues. As outlined above, the distinctive ability of MC
to produce and pre-store large concentrations of many mediators positions these
cells as first-line responders thus shaping the initial local response to trauma. We
have previously reported that IgE/Ag- and S1P-mediated activation of MC
delivers locally several cell-recruiting chemokines, thus endowing MC with early
guidance of inflammatory events (Oskeritzian et al., 2008; Oskeritzian et al.,
pathogenesis as the positioning of large numbers of MC is substantiated in the
dermis and the hypodermis, subcutaneous fatty tissue layer of rodent and human
skin (Hart et al., 1999; Hart et al., 1998). Strong evidence suggests an
association between MC-derived functions and the mediator repertoire they
differentially release owing to the nature of stimulation (Galli et al., 2008;
Kalesnikoff and Galli, 2008).
Intragranular proteoglycan interaction with dye molecules of MB results in
a metachromatic staining of granules specific to MC, the only tissue-resident
cells that display these distinct blue/purple-colored granules in their cytoplasm.
Of note, although circulating basophils share some phenotypic and functional
features, they differ from MC in many aspects of natural history, granule contents
and functions (Voehringer, 2013). Relevant to our study, basophils are not found
in normal tissues (Arock et al., 2002), but could be recruited into inflamed sites
(Voehringer, 2013). Importantly, the main histochemical difference that allows
distinguishing MC from basophils resides in differential metachromatic staining.
Namely, MC granules comprise both heparin and chondroitin sulfate (CS)
proteoglycans, whereas basophil granules present CS but do not contain heparin
and are fewer in number compared to MC granules, thus resulting into weak
staining with basic dyes (Voehringer, 2013). Other distinct features of MC are
their round nuclear morphology and a cell size ranging from 5 to 10 μm,
conversely to basophils that display lobulated, indented or segmented nuclei and
While easy to identify in MB-stained tissue sections, defining MC
activation status remains challenging even for a trained observer and is a source
of considerable inter-observer variability. Since MC are tissue-resident and could
initiate or suppress immune responses, they constitute an emerging target
candidate for fine-tuning the local microenvironmental responsiveness, therefore
pathogenesis and carcinogenesis (Oskeritzian, 2015). There is increasing need
for a better understanding pertaining to the relationship of MC in inflammation
and cancer as it seems diversified and therefore ill-understood (Giannou et al.,
2015; Oldford and Marshall, 2015; Oskeritzian, 2015; Ribatti, 2013). Indeed,
many studies acknowledge the presence of increased MC numbers in numerous
pathological conditions, yet reporting the more relevant and tractable local
percentage or number of degranulated MC is not recognized as strong univariate
data that often needs to be validated by quantitating MC-derived mediators in
biological fluids.
In this study, we developed a computerized method for morphometric
analysis of MC based on objective parameter measurements in routinely
MB-stained normal skin tissue sections. Of relevance to MC granularity and
morphology, these criteria include mass and relative density measurements
based on IOD and area (A) ratios and fractality, which implies scale-independent
self-similarity. We discovered that, independent of the subject, intact skin MC are
consistently characterized by a mass (IOD over A ratio) significantly higher than
degranulated MC. Of note, the IOD/A ratios of intact or degranulated MC were
further highlighting the reproducibility and validity of our newly developed
analytical method. Interestingly, the use of IOD and A parameters have
previously been applied to dermal MC as a tool to quantify histamine content, but
not to provide a measurement of MC activation as demonstrated herein (Hart et
al., 1999; Hart et al., 1998).
The examination of fractal characteristics has been convincingly relevant
to analyze chromatin structure and nuclear texture, providing important
diagnostic and prognostic information for patients with acute leukemia and
multiple myeloma (Ferro et al., 2011). Fractal analysis has been widely applied in
the past to quantify cytoskeleton morphology (Fuseler et al., 2007; Fuseler and
Valarmathi, 2012; Qian et al., 2012), cellular shape (Jelinek et al., 2011; Sedivy
et al., 2002; Wick et al., 2003), vasculature structure (Anderson et al., 2005; Di
Ieva et al., 2007; Fuseler et al., 2010; Grizzi et al., 2005), vascular sprouting
(Doubal et al., 2010; Moledina et al., 2011) and tumor microvasculature (Di Ieva,
2012; Fuseler et al., 2010). More recently, it was successfully applied to quantify
collagen fibrotic lesions of the liver (Dioguardi et al., 2008; Dioguardi et al., 2006)
and the heart (Zouein et al., 2014). Microscopy evaluation of the MC
degranulation process requires high magnification analysis and could be difficult
given staining variations occurring in routine slide preparations. We took
advantage of the fact that fractals are scale independent and their determination
based on thresholded images less dependent on staining intensity. Methylene
blue is one of the most common metachromatic staining methods and
their granules (Wolters et al., 2005). As such, it could be used to distinguish
intact from degranulated MC. However, observer-based analysis often yields
inconsistent data, varying with the individual grading of MC status and provides
semi-quantitative estimates of MC degranulation rather than reliable quantitation
partly because of the irregular shapes tissue MC display in situ. Thus, MC
cytoplasm, 80% of which is occupied by granules, is highly polymorphic and
irregular in shape. To overcome these conditions, we considered the
granule/cytoplasm mass as a fractal object, a concept developed by Mandelbrot
(1982) that provides a theoretical framework for many biological processes and
objects. Thus, the fractal property relates to a measurement variable and a
fractal object or process can reveal fractal characteristics of many different
variables or features. We measured the fractal dimension (D) of intact and
degranulated MC, as a measure of the comparative space filling capacity and
complexity or structural density of MC in these two different biological stages,
using digitized two-dimensional images. We discovered that D associated with
intact MC is consistently and significantly lower than D of degranulated MC in a
reproducible manner. These important results suggest that the measure of D can
quantitatively distinguish intact from degranulated MC, regardless of cellular
morphology which could greatly vary. Together with the relative density
measurements provided by the IOD/A ratios, which determines the structure
and/or distribution of the granular material within a MC (our region of interest), we
demonstrate that the measure of D generates a quantitative description of
these data in a semi-automated manner for potential diagnosis/prognosis
applications to compare the analysis of healthy and diseased tissue sections in
MC related disorders. We attributed the detection of some degranulated MC in
normal skin to the procedure for sample preparation that requires shaving of the
mouse back skin. This mandatory step constitutes a mild but perhaps significant
mechanical stimulus leading to a low but detectable incidence of dermal MC
activation.
Despite the differences between mouse and human skin, mouse models
of human disease remain prevalent, and in many cases genes of interest are
deregulated and/or mutated in both species (Gerber et al., 2014). The vast
abundance of disease models, knockout and transgenic strains ensure that
mouse models will remain a highly relevant mainstay to the study of skin biology
(Gerber et al., 2014). Therefore, our morphometric method of MC analysis was
first developed using mouse skin samples. Applying this morphometric method to
human samples would assist clinicians and hospitals with providing a rapid
determination of MC activation status, including in suspected cases of MC
activation syndrome, mastocytosis, and anaphylactoid versus genuine
anaphylactic reactions (Akin et al., 2010; Hamilton et al., 2011; Valent et al.,
2011). A previous report applied fractal dimension and lacunarity or
measurement of roughness to characterize MC degranulation in rainbow trout
(Manera et al., 2014). Although informative, this study did not use mammalian
MC. Moreover, MC degranulation was triggered in a receptor-independent
composed of mixed polymers of phenylethylamine cross-linked by formaldehyde
of undetermined ratio thus precluding calculation of molar concentrations
(Manera et al., 2014). Our study establishes that mouse skin MC status can be
quantified at homeostasis using fractal geometry, image analysis and readily
available standard bright field microscopy on tissue sections routinely stained
with MB, providing in situ quantification of MC activation. We are currently
applying similar approaches to complementary MC immunohistochemistry
staining techniques designed to phenotype MC subsets. Introduction of the
fractal theory in biology and medicine has already led to a better understanding
of many physiological processes, including allosteric enzyme kinetics,
intracellular bioenergetic dynamics, metabolic rate, drug clearance modeling,
angiogenesis, cardiovascular physiology and tumor growth (Aon et al., 2008;
Ferro et al., 2011; McNally and Mazza, 2010; Thamrin et al., 2010). Here we
demonstrate in situ quantification of MC status in mammalian tissue samples,
combining relative density and fractal dimension measurements of MC
cytoplasmic density and order. Furthermore, we propose that this morphometric
analysis is applicable to patient samples and provide quantitative data pertaining
to local MC activation in tissue sections in clinical settings.
We demonstrate the ability to quantify in situ MC activation using
computer-assisted image analysis and biological specimens, based on fractality
and mass measurements. Reproducible, consistent and quantitative data were
collected from multiple skin samples, establishing that significantly different
method may be further developed as a rapid diagnostic tool for the formulation of
Figure 2.1Methylene-blue stained mouse skin for MC detection and
analysis. a: Methylene blue (MB)-stained mouse skin tissue section. Scale bar is 200 μm. b: MB-stained mouse skin tissue section with a selection of two
Figure 2.2 Comparison of mass between intact and degranulated MC.
Figure 2.4 Fractal dimension of degranulated MC is higher than intact MC.
Comparative fractal dimension (D) analysis for intact and degranulated MC in skin samples of four different normal mice (14 images per animal were
C
HAPTER3: M
ASTC
ELLS ANDS
PHINGOSINE-1-P
HOSPHATEU
NDERLIEE
ARLYP
ATHOGENICR
EMODELING INP
RE-
LESIONALE
CZEMA23.1
I
NTRODUCTIONAtopic dermatitis (AD) is a chronic relapsing inflammatory skin disease
that affects 15-30% children and 2-10% adults world-wide (Auriemma et al.,
2013; Darlenski et al., 2014; Eyerich and Novak, 2013; Graham and Nadeau,
2014; Liu et al., 2011; Nakamura et al., 2013; Patrizi et al., 2011; Szegedi et al.,
2015). This complex multifactorial disorder often features hypersensitivity to
environmental agents and immune dysfunction (Auriemma et al., 2013; Elias,
2014; Eyerich and Novak, 2013; Kim et al., 2014; Liu et al., 2011; Mu et al.,
2014; Patrizi et al., 2011). Yet, the sequential events leading to eczematous
lesions and AD etiology are not completely understood.
Interestingly, 70-80% of AD patients have increased levels of total serum
IgE antibodies (Ando et al., 2013; Auriemma et al., 2013; Darlenski et al., 2014;
Kendall and Nicolaou, 2013; Liu et al., 2011; Patrizi et al., 2011). Perivascular
accumulation of lymphocytes and mast cells (MC) are observed in chronic
lesions (Ando et al., 2013). However, few studies have investigated the initial
phase leading to lesions, including events prior to IgE production (Gittler et al.,
2012; He et al., 2007; Kim et al., 2014; Spergel et al., 1998; Wang et al., 2007;
Zhu et al., 2015). Equipped with surface receptors for IgE (FcεRI) and other
ligands and tissue-resident at homeostasis, MC play an important role as
initiators of inflammation and first-line responders to inflammatory signals (Griffith
et al., 2014; Oskeritzian, 2015; Oskeritzian et al., 2015; Oskeritzian et al., 2010).
Moreover, MC present the unique ability to produce and store many vasoactive
and cytoactive mediators in their cytoplasmic granules prior to trauma and also
neo-synthesize bioactive products upon activation (Galli and Tsai, 2012;
Kalesnikoff and Galli, 2008; Mu et al., 2014; Nakamura et al., 2013; Oskeritzian,
2015; Oskeritzian et al., 2015; Oskeritzian et al., 2010; Zhu et al., 2015). We
recently established that MC and a potent sphingolipid metabolite,
sphingosine-1-phosphate (S1P) are at the nexus of inflammatory infiltration in early lung
allergic responses (Oskeritzian et al., 2015). We previously reported that
MC-derived S1P, produced by sphingosine kinase (SphK), can be exported out upon
activation, amplify MC cytokine/chemokine production by autocrine binding to
S1P receptors and regulate cell trafficking (Mitra et al., 2006; Oskeritzian, 2015;
Oskeritzian et al., 2008; Oskeritzian et al., 2015). S1P can also activate MC
independently of the canonical IgE/FcεRI pathway (Chumanevich et al., 2016;
Kendall and Nicolaou, 2013; Oskeritzian et al., 2015; Oskeritzian et al., 2010).
In the current study, we investigated AD pathogenesis using a variation of
a well-established human AD-like mouse model and collected skin samples for
analysis after a single epicutaneous (EC) exposure to OVA Ag (Spergel et al.,
infiltration of the hypodermis to local MC activation and S1P elevation. Next, we
examined skin remodeling in mice deficient for SphK1 or MC and after LPS-free
OVA exposure and established an essential role for MC, S1P and LPS at the
onset of AD.
3.2
M
ATERIALS ANDM
ETHODSAtopic dermatitis model
AD was induced in 8 to 12 weeks of age-matched female C57Bl/6J (WT),
SphK1 KO (SphK1tm1Rlp), and MC-deficient KitW-sh/W-sh (B6.Cg-Kit
W-sh/HNihrJaeBsmGlliJ) mice as previously described (Spergel et al., 1998),
purchased from Charles River NCI (Frederick, MD) and The Jackson Laboratory
(Bar Harbor, ME). After simple randomization using shuffled pieces of paper that
indicated saline, OVA or LPS-free OVA, mice were assigned to either
experimental group. Then, 100 µl of OVA solution (100 µg OVA (Sigma-Aldrich,
St Louis, MO) or LPS-free OVA (100 µg EndoGrade® OVA (Hyglos GmbH,
Munich, Germany) in 0.9% saline) or 0.9% saline only (saline control) were
pipetted on a 1 cm x 1 cm square gauze pad (patch) placed on the shaved and
tape-striped upper-back skin area. Next, this area was occluded with a Tegaderm
Transparent Dressing (3M HealthCare, St Paul, MN) using bandages. Patch was
removed after seven days and skin samples collected from euthanized mice. For
patch 3-IgE determinations, the full AD protocol was conducted exactly as
previously described (Spergel et al., 1998). Briefly, each patch was secured for
one week followed by two weeks of rest before next exposure week. Patch 1 and
immediately after euthanasia and stored at -80oC until use. Animal experiments
and all experimental protocols were approved by the University of South Carolina
Institutional Animal Care and Use Committee. Animal experiments and all
methods were performed in accordance with the relevant guidelines and
regulations.
Histology and Microscopy
Skin tissues collected from euthanized mice were fixed in 4% fresh
paraformaldehyde. Fixed tissues were embedded in paraffin, sectioned (4 µm
thickness) and mounted on microscope slides.One group of slides was stained
with Hematoxylin and Eosin (H&E) for skin morphometric analysis. To visualize
MC, a second group of slides was placed in 0.1% methylene blue (MB) for five
seconds, rinsed with water, dehydrated in 100% ethanol and mounted under
coverslips with cytoseal 60 (Wolters et al., 2005). Sections were imaged with a
Nikon E-600 microscope (Nikon Inc., Melville, NY) equipped with a
Micropublisher digital camera model 5.0 and images collected as TIFF files with
the Micropublisher software at low (10x, numerical aperture 0.30) and high (40x,
numerical aperture 0.75) magnification for analysis. Images were analyzed as
24-bit color images or 8-bit monochrome images, as required, using the
QImaging software version 2.0.13 (QImaging Corp., Surrey, BC, Canada).
Morphometric and fractal parameters of nuclei (infiltration, 25-30 ROIs/image, a
minimum of twelve 40x-images/skin section; 4 skin sections/2 mice/treatment
group) and MC (percent degranulation, fifty 40x- total images/310-485 total MC;
6.1 Microscopy Automation and Image Analysis software (Molecular Devices,
Sunnyvale, CA) and the free HarFa imaging software
(www.fch.vutbr.cz/lectures/imagesci/), as previously described (Wedman et al.,
2015). For these and all quantifications described below, the investigators who
were making measurements were blind to slide group allocations (single blind
studies).
Morphometric measurement of skin remodeling
The thickness of each skin layer (epidermis, dermis and hypodermis) was
measured in saline- and OVA-treated specimens using an ocular micrometer
(Klarmann Rulings, Inc., Litchfield, NH). From each slide, uniform regions of the
epidermis, dermis and hypodermis were selected and the average thickness was
measured (n= 3-5 measurements/3-5 animals/treatment group/skin layer (i.e,
epidermis, dermis, hypodermis).
Computer-assisted quantification of hypodermal cellular infiltration
A recent computer-assisted imaging method developed by our laboratory
(Wedman et al., 2015) was adapted to quantify cellular infiltration. A minimum of
twelve high-magnification H&E images per animal was used to determine cellular
infiltration in the hypodermis. To this end, nuclei were isolated by means of color
thresholding using the set color threshold subroutine of the MetaMorph software
(orange color overlay) and quantified by applying a fixed circular region of
interest (ROI, diameter=75µm) of constant area that was moved sequentially to
adjacent regions to survey the entire hypodermis of each section (n=25-30
morphometric parameters of the nuclei (area, perimeter and integrated optical
density determined using the Integrated Morphometry Analysis subroutine of
MetaMorph) were used to refine nuclei measurements and eliminate any
background noise.
Validation of cellular infiltration quantification by independent fractal
dimension analysis
As described above, fixed circular ROIs were isolated and collected as
TIFF file images throughout the hypodermis of H&E images in each section. The
hue, saturation and intensity values were adjusted to isolate the nuclei in orange
as a thresholded region. The images of the individual isolated and selected
nuclei (green) were converted to a 8-bit gray scale image for further fractal
dimension measurements using the free HarFa imaging software
(www.fch.vutbr.cz/lectures/imagesci/), which converts the gray-scaled image into
a binary one, as we previously described (Wedman et al., 2015). Briefly, an area
featuring cellular infiltration is an irregular and complex object composed of
nuclei, which are fundamentally similar (self-similar). Because of its complexity,
infiltration cannot be described by regular Euclidean geometry that uses integer
descriptors (Brown et al., 2002; Wedman et al., 2015). Instead, it can be
described quantitatively by fractal geometry using non-integer numbers, with
values falling between two-integer topological dimensions (Mandelbrot, 1983;
Smith et al., 1996). These non-integer numbers define the fractal dimension (D)
of an “object”, here, the distribution of nuclei within a hypodermal ROI. As