IJEDR1603124
International Journal of Engineering Development and Research (www.ijedr.org)759
Entropy and Power Analysis of Brain Signal Data by
EEG Signal Processing
1Adiba Khurshid, 2Barkatullah 1Research Scholer, 2Lecturer
1,2Department of Electronics and Communication Engineering, Alfalah University, Dhauj , Faridabad Haryana
________________________________________________________________________________________________________
Abstract- EEG is brain signal processing technique that allows gaining the understanding of the complex inner
mechanisms of the brain and abnormal brain waves have shown to be associated with particular brain disorders. The analysis of brain waves plays an important role in diagnosis of different brain disorders. MATLAB provides an interactive graphic user interface (GUI) allowing users to flexibly and interactively process their high-density EEG dataset and other brain signal data different techniques such as independent component analysis (ICA) and/or time/frequency analysis (TFA), as well as standard averaging methods. In this project we will analyze the entropy and power of the brain signal by EEG signal processing and this work is implemented by using MATLAB.
Keywords- EEG, Entropy, Wavelet Decomposition, Graphic user interface (GUI)
________________________________________________________________________________________________________
I. INTRODUCTION
In 1875, the English physician, Richard Canton, discovered electrical currents in the brain and in 1929 the German psychiatrist, Hans Berger, recorded these currents, and named them the Electro-encephalon-gram (EEG) (Berger, 1929). The analysis of brain waves plays an important role in diagnosis of different brain disorders. The Electroencephalogram (EEG) has been an important clinical tool to assess human brain activity. Electroencephalography (EEG) is a measurement of potentials that reflect the electrical activity of the human brain. It is a readily available test that provides evidence of how the brain functions over time. The EEG is widely used by physicians and scientists to study brain functions and to diagnose neurological disorders In our study, EEG data sets are collected by a system. From the EEG datasets obtained Delta, Theta, Alpha & Beta and Gama waves are extracted by using wavelet transform. After all, according to these waves we analyze the entropy and power of brain signal data by EEG signal processing technique .Different EEG signals are collected as a form of datasets in the MATLAB.
II. MATERIALS AND METHOD 2.1 EEG signal
However, although some devices such as magnetic resonance (MR), brain tomography (BT) are used to diagnose the structural disorders of brain, for observing some special illnesses especially such as epilepsy. The electrical activity of active nerve cells in the brain produces currents spreading through the head. These currents also reach the scalp surface, and resulting voltage differences on the scalp can be recorded as the electroencephalogram (EEG) by electrodes on or inside the brain with 10-20 electrode placement system. This 10 - 20 lead system provides information of how the brain functions over time. Most commonly it is used to show the type and location of the activity in the brain during a seizure. It also is used to evaluate people who are having problems associated with brain function. These problems might include confusion, coma, and tumors, with long-term difficulties with thinking or memory, or weakening of specific parts of the body. EEG is a recording of the brain’s electrical activity, made from the scalp. There are five major brain waves distinguished by their different frequency ranges.
2.2 10 – 20 System
IJEDR1603124
International Journal of Engineering Development and Research (www.ijedr.org)760
Fig.1 10 – 20 Electrode Placement System2.3 FREQUENCY BAND OF EEG SIGNAL
The brain waves recorded from the scalp have small amplitude of approximately 100μV. The frequencies of these brain waves range from 0.5 to 100 Hz, and their characteristics are highly dependent on the degree of activity of the cerebral cortex. Generally, in normal persons, the brain waves may be classified as belonging to one of four wave group. 1. Delta (δ) -The Delta waves which include all the waves in the EEG below 3.5 Hz. They occur in deep sleep, in childhood, and in serious organic brain disease. 2. Theta (θ) -The Theta waves have frequencies between 4 and 7 Hz. These occur mainly during the childhood, but they also occur during emotional stress in some adults. 3. Alpha (α) -The Alpha waves are rhythmic waves occurring at a frequency range between 8 and 13 Hz, which are found in all normal persons when they are awake in a quiet, resting state of cerebration. 4. Beta (β) - The Beta waves are very low amplitude, and high frequency range between 13 and 30 Hz. They are affected by mental activity.
Figure 2:- Four typical dominant brain normal rhythms, from high to low frequencies. The delta wave is observed in infants and sleeping adults, the theta wave in children and sleeping adults, the alpha wave is detected in the occipital brain region when there is no attention, and the beta wave appears frontally with low amplitude.
2.4 ENTROPY AND POWER
Entropy is the measure of uncertainty. One of the challenging problems for EEG data feature extraction is that EEG signal is complex, non-linear, non-stationary, and random in nature . They are considered stationary only within short intervals, over longer periods of time, the signal characteristics are non-stationary. In EEG system entropy can be used to measure the level of complete disorder and confusion . Higher entropy indicates more complex system .Entropy contains useful information and features that are unique to individuals , and hence entropy can be used for person identification .Entropy is a measure of uncertainty. In brain-computer interface systems, entropy can be used to measure the level of chaos of the system . It is a non-linear measure quantifying the degree of complexity in a time series . Let X be a set of finite discrete random variables X = x1; x2; :::; xm ; xi 2 Rd.
IJEDR1603124
International Journal of Engineering Development and Research (www.ijedr.org)761
where c is a positive constant acting as a measuring unit and p(xi) is probability
of xi .
some entropy methods has been successfully used in EEG feature extraction for epilepsy detection, such as Sample, Approximate, Spectral entropy , and motor imagery such as Approximate , Kolmogorov , and Spectral entropy. We believe that entropy contains useful information and features that are unique to individuals, and hence entropy can be used for person identification .The performance of a person identification system can be measured based on its accuracy and efficiency (identification speed).
III. PROCEDURES
‒ Different EEG signals are collected in the form of dataset in the MATLAB. ‒ Load the data into the software for brain signal processing .
‒ De-noising of EEG signals.
‒ Using wavelets decomposition decomposed the EEG signals. ‒ Butterworth filter is used to remove high frequency.
‒ Splitting the full band wave into sub band waves. ‒ Analysis of sub band wave.
3.1 METHODOLOGY
start
Loading EEG data set in
matlab
De-noising of EEG signals
Wavelets decomposition
of de-noised signals
Signal filtering
Splitting waves using wavelets
IJEDR1603124
International Journal of Engineering Development and Research (www.ijedr.org)762
IV. SIMULATION AND RESULT ANALYSIS4.1 RESULT OF PRE PROCESSING
The raw EEG signal contains some noises that occurs due to eye blinking , muscular artifacts and deep breathing at testing time .Butterworth filter is used to reduce the noises it provides the same shape for higher order ,smooth and sharp signal of brain wave to analyze the signal more clearly to the viewer .After removal of noise the base line wander effect the de-noised signal due to this effect the entire signal is shifted from its normal base .base line wander occur due to fluctuation of electrode .after removing the base line wander the clean EEG signal appear on the screen.
Figure 3:- shows the original signal ,after removal of noise ,baseline wander ,after removal of base line wander and clean EEG signal. The x-axis contains the time duration and y-axis contains the frequency .
4.2 RESULT OF DE-NOISED SIGNAL
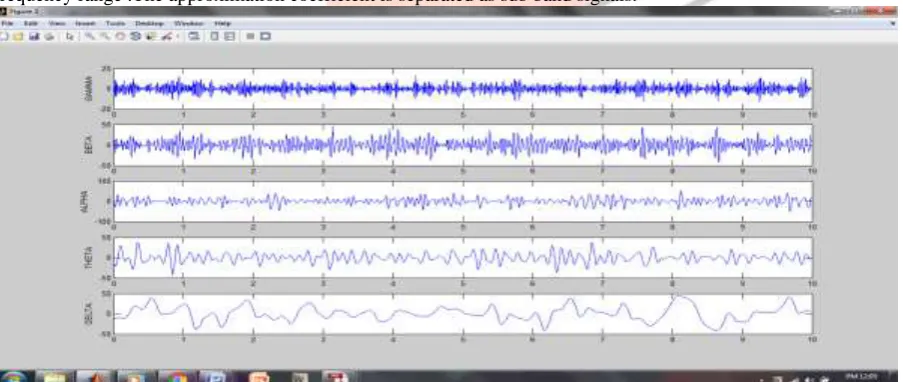
The EEG signal is processed with the Deubechies wavelets which is used to remove the noises and decomposed the signal into sub band signals .Based on the frequency range the sub band signals are separated as Delta, Theta, Alpha, Beta, Gama. After the decomposition the noises are reduced then the error rate is calculated easily.fig 8 shows the decomposed signal based on the frequency range .The approximation coefficient is separated as sub band signals.
figure 4:- shows the decomposed signal ,based on the frequency range . The approximation coefficient is separated as sub band signals such as Alpha, Beta, Gama, Theta and Delta.
IJEDR1603124
International Journal of Engineering Development and Research (www.ijedr.org)763
Figure 5:- Analysis of power4.4 ANALYSIS OF ENTROPY
Figure 6:- Analysis of entropy V. CONCLUSION
This paper proposes of analyzing power and entropy in sub band off EEG signals and hence technique of detecting various disorder for example:- epileptic using wavelet decomposition using MATLAB more accurately. The contribution presents the use of wavelet transform for a given signal. EEG data were used as input to the wavelet transform offers a perfect success in the rejecting undesired frequencies using Butterworth filter and permits the discrete wavelets transform(DWT) levels to discriminate the EEG waves only. This method offers more efficiency, which it can be easily distinguished between normal and epileptic.
VI. REFERENCES
[1] Shaik.Jakeer Husain 1 and K.Srinivasa.Rao 2 (2012)-- Epileptic Seizures Classification from EEG Signals using Neural Networks International Conference on Information and Network Technology, IPCSIT vol. 37 Singapore
[2] S. Tong and N.V.Thacor, Engineering in Medicine & Biology- Quantitative EEG Analysis Methods and Clinical Applications, Boston/London: Artech House, 2009.
[3] H. He and J. A. Starzyk, "A Self-Organizing Learning Array System for Power Quality Classification Based on Wavelet Transform," IEEE Transaction On Power Delivery, vol. 21(1), pp. 286-295, 2006.
[4]Maan M. Shaker, 2005 EEG Waves Classifier using Wavelet Transform and Fourier Transform, International Journal of Biological and Life Sciences 1:2
[5] M. Akin, M. A. Arserim, M. K. Kiymik and I. Turkoglu, "A New Approach For Diagnosing Epilepsy By Using Wavelet Transform And Neural Networks," in Proc. 2001 IEEE/EMBS 23rd Annual Conference, pp. 1596 – 1599.
[6] H. Adeli, Z. Zhou, N. Dadmehr. “Analysis of EEG records in an epileptic patient using wavelet transform”, J Neurosci Methods. 2003 Feb 15;123(1):69-87.
.[7]Chiri Yamaguchi :Fourier and Wavelet analysis of normal and ep Electroencephalogram,Memoirs of Fukui University of Technology,Vol33,part1,2003