Groundnut Crop Yield Prediction Using Machine Learning
Techniques
Vinita Shah*1, Prachi Shah2
*1Assistant Professor, Information Technology, G H Patel College of Engineering and Technology, V V Nagar,
Gujarat, India
2Assistant Professor, Department of Information Technology, BVM Engineering College, V V Nagar, Gujarat,
India
ABSTRACT
Yield prediction is a very important agricultural problem. Any farmer is interested in knowing how much yield he is about to expect. In the past, yield prediction was performed by considering farmer's experience on particular field and crop. Based on previous data, we can predict crop yield using machine-learning technique. Crop yield prediction is an important area of research, which helps in ensuring food security all around the world. We analyzed result of multiple linear Regression, Regression Tree, K-nearest Neighbor and Artificial Neural Network on Groundnut data of previous 8 years. We have done prediction based on Soil, Environmental and Abiotic attributes. KNN algorithm gives better result compared to other algorithms for Groundnut crop yield prediction.
Keywords : Crop analysis; Yield prediction; K-means; K-NN; Multiple Linear regression
I.
INTRODUCTIONData mining is the process of extracting useful knowledge or information from large amount of data. In digital generation, data mining is becoming an increasingly important tool to transform data into information. When the Data mining techniques are used with agriculture data, the term is known as precision agriculture. The main aim of the work is to improve and substantiate the validity of yield prediction, which is useful for the farmers. Agricultural crop production depends on various factors such as biology, climate, economy and geography. Several factors have different impacts on agriculture. So previous year‟s researchers used appropriate statistical methodologies. A large number of variables can affect agronomic traits such as yield.
Yield prediction is a very important agricultural problem. Any farmer is interested in knowing how much yield he is about to expect. In the past, yield prediction was performed by considering farmer's experience on particular field and crop. Consider that data are available for some time back to the past, where the corresponding yield predictions have been recorded. In any of Data Mining procedures, / the training data is to be collected from some time back to the past and the gathered data is used in terms of training which has to be exploited to learn how to classify future yield predictions. Crop yield prediction is an important area of research, which helps in ensuring food security all around the world.
datasets for various districts, we proposed a new approach that divides the yearly dataset in to seasonally basis. Then we applied some clustering techniques and suitable classification techniques to obtain crop yield predictions.
It is explained as follows: Section 1 introduces the area. Section 2 provides some related work in Crop yield prediction. Section 3 explains motivations for the work. Section 4 presents the Real dataset use for our work. Section 5 presents methodology of the work. Section 6 gives the analysis of proposed approach.
II.
MOTIVATIONGujarat has been described by hot semi-dry conditions, which has 49% of the aggregate topographical range as developed grounds (9.6 million ha). The inundated zone is just 32% of the aggregate developed territory. Rest of the range confronts vast water deficiency. The ground waters are of low quality. The alluvial soils are basic/saline and lacking in nitrogen, phosphorus and zinc. The editing force is low at 118%. The aggregate sustenance grains creation of the state is 5.26 million tons. The critical yields are groundnut, cotton, pearl millet, maize, sorghum, castor, gram and mustard.
A farmer must have a good understanding of the soil type, the biotic factors governing the soil and a thorough knowledge about the traditional agricultural practices to gain maximum crop yield. Such practice may include harrowing and ploughing using inputs such as fertilizers, insecticides and herbicides [7].
It would be seen from the Fig.1 that though Gujarat stands first in area and production but productivity wise Tamil Nadu state stands first in the country.
However, Gujarat state groundnut production depends on September rains. In case September rains are not there in Gujarat, the production and productivity will go down automatically. Therefore, it is important to find the relation between climate variable, rainfall and yield data.
Fig. 1.Statewise Area Production and production of Groundnut [14]
III.
PREPROCESSINGA. Dataset
The datasets, the finalized version of our data contains
Total 4 districts for the time periods of 2006 to 2013.
B. Input Variables and Measures
From the vast initial dataset, we selected a limited number of important input variables that is 20, which have the highest contribution to agricultural production. All the inputs were considered for the eight-year periods of 2006 to 2013.
There are various measures to different prediction models:
1. RSquare [Coefficient of determination] is simply the square of the sample correlation coefficient (i.e., r) between the outcomes and their predicted values. The coefficient of determination ranges from 0 to 1.
2. RMSE [Root Mean Square Error] is a frequently used measure of the difference between values predicted by a model and the values actually observed from the environment that is being modeled.
IV.
METHODOLOGYA. Proposed Flow
The existing papers involves less number of attributes of Climate data. Instead of that, we will use more number of attributes including soil attributes which had not been considered in previous work. Also, instead of yearly approach, we have done on seasonally basis approach to get more accurate results.
For seasonally basis approach, we divided total dataset in to two seasons 1.Kharif And 2.Summer as groundnut production are more in this two seasons.
For that purpose, we created GUI in java which divides monthly data sets into season wise cluster data and also combine the associated yield dataset of that particular season for all 4 districts. Selection is done by season wise and generates the dataset according to its climatic attributes average and fetches its yield from dataset and then generates result for each year. So basically, it combines 2 datasets and also divides them into season wise of kharif and summer and displays the output results in GUI of each district.
B. Individual effect of Attributes on yield
To find the individual attribute effect on yield correlation is perform on the data. In addition, values of „r‟ and “R square” are generated. From that, we can see that which attribute affect more on yield.
From the values of R Square, it clearly sees that above values of 0.5 depends more on yield and are important attribute to grow of plant so we have considered it.
C. Combined effect of Attributes on yield
We have taken 4 different alternatives from which the different models accuracy measures can be found.
A. Environmental Attributes:
Rainfall, Maximum Temperature, Minimum Temperature, Basic Sunshine, Relative humidity(2 times), Vapor Pressure(2 times), Evaporation Pressure B. Soil Attributes:
Temperature from the different depth of Soil (6) C. Abiotic Attributes:
Water Content (2), Density (2), Wind Speed D. Area Central Attributes:
Total area from which the yield is produced and total production
a) Linear Regression: It is a statistical measure that can be used to determine the strength of the relationship between one dependent variable and a series of other changing variables known as independent variables (regular attributes). If independent variable contains multiple input attributes like in our research (rainfall, sunshine hours, humidity, pH etc), then it is termed as multiple linear regressions. Linear regression provides a model for the relationship between a scalar variable and one or more explanatory variables. This is done by fitting a linear equation to the observed data [7].
b) k-NN: The k-nearest neighbor algorithm compares a given test example with training examples which are similar. Each example denotes a point in an ndimensional space. Thus, all of the training examples are saved in an n-dimensional pattern space. K is a positive integer, usually small. For our purpose, the basic k-NN algorithm was applied. It first finds the k examples from the training set that are closest to the unknown example. Then it takes the most common occurring classification for the k examples [7].
c) Neural Network: An artificial neural network (ANN) is a mathematical model or computational model inspired by the structure and functional aspects of biological neural networks for instance in our brains. In most cases an ANN is an adaptive system that modifies its structure based on external or internal information that flows through the network during the learning phase. The basic neural network model consists of three layers: the input layer, the hidden layer and an output layer [7]. d) Regression Tree: This are commonly used in data mining with the objective of creating a model that predicts the value of a target (or dependent variable) based on the values of several input (or independent variables).In Regression Trees target variable is continuous and tree is used to predict its value.
V.
RESULT ANALYSISIn our research, we determined prediction results for yields of Groundnut crop for the selected districts in Gujarat. The predictions results were obtained according to the selected input attributes using appropriate classification and regression models.
The tool used to provide predictive algorithms, include powerful methods to explore, transform and “clean” data, partition data into “training” and “validation” sets, train one or more machine learning models, and evaluate and compare the performance of those models.
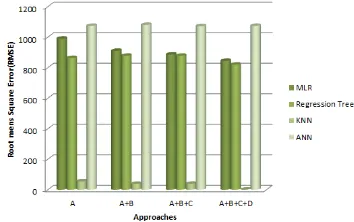
For prediction, four different algorithms are used.
Multiple linear Regression
Regression Tree
K-nearest Neighbor
Artificial Neural Network
Fig. 2. Comparison of prediction algorithms
RMSE values are compared of four different methods for all four different alternatives which are discussed in figure 2.
VI.
CONCLUSION AND FUTURE WORKWeather data has a major role in affecting the Agriculture data of crop yield. For ground nut crop yield prediction, K-nearest neighbor for prediction model gives better Results in training as well as validation for the data then other three techniques which are Artificial Neural network and two regression techniques multiple linear regression(MLR) and Regression tree. Apart from that, if using larger dataset of previous years can also be affect the accuracy of algorithms and can get better accuracy or less RMSE value in future.
VII.
REFERENCES[1] MucherinoPetraqPapajorgji, P. M. Pardalos,”A survey of data mining techniques applied to agriculture”, Springer, 2009.
[2] S.S.Bhaskar, L.Arokiam, V.Arul Kumar, L.Jeyassimaan,”A Brief Survey Of Data Mining Techniques To agriculture Applications”, MadwellJournels, 2010.
[3] Ramesh A. Medar,Vijay. S. Rajpurohit,”A survey on Data Mining Techniques for Crop Yield Prediction”,IJARCSMS, 2014
[4] Hui Chen,WeiWu,Hong-Bin Liu,“Assessing the relative importance of climate variables to rice yield variation using support vector machines”,Springer,2015.
[5] D Ramesh, B Vishnu Vardhan,”Analysis Of Crop Yield Prediction Using Data Mining Techniques”, IJRET, 2015.
[6] D Ramesh, B Vishnu Vardhan, “Crop Yield Prediction Using Weight Based Clustering Technique “, IJCEA, 2015.
[7] A.T.M ShakilAhamed, NavidTanzeem Mahmood, Nazmul Hossain, Mohammad TanzirKabir, Kallal Das, Faridur Rahman, Rashedur M Rahman,”Applying Data Mining Techniques to Predict Annual Yield of Major
Crops and Recommend PlantingDifferent Crops in Different Districts in Bangladesh”,IEEE,2015 [8] D. Ramesh,B Vishnu Vardhan, O
SubhashChanderGoud,” Density Based Clustering Technique on Crop Yield Prediction”IJEEE,2014
[9] Mohammad MotiurRahman,NaheenaHaq, Rashedur M Rahman,”Application of Data Mining Tools for Rice Yield Prediction on Clustered Regions of Bangladesh”,IEEE,2014 [10] D Ramesh, B Vishnu Vardhan,”Data Mining
Techniques and Applications to Agricultural Yield Data”, IJARCCE, 2013
[11] José R. Romero , Pablo F. Roncallo , Pavan C. Akkiraju , Ignacio Ponzoni , Viviana C. Echenique, Jessica A. Carballido,”Using classification algorithms for predicting durum wheat yield in the province of Buenos Aires”, ELSVIER, 2013.
[12] YunousVagh, JitianXiao, "A data mining perspective of dual effect of Rainfall and Temperature on Wheat Yield", ECU, 2012 [13] Parekh, F. P, Suryanarayana, T. M. V ,”Impact
of Climatological Parameters on Yield of Wheat Using Neural Network Fitting”,International Journal of Modern Engineering Research ,2012 [14] Ye, Nong; Data Mining: Theories, Algorithms,
and Examples, CRC Press, 2013.
[15] Data mining Concepts and Techniques; Jiawei Han and MichelineKamber; Second Edition, Morgan kaufmann publishers.
![Fig. 1.Statewise Area Production and production of Groundnut [14]](https://thumb-us.123doks.com/thumbv2/123dok_us/1039809.1129595/2.595.331.536.186.356/fig-statewise-area-production-production-groundnut.webp)