An Efficient Algorithm for Conversion of
Spatiotemporal Big Data
Nagaraj Bhat1, Ramya D Shetty1, Krushna Chandra Gouda2
Assistant Professor, Dept. of CSE, Shri Madhwa Vadiraja Institute of Technology and Management, Udupi, India1
Seniour Scientist, CSIR-Forth Paradigm Institute, Bangaluru, India2
ABSTRACT: In recent years, the vast data are collecting from various sectors like e-banking, Social media, Public and Educational sectors but the climatic sectors has witnessed a steady increase in big data compared to other sectors. This is due to the collected data are spatiotemporal. The spatiotemporal data is huge data because it has multi dimensions .The dimensions, size of the spatiotemporal data are mainly depends on the spatial coordinates and temporal resolution. Hence it makes difficult to handle or analyze in the single platform. Although there are different data format available to handle, but all these are still drawbacks for the studies. Thus in this study, we discussed about the data format called netCDF which is now being used as the standard format and structure for the climatic studies. Finally this paper provides strong reasons for why NetCDF is suitable to handle big data and also how to obtain NetCDF using control file.
KEYWORDS: Spatiotemporal, multi-dimension, Big Data, netCDF, CDO, GrADS.
I. INTRODUCTION
Mobile Although there is a growing interest in the field of climatic studies for analyzing and visualization of the data. The data available are spatio-temporal data and referred as “Big Data”. The spatio-temporal data are data that supports for applications which show both spatial and temporal characteristics. Spatio-temporal databases can be defined as a database that embodies spatial, temporal and captures both spatial and temporal aspects of data. Therefore it have become very important in recent years, as many real world applications like, weather informatics need to store real world data. Many data objects in real world like climatic objects have attributes related to both space and time, and managing them using existing RDBMS is complex and in- efficient, as these objects are multi-dimensional in nature. For example an object which can change its geometry over a period, exhibits both spatial as well as temporal qualities, as it can change its shape at different points in time, as well as the location of the object. Hence, there is a need to store these objects in a very systematic way.
The problem which is faced to store large amount of data is its size. Reducing the size and retaining same amount of data is a complex task. This can be achieved using control file which helps to convert data from one form to another. Thus in this paper we explain how to convert data from one form to another. For example- converting data from binary files (.bin) to netCDF (.nc).
II. RELATED WORK
This is nothing but a study of existing technology in this project and to come up with the better ideology. A variety of research has been done on this field. The summary of various research papers are presented below.
Klein’s paper [1] mainly consists of climate study based on which weather predictions are made. Current work: Here weather data of about last 8 years have been stored, which is used for the weather prediction.
Hughes et al. in 1993[3] discussed about early water prediction in his paper that shows important attributes related to the prediction of precipitation. Similar works on weather prediction were also done by Willett et al. [4],Brown and DE Gaetano paper in 2009 [5]. Thomas Maxwell paper in 2013 [7] provides tool for initial study of climate simulation.
K C Gouda’s paper [2] in 2014 discussed about the Weather forecast which is a user friendly tool. Now, we are so much dependent on Weather forecast that is, right from the farmer to a scientist, we need to understand the variations in climatic selection criteria like Temp, humidity, rain, etc. Information extracted through different sources like Spacecraft, climate Stations, FTP/HTTP server outputs can be easily used and analyzed. In this paper they have nowhere stated about the data conversion.
III. PRIMARY STAGE FOR DATA CONVERSION
Primary stage for Data Conversion is Data Extraction. In data extraction we need to collect Different weather parameters like Humidity, Temperature, Rainfall, wind, Cloud coverage, sea ice concentration, potential evaporation, surface roughness, etc. from multi-sources such as different satellites, work stations etc. Here we need to collect data under one platform and also these data are obtained from different sources using Data retrieval algorithm. This algorithm also ensures uniqueness of the data thus avoiding duplication of data and utilizing the storage space and network bandwidth efficiently. Next step, data downloading- the data which is accessed from various external sources. The data which stored in the central repository are also of different formats like .bin (binary data), .ascii etc. The following code is used to achieve above things.
wget –r - - continue - timestampingURL
Once data is available in our central repository we need to perform Data Merging operation. In this phase, data which are at different locations are combined into only one folder. This single folder is created automatically as well as dynamically. This is done prior to the conversion phase. Finally conversion phase which is described in the next section.
IV.DATA CONVERSION PSEUDOCODE
The two main components of Data conversion phase are
1.
CDO (Climate data operator)-It is an open source software which is freely available.2.
Pthread.dll library – The library file has to be downloaded and copied to syswow64folder.3.
Descriptor File - It is also called as Control file. Using one control file, we can read number of Binary files(or other formdata).The below code which describes how to use CDO and the .ctl file:- startInfo.FileName=
cmd.exe";startInfo.WorkingDirectory=@"C:\Merge\DataRetrieval\bin\Debug\MergeRainfall";
Example for the control file:
dset ^3B42_daily.1998.%m2.%d2.7.bin options template title TRMM 3B42 V7 one day TRMM rainfall undef -9999.9 xdef 1440 linear -179.875 0.25000000
ydef 400 linear -49.8750000 0.25000000 zdef 1 levels 1000
TDEF 60 linear 03Z1jan1998 1dy vars 1 TRMM 0 99
The data descriptor file contains a complete description of the binary data as well as instructions for GrADS on where to find the data and how to read it." This ascii file has the ".ctl" file extension. Sometimes, it is referred to as the 'control file'.
V. ABOUT CDO (CLIMATE DATA OPERATOR)
CDO is a collection of command line Operators to manipulate and analyse Climate and NWP(Network Weather Prediction) model Data.CDO (Climate Data Operator):- CDO consists of various operators which will be used for processing climate data in a standardized way. This is used as an interface for executing UNIX commands in a simple manner. This supports various types of grid and they are tested on many systems which include Cygwin, UNIX/Linux and MacOS-X. CDO (Climate data operator)-It is an easily accessible package which is freely available.
The following CDO command will convert a binary data file to netCDF:
cdo -f ncimport_binaryfile.ctl ofile.nc
The import_binary operator imports gridded binary data sets via a GrADS data descriptor file. GrADS- “Grid Analysis and Display System” version 2.0.2:- The Grid Analysis and Display System (GrADS) is a bilateral desktop tool. GrADS supports different formats of data that includes .bin, .nc etc
When we start downloading all the data which is related to weather they are in binary format and also are of multiple files. When we convert the file .bin into netCDF, everything will appear in one file and the size of the data has been reduced. Which place an major role to minimize, the size of the data.
netCDF is one kind of data type that consists of various software library which helps in retrieving, creating and also to share other scientific data that may be available as an array of data. NetCDF act as a package for storing scientific datasets that includes several array of data. Several datasets are stored in one NetCDF file, that may vary in terms of size and dimensions which would be used to represent the data of different regions. Once the data is in this format it is very easy to analyze and also to visualize.
VI.RESULTS AND DISCUSSION
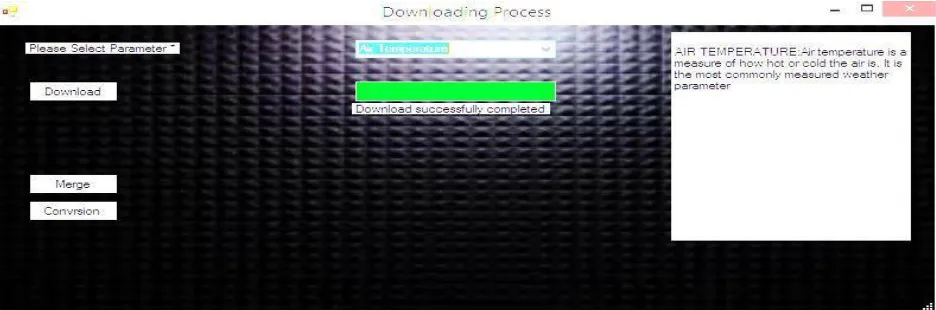
The below figure shows data retrieval algorithm. It basically allows the user to select the parameters like humidity, rainfall, Temperature etc., which is presented in figure 1. In the right side of the window which displays information regarding the parameters. So that user can understand about the parameter easily. There are three buttons in the window they are Download, Merge and Conversion to perform various operations.
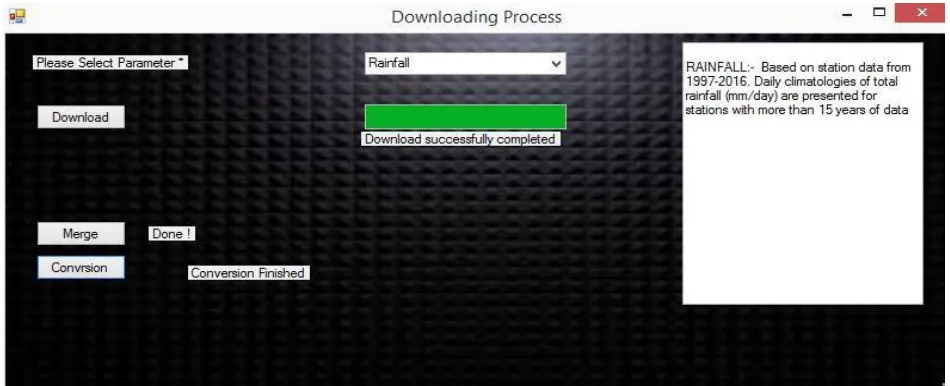
The Data extraction phase is shown in figure 2 below. The below figure shows download process actually running in the backside. The Recursive function which calls recursively so that, downloading will be a continuous process, until it downloads all the data. These downloaded data will be stored by default in the folder for the future use. There is no duplications of data because of the efficient use of algorithm.
Figure 2:- Downloading data from global server.
Once the data is available in our local database, step taken to Merge and Convert data of multi format into single NetCDF format. Same is presented in figure 3 below. Here Merging is done based on the availability of data. Merging is a process where data from the different folders are taken out and placed into one particular folder. So that Conversion phase can make use of those data.
VII. CONCLUSION
The data which we are using is spatio-temporal and multi-dimensional so it is difficult to store and handle by using the normal data format like binary, ASCII and all the data cube operation can be done easily by using netCDF format. Thus we conclude that netCDF as a data format that supports various data cube operations using which the user can get the data of the particular area. So instead of storing BigData directly we can convert and store data using control file to reduce size of data.
REFERENCES
[1] W. H. Klein, Computer prediction of precipitation probability in the United States, Journal of Applied Meteorology 10 (5) (1971) 903–915. [2] K C Gouda, Chowdari K K, Nagaraj Bhat, S N Chandrashekar “Development of a Visualization System for Climate Data Analysis”,
International Journal of Engineering Trends and Technology(IJETT)-volume 13, Number 4 – July 2014.
[3] J. P. Hughes, D. P. Lettenmaier, P. Guttorp, A stochastic approach for assessing the effect of changes in synoptic circulation patterns on gauge precipitation, Water Resources Research 29 (10) (1993) 3303–3315.
[4] K. M. Willett, N. P. Gillett, P. D. Jones, P. W. Thorne, Attribution of observed surface humidity changes to human influence, Nature 449 (7163) (2007) 710–712.
[5] P. J. Brown, A. T. DeGaetano, A method to detect inhomogeneities in historical dewpoint temperature series, Journal of Applied Meteorology & Climatology, vol 48 (11).
[6] Li, D. Sailor, Application of tree-structured regression for regional precipitation prediction using general circulation model output, Climate Research 16 (1) (2001) 17–30.
[7] Thomas Maxwell, “Exploratory Climate Data Visualization and Analysis using DV3D and UVCDAT”. [8] Russ Rew and Glenn Davis, NetCDF: An Interface for Scientific Data Access, Unidata Program Center, in 1990 [9] A.Mcafee, E.Brynjolfsson, (2012) 'Big Data: The Management Revolution', Harvard Business Review. [10] R. Villars, C. Olofson, M.Eastwood, (2011) 'Big Data: What It Is and Why You Should Care', White paper.
[11] J.Manyika, M.Chui, B.Brown, J.Bughin, R.Dobbs, C.Roxburgh, A.H.Byers, (2011)'Big Data: the next frontier for innovation, competition, and productivity', xxx