ABSTRACT
GREGORY III, SAMUEL THORNE. Differences in Sediment Organic Matter
Composition and PAH Weathering Between Non-Vegetated and Recently Vegetated Fuel-Oiled Sediments. (Under the direction of Elizabeth Guthrie Nichols and Damian Shea).
Previous results have shown a strong correlation between vegetation and dissipation of
polycyclic aromatic hydrocarbon (PAH) contamination over long time frames. Evidence of
phytoremediation over shorter time frames is difficult to detect, particularly in sites where
overall PAH concentrations have not begun to significantly decrease. This study assessed
the impact of vegetation on a highly contaminated sediment over a short time frame in
order to track the effects of plant derived organic carbon (PdOC) in a variety of sediment
compartments. The Indiana Harbor Canal is an industrialized area with historic petroleum
contamination of near-shore sediments. In 2002, near-shore sediments were planted with
hybrid poplar and willow trees as part of a phytoremediation treatability study. Site
disturbance allowed for colonization by cattails and Phragmites. In 2004, non-vegetated
and vegetated oiled-shore sediments were collected and analyzed for 42 polycyclic
aromatic hydrocarbons (PAHs), total organic carbon, and percent modern carbon (Δ14C
radiocarbon). Sediments were collected from several locations, field-composited,
homogenized, sieved, and chemically fractionated. There is a significant input of modern
carbon in both labile and recalcitrant fractions of vegetated sediments that is absent in the
non-vegetated control. Phragmites sediments contained more modern carbon (plant
carbon) and more weathered PAH ratios than willow, cattail, and non-vegetated sediments.
Organic carbon-normalized PAH concentrations were greater in Phragmites humin than
humin, but modern carbon values were not always different. Cattail humin contained more
modern carbon than non-vegetated humin, but only de-ashed humin was more weathered
than non-vegetated de-ashed humin. Results show that sediment composition and PAH
weathering indices are not indicative of reduced PAH concentrations. Instead, PAH
weathering appears related to increased modern carbon (plant carbon) content. Substantial
increases in modern carbon content were observed after two years of plant growth. These
results suggest that PdOC is diffusing into a variety of sediment compartments where it
Differences in Sediment Organic Matter Composition and PAH Weathering
Between Non-Vegetated and Recently Vegetated Fuel-Oiled Sediments
By
Samuel Thorne Gregory III
A thesis submitted to the Graduate Faculty of North Carolina State University
In partial fulfillment of the requirements for the Degree of
Master of Science
Toxicology
Raleigh, North Carolina
2007
APPROVED BY:
. . . .
Dr. Elizabeth Guthrie Nichols Dr. Damian Shea
Co-Chair of Advisory Committee Co-Chair of Advisory Committee
. .
ii
BIOGRAPHY
Samuel Thorne Gregory III. (or just Thorne) was born on July 17, 1980 in Wilson
N.C. Being born a little early, he ended up a Cancer instead of a Virgo as was expected.
His first 12 years were spent in the town of Dunn, N.C., known more for its physical
location (at the intersection of 421 and I-95) than any special characteristics about the
place. After spending many hours in the Dunn public library, Thorne moved to New Jersey
where he received all but one year of his mandatory education before moving back to
Sanford N.C. for his final year of high school. Thorne then enrolled at the University of
North Carolina, like his parent and grandparents before him. He graduated in 2002 with a
B.S. in chemistry but decided that the synthetic inorganic research he had been pursuing
was not what he wanted to do for the rest of his life. In fact, it was the warning labels on
the reagents that caught his attention, so he enrolled in the graduate program in Toxicology
at NCSU. Thorne is an avid biker, runner, and a voracious reader. His previous jobs
include reptile breeder, disk jockey for both FM and AM radio stations, computer repair
technician, and teaching assistant. When asked what it was like to wrangle cold blooded
creatures with brains the size of a pea, or about the monotony of hearing the same thing day
iii
AKNOWLEDGEMENTS
I would like to thank everyone who supported me and my research during this time.
First, I would like to thank Dr. Elizabeth Nichols for taking me on as a graduate student
before she had even unpacked her office and for all of her expertise and patience. I would
also like to thank Dr. Damian Shea for his advice and generous laboratory contributions.
Dr. Neal Blair is also deserving of acknowledgement for his isotopic expertise and
willingness to answer questions that were far beneath his own understanding. A special
thanks goes out to Pete Lazaro for all his laboratory expertise and patience, as well as to
Steve Rock at the EPA for graciously tour guiding our sampling trips. All of the
undergraduates that have assisted at one time or another: Evan Dzierzynski, Shervin Ejali,
Zach Eyler, and Carter Reeb, thank you all for your time and efforts. Thanks also to Dr.
Chris Hofelt for his time and assistance. I would also like to thank my family and friends
who have all endured the trials and tribulations with me. Finally I would like to thank the
National Science Foundation for their generous support of this and many other projects
TABLE OF CONTENTS
Section Page #
List of Tables……… vi
List of Figures………... vii
1. LITERATURE REVIEW………. 1
1.1 Polycyclic Aromatic Hydrocarbons. Risks and Accessibility………... 1
1.2 PAHs in Soils and Sediments………. 2
1.3 Mediators of PAH Dissipation; the rhizosphere and associated microbial populations……….. 4
1.4 Enhanced PdOC flux into PAH contaminated sediments in response to root stress……….. 6
1.5 Field Studies of Phytoremediation of PAHs………... 8
1.6 Chemical Fractionation in PAH studies……….. 9
1.7 Using Carbon Isotopic techniques to probe for PdOM sediment modification………... 10
1.8 Phragmites australis………... 11
2. MATERIALS AND METHODS……….. 12
2.1 Site Description and Sampling Methods………. 12
2.2 Sediment Fractionation………... 14
2.3 OM Composition……… 15
2.4 FTIR Analysis………. 16
2.5 GC/MS SIM……… 16
2.6 Statistical Analyses………. 16
3. RESULTS………. 19
3.1 Impact of Vegetation on Sediment Composition……….……... 19
3.2 PAH Concentrations in Sediment Fractions……….………….. 20
3.3 PAH Weathering and Sediment Composition……….…………... 21
3.4 Phragmites’ ability to colonize contaminated sediment………..……..…. 23
4. DISCUSSION………... 40
5. CONCLUSIONS……….. 43
6. FUTURE WORK……….. 44
7. REFERENCES………. 46
LIST OF TABLES
Table Page #
Table 1. Inventory of 42 Alkylated and non-Alkylated PAHs………. 18
Table 2. Individual PAH concentrations across the study sites for Bulk Sediment…. 33
Table 3. Individual PAH concentrations across the study sites for humin…………... 35
Table 4. Individual PAH concentrations across the study sites for de-ashed humin… 37
Table 5. TPAH concentrations normalized to sediment mass and OC………. 39
LIST OF FIGURES
Figure Page #
Figure 1. Selected FTIR spectra of Indiana Harbor Sediment Fractions………. 24
Figure 2. %TOC and PMC of bulk sediment and humin fractions of
vegetated and non-vegetated samples of Indiana Harbor Sediment………. 25
Figure 3. Individual PAH concentrations for the non-vegetated
zone for bulk sediment, humin, and de-ashed humin ……….…. 26
Figure 4. Individual PAH concentrations for the phragmites dominated
zone for bulk sediment, humin, and de-ashed humin……….…….. 27
Figure 5. Individual PAH concentrations for the cattails dominated
zone for bulk sediment, humin, and de-ashed humin……….….. 28
Figure 6. Individual PAH concentrations for the willow dominated
zone for bulk sediment, humin, and de-ashed humin………... 29
Figure 7. Cross plots of C3-naphthalenes to C2-phenanthrenes (N3/P2)
alkylated PAH homologues to percent Total Organic Carbon (% TOC) for sediment and humin fractions of vegetated and non vegetated
sediments at the Indiana Harbor Canal site……….. 30
Figure 8. Cross plots of C3-naphthalenes to C2-phenanthrenes (N3/P2)
alkylated PAH homologues to. Percent Modern Carbon (PMC) for sediment and humin fractions of vegetated and non vegetated sediments
at the Indiana Harbor Canal……….. 31
Figure 9. Phragmites australis and cattails (Typha angustifolia)growth
in greenhouse containers. Plants were rooted in clean soil that was placed on top of Indiana Harbor Canal sediment. Phragmites grew around and
into the oiled sediment, where as cattails did not………. 32
CHAPTER 1. LITERATURE REVIEW 1.1 Polycyclic Aromatic Hydrocarbons. Risks and Accessibility
Polycyclic Aromatic Hydrocarbons (PAHs) are persistent organic contaminants with a
variety of acute, chronic, mutagenic, and carcinogenic effects (Durant et al., 1996, 1999,
Cavalieri et al., 1988). PAHs are byproducts of both incomplete combustion processes,
forming pyrogenic PAHs, and catagenesis reactions, creating petrogenic PAHs (Fernandes et
al., 2003; Tissot et al., 1978). High concentrations of petrogenic PAHs are often found in
residual soils and sediments at sites of historical petroleum transport and refining. The
contaminant levels at many sites often exceed environmental regulations and can encompass
large areas making them difficult to remediate with standard technologies. Alternative
treatment options at PAH contaminated sites that are less invasive and expensive are of great
interest to a variety of regulatory groups and private industries. One such treatment option is
phytoremediation, or the use of vegetation to mitigate the environmental impacts and risks of
soil and water contamination. A variety of studies have investigated plants and their associated
microbial communities for the in situ treatment of organic contaminants, such as PAHs, in soils
and sediments (Widdowson et al., 2005; Davis et al., 2002; Mueller et al., 2006).
The overall risk associated with any level of sediment contamination is highly
dependent on the bioavailability of the compound. The more bioavailable a contaminant, the
more likely it will cause a deleterious effect on any given organism. It is the structure and
lipophilicity of a given compound that determines its overall bioavailability and thereby plays a
major role in the efficacy of phytoremediation of the contaminant (Binet et al., 2000). More
bioavailable and water soluble contaminants are generally more accessible to microorganisms
and therefore more likely to be metabolized. Bioavailability also depends on the aging and
environmental weathering of the contaminant (Hatzinger et al., 1995; Erickson et al., 1993),
and the physical properties, such as organic matter and particle size, of the sediment in question
(Pignatello, 1989). As contaminants age, they preferentially diffuse into sediment pores and
absorb into or are adsorbed onto sediment organic matter in matrix pores where they can then
be incorporated into stable soil/sediment organic matter phases (Ehlers et al., 2003).
The fraction of PAHs in sediments that are currently or potentially available to living
organisms is known as the bioaccessible fraction (Semple et al., 2004). This fraction differs
from the “bioavailable” fraction; bioavailability more specifically denotes the contaminant
fraction that is available to cause deleterious effects to organisms when the organism is in
contact with the contaminated media. This system is further complicated by dynamic inputs of
new plant derived organic carbon. PdOC may enhance rates of PAH degradation by
stimulating microbialactivity and/or by increasing PAH bioavailabilityin the rhizosphere
(Binet et al., 2000).
1.2 PAHs in Soils and Sediments
Soils and sediments are highly heterogeneous with respect to organic matter
composition, carbon structures, and sorptive properties. Several researchers have evaluated the
binding affinities of functionally different carbon containing compartments of sediments to
non-ionic contaminants (Luthy et al., 1998; Hundal et al., 2001; Chen et al., 2005; Rockne et
al., 2002). To understand the risks created by PAH contamination in soils and sediments, it is
necessary to characterize the potential accessibility of PAHs in various sediment fractions.
Many components of sediment may have a significant impact on PAH sorption and
therefore affect bioavailability and bioaccessibility. For example, black carbon (BC) is
ubiquitous in many types of sediment and may compose a significant portion of lighter
density fractions of sediments. BC is a type of OC created from the incomplete combustion
of organic matter. Because of the highly condensed, aromatic nature of BC, it may
significantly decrease bioavailability of PAHs in sediments that have high BC contents.
Black carbon has been shown to have a much greater affinity for PAH sorption than
sedimentary organic matter in general (Accardi-Dey and Gschwend, 2001).
Another dominant set of compounds, as pertains to PAH accessibility in sediment
fractions, is derived from PdOC. Plant detrital material has been shown to be a strong sorbent
for PAHs (Chen et al., 2005; Sachleben et al., 2004, Chefetz et al., 2000). Although PdOC is
an excellent sorbent for aromatic hydrophobic contaminants, it is also most available for rapid
turnover by microorganisms. PdOC may enable unavailable PAHs to diffuse into more
available, labile sediment compartments. PAHs may adsorb to labile plant exudates and other
plant derived compounds. Many of these compounds are rapidly metabolized by sediment
microorganisms. Consequently, PAHs associated with these rapidly cycling compounds may
by accessible for microbial degradation.
Interactions between sedimentary sorbates such as BC or PdOC can further
complicate the dynamics of PAH sorption. Hong et al. (2003)analyzed sorption of PAHs
in soil contaminated with lampblack and oil. BC containing low levels of PAHs
demonstrated sorption similar to BC models while lampblack with high levels of PAHs
demonstrated sorption similar to that expected in a coal tar mixture. When oil was added to
the BC, sorption sites were coated and sorption of PAH to the BC surface structure was
diminished. This same behavior has been observed when natural organic matter is added to
BC. Carter et al. (1994) found that the absorptive capacity of BC, when exposed to natural
organic matter, was significantly reduced. This implies that a variety of competing sorbates
can effectively “coat” the BC particle and reduce the number of potentially available
sorptive sites for PAHs. Because BC reduces bioavailability and bioaccessibility, blocking
access to BC sorptive sites would therefore result in increased PAH availability.
PdOC may also make BC-sorbed PAHs more bioaccessible. When PdOC and BC
come into contact in sediments, it is reasonable to expect that PAHs may diffuse from BC
into more labile PdOC. It is also possible that enhanced carbon cycling caused by labile
PdOC inputs may cause BC mineralization. The mechanisms by which BC is transformed
in sediments is poorly understood, but it is possible that overall increases in carbon cycling
in sediment due to PdOC inputs may include BC mineralization. These circumstances
would explain how older, more recalcitrant PAHs may be mobilized by inputs of PdOC and
made more accessible for biodegradation.
1.3 Mediators of PAH Dissipation; the rhizosphere and associated microbial populations
The area where plant roots, plant exudates, and contaminated media physically interact
is termed “the rhizosphere” (Grayston et al., 1996). Rhizosphere soil is a zone of enhanced
microbial activity that is fueled by labile carbon from plant exudates. Rhizosphere soil also has
enhanced microbial populations due to the physical support that root surfaces provide.
Microbial populations in the rhizosphere are often 5 to 100 times that of surrounding soils
(Liste and Prutz, 2006). Rhizosphere microbial populations may be responsible for enhanced
degradation of PAHs in vegetated sediments. Microorganisms living in the rhizosphere that
can attack and metabolize aged residues may be a primary means by which plant communities
are able to dissipate weathered organic contaminants. Recent work has shown that some
microorganisms are able to desorb and biodegrade aged contaminants from less available
compartments by producing surfactants and other compounds that enhance the accessibility of
weathered compounds (Park et al., 2001). PdOC may therefore enhance bioaccessibility of
PAHs in the rhizosphere in 2 ways: first by acting as a more labile sorbent for PAHs, and
second, by fueling the production of microbial compounds that enhance accessibility.
Some studies have shown a significant effect on PAH mitigation specifically in the
rhizosphere (Anderson et al 1993, Shimp et al 1993). In one particular study, PAH was
sprayed on a quartz sheet in a monolayer and a root was allowed to grow over the treated
surface of the sheet (Thoma et al., 2005). Fluorescence measurements quantitatively
determined that PAH concentrations declined in the area of the quartz plate adjacent to the
root over time. These findings suggested that the root directly contributed to PAH removal;
however, whether PAH depletion occurred by physical diffusion into labile plant derived
components or microbial degradation by root-associated microorganisms was unclear.
Proposed mechanisms by which PdOC may decrease levels of extractable contaminant
are (1) enhanced sorption onto labile PdOC leading to accelerated sequestration, or (2) greater
microbial density and activity along the root surfaces. Alternatively, a combination of these
two hypotheses may be responsible; PAHs may diffuse into new labile organic carbon from
more recalcitrant, mineralized compartments and become more available to microbial
communities for metabolism. White et al (2003) found that addition of organic acids
considerably enhance desorption of DDE from weathered soils.Low molecular weight organic
acids, some of which are exuded from plant root systems to enhance mineral availability,
disrupted the SOM and mediated a temporary increase in availability of organic compounds
that were previously unavailable. Thus, release of PdOC, including organic acids, into
sediments may increase PAH bioaccessibility (Brogan et al., 2003; Liste and Alexander, 2000).
Plant-derived materials demonstrate different sorptive affinities for PAHs (Salloum
et al., 2002; Chen et al., 2005; Chefetz et al., 2000). Plant cuticle, an aliphatic biopolymer,
has greater organic carbon sorption coefficients (Koc values) for PAHs than lignin or
cellulose (Salloum et al., 2002; Chefetz et al., 2000). Mao et al. (2002) observed that the
sorption capacity of some cuticular, aliphatic plant materials correlated well with PAH
sorption capacity in soils. Kukkonen et al. (2003) observed a positive correlation between
rapid PAH desorption from sediment and the presence of plant materials such as lipids and
lignin. Rockne et al. (2002) observed that sediment fractions containing course plant
detrital material had greater log Koc values for PAHs and desorbed more PAHs than other
sediment fractions. Interestingly, greater desorption was observed for larger PAH analytes
such as pyrene, chrysene, and benzo[a]pyrene as well as two and three ring PAHs in
sediments containing plant detrital material (Shor et al., 2003).
1.4 Enhanced PdOC flux into PAH contaminated sediments in response to root stress.
PdOC loss to sediments and its effect on rhizomal bacterial growth is a probable
mechanism by which vegetation attenuates impacts organic contaminants in sediments. Numerous
factors can have an affect on plant exudation rates, which can therefore mediate the overall impact
of vegetation. For example, both plant species and plant age dramatically impact exudation by
plant roots. Mature specimens of several species of dominant or co-dominant northern hardwood
trees showed dramatic variations in variety and quantity of carbohydrate and organic acid
exudation between species (Smith, 1976). A study by Leyval et al. (1993) also found significant
differences in carbon exudation in vegetation depending on age. Older trees were found to exude
less soluble organic carbon than trees that were less than one year old. Environmental factors can
also influence the exudation rates of PdOC (Grayston 1996). Dehydration stress (Reid, 1974,
1977) also caused greater soluble carbon exudation rates. In this study, 14C labeled vegetation
released more carbon when their root systems were exposed to water stress. 14C labeled plant
compounds were also translocated to the roots in greater quantities in roots undergoing water
stress. Several studies have shown that modulating temperature above and below a normal growth
range can also cause enhanced exudation of carbon from roots (Husain et al., 1963; Meharg et al.,
1998). Therefore, enhanced translocation and exudation of PdOC may occur as a stress reduction
method to respond to non-specific root stress.
Liste et al. (2006) andKmentová and Kummerová (2004) showed significant root stress on
a wide variety of seedlings in weathered PAH contaminated soil. As PAHs cause a non specific
stress on the root system, one would expect that PAH contaminated sediments would enhance
exudation of PdOC. Increased PdOC could stimulate the microbial community and enhanced
co-metabolism of PAHs or accelerate binding activities that may decrease PAH bioaccessibility in the
SOM. Either of these outcomes would have important ramifications for phytoremediation
technologies and treatments in the future. This response must be shown definitively in field
relevant trials. Many studies have explored the PAH-plant relationship and demonstrated that
PAHs induce plant stress (Ryan et al., 1988; Liste et al., 2006). However, it is unclear if PAH
contamination causes a specific response that enhances PdOC flux rather than non-specific root
stress.
Microorganisms may also increase plant exudation by consuming plant exudates in the
rhizosphere (Barber et al., 1977). Plants benefit from microbial turnover of root exudates and
subsequent co-metabolism of soil organic matter, which releases nutrients and enhances soil
fertility. Benefits from microbial biomass on root systems include mycorrhizal associations that
cause enhanced uptake of trace elements and rhizomal bacterial that inhibit the growth of some
plant pathogens (Raaijmakers. 1997).
1.5 Field Studies of Phytoremediation of PAHs
Field and laboratory studies of polycyclic aromatic hydrocarbon (PAH) phytoremediation
have yielded mixed results with regards to PAH degradation. Sediment contaminated with
petroleum sludge is often remediated with tillage and nutrient addition. This technology, called
landfarming, is designed to promote microbial degradation of hazardous compounds. During
landfarming, the presence of plants can cause a marked decrease in contaminant levels (Schwab
and Banks, 1994). Most short term studies evaluated PAH attenuation within a single growing
season after vegetated and non-vegetated soils were amended with specific PAH analytes. Some of
these studies showed that vegetation did not significantly degrade PAHs relative to non-vegetated
controls (Lalande et al., 2003; Mueller et al., 2006). Other studies did show significant reductions
in PAH concentrations within a few months (Aprill and Sims 1990; Spriggs et al., 2005; Maila et
al., 2005; Alvarez-Bernal et al., 2007; Jouneau et al., 2005). Some greenhouse studies showed that
dissipation of PAHs was greater in the presence of plants than in their absence and that the uptake
of PAH into plant tissues did not account for PAH attenuation. Over a four week growing period,
Corgie et al. (2004) observed lower concentrations of pyrene in soil directly adjacent to plant roots
relative to soil away from vegetation. Banks et al. (1999) also observed significant reductions in
labeled PAH concentrations in planted soils versus non-planted soils; their tracer studies also
showed that loss of PAH was not the result of abiotic sorption to root structures. Miya and
Firestone (2001) proposed that enhanced PAH degradation in soils impacted by root exudates and
root debris resulted from rhizo-stimulated heterotrophic, bacteria populations capable of PAH
degradation. However, Jouanneau et al. (2005) observed less pyrene mineralization in soils
amended with both plants, Phragmites australis, and a pyrene-degrading Mycobacterium bacteria
compared to soils amended with only pyrene-degrading Mycobacterium bacteria.
A long-term study reported significant PAH reductions in the presence of mixed
vegetation after 12 years exposure in field lysimeters (Doick et al., 2005). Significant
declines in PAH concentrations were also observed in creosote-contaminated soils after
three to four years of hybrid poplar growth at a former creosote facility field site (Marr et
al., 2006; Widdowson et al., 2005; Pitterle et al., 2005). Declines in PAH concentrations
were observed for only the two and three-ring PAH analytes at the creosote site
(Widdowson et al., 2005). In another long term study, when mulberry root extracts were
added to sediments aged with 14C-phenanthrene for 518 days, root-amended soils
mineralized more phenanthrene and sequestered more 14C label in humin relative to sterile
controls (Kamath et al., 2005) The authors proposed that continuous addition of organic
matter (mulberry exudates) enhanced phenanthrene dissipation by two possible
mechanisms: (1) enhanced microbial populations that enhance biotic degradation and/or (2)
increased phenanthrene partitioning into more available OM compartments via
destabilization of the humic matrix.
1.6 Chemical Fractionation in PAH studies
Humic fractionation is a fractionation method that relies on separation of sediment
constituents based on chemical behavior to probe sediment carbon structure and functional
properties (Gregory et al 2005, Kőgel-Knabner and Zeigler 1993). Brogan et al. (2003)
showed that increasing total organic carbon content leads to decreased PAH bioavailability for
microbial degradation in phenanthrene spiked sediments. Over the course of the experiment,
availability also showed some correlation with fulvic acid content. Spiking sediments with
fulvic acids enhanced microbial mineralization of PAHs, albeit, temporarily; mineralization
increased when fulvic acid was added to soils with low fulvic acid content. Liste and
Alexander (2000) found that PdOC enhanced extractable concentrations of PAH when added to
sterilized soils. These findings suggest that chemically labile biogenic carbon fractions like
humic and fulvic acids can alter soil/sediment organic matter and enhance PAH
bioaccessibility.
Previous work has used chemical fractionation to investigate PdOC impact on PAH
attenuation in labile and recalcitrant humic fractions of sediments (Neiman et al., 1998; Guthrie et
al., 1999), particularly sediment and soil humin. Humin is generally defined as recalcitrant
sediment material that remains in an insoluble form after alkaline treatment that removes the humic
and fulvic organic acid fractions (Stevenson 1982). Humin accounts for a large portion of PAH
sorption (Pan et al. 2006, Kohl and Rice. 1997), and is generally considered to desorb PAHs slower
than other fractions (Dexter and Pavlou, 1978; Murphy et al., 1990, 1992).
1.7 Using Carbon Isotopic techniques to probe for PdOM sediment modification
Using the known natural abundances of radioactive carbon isotopes, it is possible to use
carbon isotopic signatures as a probe for biological activity. Petrogenic PAH contamination is
composed of plant derived carbon that has been buried for geologically significant timeframes in
order to undergo the catagenetic processes involved in petroleum hydrocarbon production. These
compounds are therefore highly depleted in unstable carbon isotopes. 14C levels in petroleum
hydrocarbons are extremely low and can therefore be used as a reverse tracer. Cheng et al. (1993)
demonstrated that pulses of 14C labeled CO2 were successfully incorporated into plant structures
and the 14C signature was tracked into root exudates and other PdOC in the rhizosphere.
Furthermore, this study demonstrated that, following incorporation into plant structures, evolved
14CO
2 was a by-product of microbial respiration caused by microbial ingestion and metabolism or
labeled PdOC in the rhizosphere. Isotopic information on vegetated contaminated and pristine
sediments are of interest when determining to what extent plants release increased amounts of
PdOC when exposed to PAH contamination.
1.8 Phragmites australis
Phragmites australis isof particular interest in this study for several reasons. First,
Phragmites is able to withstand harsh conditions and stress (Lissner et al., 1997). This
species has been shown to be tolerant of high metal, phenolics, and azo dye concentrations
(Davies et al., 2005). Phragmites australis has also been found at PAH-contaminated sites,
and is responsible for much of the natural vegetation of these sites (Windham et al., 2001;
Ye et al., 2003). Phragmites has also been shown to produce significant amounts of PdOC
in sediments where it has become established (Brix et al. 2001). Ravit et al. (2006) found
that Phragmites australis does not have a significant difference in microbial community
diversity and functional ability when compared to Spartina alterniflora, even though there
are significant differences in root structure and fine root biomass between these two
wetland plants. Bacterial communities in wetlands sampled in this study were mainly a
function of the sediment type and anthropogenic disturbance than plant species.
We previously reported that the presence of plant carbon in Phragmites distillate
waste sediment was associated with significant reductions of total PAH concentrations
(TPAH) and with increased PAH weathering indices (Gregory et al., 2005). Reductions of
[TPAH] and inputs of plant, or modern, carbon were as great if not greater in Phragmites
humin fractions as Phragmites bulk sediments. At this particular site, several decades of
Phragmites colonization and propagation altered the sediment organic matter (SOM)
composition of distillate waste, reduced total PAH concentrations, and increased PAH
weathering. Would similar changes occur after only two years of plant growth in
petrogenic-contaminated sediments?
The purpose of this study was to better understand changes to PAH attenuation in
vegetated sediments after only a few years of plant growth. We collected sediments from
vegetated and non-vegetated areas at a site with historic fuel-oil contamination. PAH
concentrations, PAH weathering indices, and organic matter composition in sediments
colonized by Phragmites, cattails, or willow trees were compared to the same indices for
non-vegetated sediments. We hypothesized that sediment fractions with measurable
increases in plant organic matter (POM) content would likewise show measurable changes
to sediment organic matter composition and PAH attenuation as indicated by more
weathered PAH diagnostic ratios or reduced PAH concentrations. We hypothesize that
enhanced flux of PdOC in sediment fractions is the primary mediator of PAH dissipation
and should be detectable after only 2 years.
CHAPTER 2. MATERIALS AND METHODS
2.1 Site Description and Sampling Methods.
The Indiana Harbor Canal (IH) is located in a heavily industrialized section of Gary,
Indiana. Total petroleum hydrocarbon (TPH) concentrations range from 2% to 43% of
sediment mass; eight samples of oiled-shore sediments collected in 2001 had mean PAH
concentrations of 4,100 ppm (Sand Creek Consultants, Inc., 2002). Diesel fuel is the
predominant petrogenic contaminant source at the site, and, for decades, workers have
noticed a persistent petroleum sheen in canal waters. In 2002, several varieties of hybrid
poplars and willows trees (Salix exigua) were planted in near shore sediments as part of a
phytoremediation treatability study. Disturbance of the site resulted in colonization by
Phragmites australis, the common reed plant, and Typha latifolia, cattails. Sediment
analyses in 2004 showed that PAH contamination for oiled-shore sediments was greatest in
the first 5 inches of sediment (personal communication, Steve Rock, USEPA).
Sediment samples were collected by removing approximately 10 cm of
sediment by hand trowel or shovel within a 2 m diameter of vegetated or non-vegetated
sediments. Sediment samples were collected at 6 to 9 locations for each plant species and 3
locations of non-vegetated sediments. Non-vegetated sediments were composited at the site
prior to storage and transport. In vegetated areas, plant litter and debris were removed from
the sediment surface after which sediments with plants roots were removed in toto. Visible
plant roots and plant material were removed from sediments prior to mixing sediments
together for each plant species. Sediments were transported in plastic bags at 0 C. Prior to
chemical fractionation and analyses, small visual root residuals were removed, and
sediments were sieved (2mm) and homogenized again in ceramic bowls.
2.2 Sediment Fractionation.
Aliquots of bulk sediment (10-15 g.) were first freeze-dried and weighed to obtain
sediment masses, then chemically fractionated to obtain bulk sediment, humin, and
de-ashed humin fractions. Chemical fractionation proceeded as follows: First, sediments were
weighed and lipid extracted with 20 mL of a 4:1 mixture of dichloromethane: acetone on a
shaker table for 24 hours. Solvent was decanted and sediments were again extracted with
20 mL of a 4:1 mixture of dichloromethane: acetone for 24 hours. Solvent fractions were
combined and this extract is referred to as the bulk sediment extract. Sediments were then
extracted with a 0.1 N sodium hydroxide (NaOH) solution for 24 hours, with the headspace
of the tubes purged with N2(g). This treatment extracted the humic and fulvic acids from
the sediment and destabilized the sediment matrix. NaOH was decanted from the sediments
after 24 hours and sediments were lipid extracted with 20 mL of dichloromethane for 24
hours. Solvent was decanted and sediments were again extracted with 20 mL of
dichloromethane for 24 hours. Solvent fractions were combined and this extract is referred
to as the bulk humin or humin extract. Sediments were then extracted with a 10% solution
of hydrogen fluoride: hydrochloric acid (HF:HCl) solution for 7 days, with the headspace of
the tubes purged with N2(g). This treatment dissolves the mineral matrix of the sediment
and further destabilized the sediment matrix. The HF:HCl solution was decanted from the
sediments after 24 hours and sediments were lipid extracted with 20 mL of
dichloromethane for 24 hours. Solvent was decanted and sediments were again extracted
with 20 mL of dichloromethane for 24 hours. Solvent fractions were combined and this
extract is referred to as the HF humin or de-ashed humin extract. Preferential loss of larger
alkylated PAH homologues due to the chemical fractionation procedure of sediment has
been evaluated and discussed previously (Gregory et al., 2005). Because sediments also
contain significant metal contamination (Sand Creek Consultants, Inc. 2002), conductivity
measurements of Phragmites and non-vegetated bulk sediments were determined using
extracts of sediment/water ratios (Rhoades, J.D., 1996) and a YSI Model 85 multi probe
meter (Yellow Springs, OH).
2.3 OM Composition.
Replicate aliquots of bulk sediment, humin, and de-ashed humin fractions were
analyzed for percent organic carbon (% OC) using an SOP NC 2100 CHN Analyzer
(Thermo Electron S.p.A., Milan, Italy). Sediment samples were sent to The Lawrence
Livermore National Laboratory (Livermore, CA) for standard radiocarbon dating analysis.
Sediment fractions were combusted to CO2 then reacted with a Fe/H2 catalyst to form
graphite. Samples were analyzed by Accelerator Mass Spectrometry (AMS) with standards
(NBS Oxalic Acid I and II (NIST-SRM-4990, 4990c) and blanks for organic carbon
samples (Johnson-Mathey 99.9999% graphite powder). Splits of combusted samples were
taken for 13C analysis to correct AMS values (Stuiever and Polach, 1997). Data is
expressed as the percent modern carbon (14C PMC) determined from the measurement of
fraction modern that is the deviation of the 14C/C ratio of a sample from “modern” (Stuiever
and Polach). Petroleum contains very little 14C activity (14C PMC ̴ 0%) because of its
ancient origin; whereas, modern plant carbon and recent humification of modern plant
carbon will reflect modern 14C activity (14C PMC ̴ 100%) from atmospheric 14CO 2.
2.4 Fourier Transform Infra-Red Specrtoscopy.
Approximately 1mg of freeze dried, fractionated sediment was ground with
approximately 0.1g of Potassium Bromide (KBr) and pressed into a pellet using a manual
press. Spectra were then collected on a Nicolet Impact 400 FTIR (Nicolet, Madison,
Wisconsin). Spectra were recorded by co-addition of 32 spectra with a resolution of 4 cm-1.
2.5 Gas Chromatography/Mass Spectroscopy with Select Ion Monitoring.
Extracts of bulk sediment, humin, and de-ashed humin were first loaded onto neutral
activated alumina columns prior to analysis by Gas Chromatography/Mass Spectroscopy
(GC/MS). Extracts were concentrated to 5 mL, split for archival purposes, and then spiked
with deuterated phenanthrene (d10, 500 ng/mL) and benzo[a]pyrene (d8, 505 ng/mL) as
internal standards. Extracts were analyzed for 42 PAHs using a modified method of EPA
8270 EPA 8270 (US EPA, 1986b) similar to that employed by Luellen and Shea (2002).
GC/MS select ion monitoring (SIM) mode analyses were conducted on a HP5890 Series II
GC equipped with electronic pressure control connected to an Agilent 6890 using a Restek
30 m × 0.25 mm Rtx-5 (film thickness 0.25 m) MS w/Integra-Guard column. PAH
homologues that were quantified using this method are listed in Table 1.
2.6 Statistical Analyses.
Statistical significance was determined by Dunnett's ANOVA (p < 0.05) (Dunnet,
1955, 1964) by which multiple means of vegetated data sets were compared against
non-vegetated controls. Student t-tests were also performed to determine statistical significance
between different vegetated sites. Unless otherwise noted, triplicate samples were used to
determine the averaged recoveries of PAHs in sediment extracts and total organic carbon
present in sediment samples. Values in tables represent the mean of measurements ± one
standard deviation.
3 P4 C4-phenanthrenes/anthracenes 3 P3 C3-phenanthrenes/anthracenes 3 P2 C2-phenanthrenes/anthracenes 3 P1 C1-phenanthrenes/anthracenes 6 Co coronene 3 P0 phenanthrenea 6 BgP benzo[g,h,i]perylenea
3 AN anthracenea
5 DA dibenz[a,h]anthracenea
3 D3 C3-dibenzothiophene
6 IOP indeno[1,2,3-cd]pyrenea
3 D2 C2-dibenzothiophene 5 Pryl perylene 3 D1 C1-dibenzothiophene 5 BaP benzo[a]pyrenea
3 D0 dibenzothiophene
5 BeP benzo[e]pyrene
3 F3 C3-fluorenes
5 BkF benzo[k]fluoranthenea
3 F2 C2-fluorenes
5 BbF benzo[b]fluoranthenea
3 F1 C1-fluorenes 4 C4 C4-chrysenes 3 F0 fluorenea 4 C3 C3-chrysenes 2 N4 C4-naphthalenes 4 C2 C2-chrysenes 2 N3 C3-naphthalenes 4 C1 C1-chrysenes 2 N2 C2-naphthalenes 4 C0 chrysenea 2 N1 C1-naphthalenes 4 BaA benz[a]anthracenea
3 Dfu dibenzofuran 4 Re retene 3 ACE acenaphthelenea 4 FP1 C1-fluoranthenes/pyrenes 3 ACL acenaphthylenea 4 PY pyrenea 2 BP biphenyl 4 FL fluoranthenea 2 N0 naphthalenea
no. of rings abbrev
analyte no. of rings
abbrev analyte
Table 1. Inventory of 42 Alkylated and Non-alkylated PAHs
aEPA priority pollutant.
CHAPTER 3. RESULTS
The original composite samples are referred to as bulk sediment fractions. Humin
represents the sediment organic matrix after extraction with dichloromethane (DCM) and
alkaline salts to remove lipids and humic/fulvic acids, respectively. De-ashed humin
represents humin after extraction with HF/HCl to remove the mineral matrix.
3.1 Impact of Vegetation on Sediment Composition.
Data from FTIR (Figure 1.) show very little difference in the bulk sediment between
vegetated and non-vegetated samples. Both vegetated and non vegetated samples show
stretching in the 3000-2700 cm-1 region. This region is characterized as stretching of methyl
and methylene groups, indicating alkane content (Michalian, K.H. and Freisen, W.I. 1990;
Painter, P.C. et al, 1981; Silverstein, R.M. et al, 1991; Ledesma, E.B. et al. 2000). As
expected, moving into bulk humin that has been lipid extracted, these peaks disappear. All
sediments also show the characteristic mixture of peaks in the 900-650 cm-1 region
indicating polycyclic aromatic compounds are still present in the sediment fractions. In
bulk sediments, there appears to be less of a contribution due to C-H stretching and bending
in the vegetated zone as evidenced by peaks near 2900 and 1400 cm-1 respectively and
slightly more contribution from the more polar C-O stretch at 1000 cm-1 (Silverstein, R.M.
et al, 1991), but the high levels of petroleum contamination mask any major shifts. This is
not the case in the bulk humin where much of the available petroleum residue has been lipid
extracted from the sediment. The effects of vegetation are much more obvious in the bulk
humin. A significantly larger peak encompassing the C-O stretching zone around 1100
cm-1 is present in vegetated sediments vs. the non-vegetated control. The effects of
vegetation on total organic carbon (TOC) are visible in figure 2, with little deviation
between sites.
3.2 PAH Concentrations in Sediment Fractions.
Individual PAH concentration data for Bulk Sediment, Humin, and De-ashed humin
can be seen in tables 2-4. Mean concentrations of 42 alkylated and non-alkylated PAHs
[TPAH] and the sum of the 16 EPA priority PAHs do not significantly decline between
non-vegetated and vegetated bulk sediments (Table 5.) (Dunnett's ANOVA, p < 0.05).
Humin and de-ashed humin fractions also showed no significant declines in TPAH
concentrations between non-vegetated and vegetated sediment fractions (Table 6)
(Dunnett's ANOVA, p < 0.05). In fact, TPAH concentrations for Phragmites and cattails
humin fractions increased relative to non-vegetated humin fractions.
Humin fractions of cattails had significantly greater TPAH concentrations than the
other humin fractions analyzed (t-test, p < 0.05), and Phragmites de-ashed humin had
greater, though not significantly greater, TPAH concentrations than all other de-ashed
humin fractions (t-test, p < 0.05). These findings could be attributed to site heterogeneity
and variant PAH concentration distributions. However, Rockne et al., 2002 observed that
85% of TPAHs in an estuarine sediment were found in sediment fractions that contained
plant detrital material even though these fractions only contained 4% of the total sediment
mass. Thus, the presence of Phragmites or cattail plant material in humin fractions may
explain increased TPAH concentrations in these fractions.
In order to account for lower PAH recovery due to carbon dilution from plant
carbon inputs, TPAH concentrations were carbon-normalized in each sediment fraction
(Table 5). Carbon-normalized [TPAH] significantly decreased in all vegetated bulk
sediments relative to non-vegetated bulk sediments (Dunnett's ANOVA, p < 0.05; Table 6).
However, carbon-normalized [TPAH] for humin and de-ashed humin fractions diverged
from non-normalized TPAH data. Specifically, carbon-normalized [TPAH] for Phragmites
and cattails humin were much greater than non-vegetated and willow tree humin. Also,
Phragmites and willow tree de-ashed humin fractions had much greater carbon-normalized
[TPAH] than cattails and non-vegetated de-ashed humin fractions.
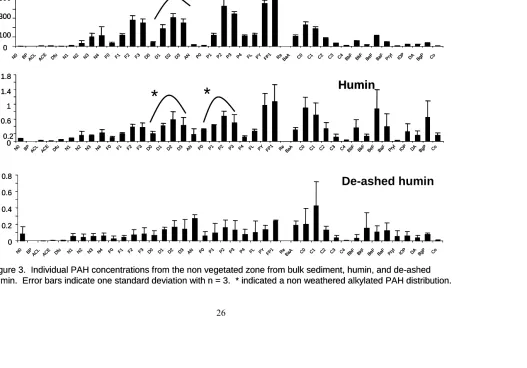
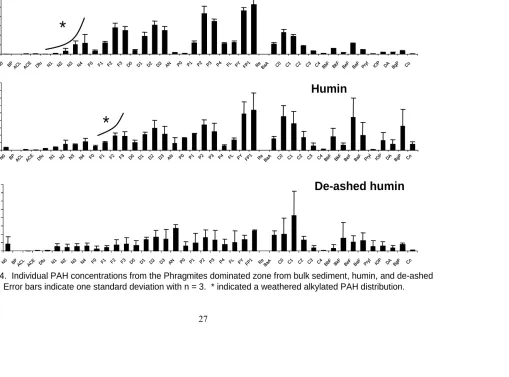
3.3 PAH Weathering and Sediment Composition.
Weathering is a phenomenon by which the chemical composition of PAH
contamination changes and dissipates over time. In general, more alkylated homologues
are more stable and resistant to degradation. Examples of weathered vs. unweathered PAH
distributions can be seen in PAH histograms of the 4 study sites shown in figures 3-6.
Unweathered alkylated PAH distributions are seen in figure 3 (non vegetated sediment).
More weathered distributions are present in figure 4 (Phragmites colonized sediment).
Weathering patterns are useful only qualitatively. Alkylated PAH ratios provide a
quantitative measure of PAH weathering and can be used (1) to describe the degree of
weathering and biodegradation of spilled oil and (2) to predict and monitor the
effectiveness of remediation activities (Douglas et al., 1996). The ratio of C3-naphthalenes
and C2-phenanthrenes (N3/P2) is used for diesel fuel and crude oil in the early stages of
weathering as the tri-alkylated napthalenes have a shorter lifespan in relation to many other
PAHs. C3-dibenzothiophenes vs. C3-chrysenes (D3/C3) ratios can be used to detect later
stages of weathering for diesel and crude oils (Douglas et al., 1996). We did not observe
more weathered D3/C3 ratios for any vegetated sediment fractions relative to the
non-vegetated sediment fractions. This outcome is not unexpected given the short exposure of
sediment to vegetation (2 years).
Figure 7 shows cross plots of N3/P2 weathering ratios to percent total organic carbon
(%TOC) for all sediment fractions. More weathered ratios are observed for Phragmites
bulk sediment and humin fractions and willow tree humin relative to non-vegetated
fractions. N3/P2 ratios for all samples in de-ashed humin were similar; this is not
unexpected given the refractory nature of de-ashed humin and the short period of exposure
to vegetation. Relationships between % TOC and N3/P2 ratios for non-vegetated and
Phragmites bulk sediment and humin fractions are not apparent. In fact, there is no
consistent pattern between N3/P2 ratios and sediment fractions for either non-vegetated or
vegetated sites. Previously, we observed increased N3/P2 weathering with increased %
TOC in distillate refinery waste colonized by Phragmites and other trees and shrubs after
30 years of plant growth (Gregory et al., 2005). This trend is not evident in these sediments
after only two years of vegetative growth. Organic carbon content of sediment fractions
does not appear related to PAH dissipation nor even to the presence of vegetation.
Figure 8 shows a more consistent relationship between N3/P2 weathering ratios and
percent modern carbon (PMC) measurements. For bulk sediment and humin fractions, the
most weathered ratios are observed in Phragmites fractions that contain more 14C activity,
or modern carbon, than all other sediment fractions (Figure 8). Willow trees also had more
weathered N3/P2 ratios in humin fractions and more modern carbon than non-vegetated
humin. All three vegetated de-ashed humin fractions were more weathered than
non-vegetated de-ashed humin but only cattails and Phragmites contained more modern carbon
than non-vegetated de-ashed humin.
3.4 Phragmites’ ability to colonize contaminated sediment
Visual differences between plant colonization of Indiana Harbor Canal (IHC)
sediments are presented in Figure 4 (photos courtesy of Steve Rock). IHC sediments were
planted with either cattails or Phragmites that had been harvested from the IHC site during
sediment collection. Plants were rooted in clean soil on top of IHC sediment; the two
sediments (clean and IHC) were separated by burlap material. As is evident in Figure 9,
Phragmites roots grew around the burlap material and into the IHC sediment. Cattails roots
did not penetrate IHC sediment and remained in the clean soil. Such distinct differences
may readily explain the observed differences in plant carbon accumulation and PAH
weathering between Phragmites and cattail sediment fractions in our study.
Polyaromatic region
0 1000
2000 3000
4000
No Plant Bulk Sediment
Phragmites
Bulk Sediment
No Plant Humin
Phragmites
Humin C-H Stretch
C-H Bend
C-O Stretch C=C Stretch
O-H Stretch
Figure 1. Selected Fourier Transform Infrared (FTIR) spectra of Indiana Harbor Sediment Fractions.
Polyaromatic region
0 1000
2000 3000
4000
No Plant Bulk Sediment
Phragmites
Bulk Sediment
No Plant Humin
Phragmites
Humin C-H Stretch
C-H Bend
C-O Stretch C=C Stretch
O-H Stretch
Polyaromatic region
0 1000
2000 3000
4000
No Plant Bulk Sediment
Phragmites
Bulk Sediment
No Plant Humin
Phragmites
Humin
0 1000
2000 3000
4000
No Plant Bulk Sediment
Phragmites
Bulk Sediment
No Plant Humin
Phragmites
Humin C-H Stretch
C-H Bend
C-O Stretch C=C Stretch
O-H Stretch
Figure 1. Selected Fourier Transform Infrared (FTIR) spectra of Indiana Harbor Sediment Fractions.
25
Bulk Sediment
0 5 10 15 20 25 30
40
Humin
0 10 20 30
0 2 4 6
8
Deashed-Humin
% Total Organic C
% Modern C
Non-Vegetated Phragmites Cattails Willow
Figure 2. Total Organic Carbon (% TOC) and Percent Modern Carbon (% PMC) for bulk sediment and humin fractions of vegetated and non vegetated sediments at the Indiana Harbor Canal site. Values are means + one standard deviation.
Bulk Sediment
0 5 10 15 20 25 30
40
Humin
0 10 20 30
0 2 4 6
8
Deashed-Humin
% Total Organic C
% Modern C
Non-Vegetated Phragmites Cattails Willow
Bulk Sediment
0 5 10 15 20 25 30
40 0 5 10 15 20 25 30
40
Humin
0 10 20 30
0 10 20 30
0 2 4 6
8
Deashed-Humin
% Total Organic C
% Modern C
Non-Vegetated Phragmites Cattails Willow
0 2 4 6
8
Deashed-Humin
% Total Organic C
% Modern C
% Total Organic C
% Modern C
Non-Vegetated Phragmites Cattails Willow
Non-Vegetated Phragmites Cattails Willow
0 100 300 500 700
N0 BP ACL ACE Dfu N1 N2 N3 N4 F0 F1 F2 F3 D0 D1 D2 D3 AN P0 P1 P2 P3 P4 FL PY FP1 Re BaA C0 C1 C2 C3 C4 BbF BkF BeF BaF Pryl
IOP DA BgP Co
0 0.2 0.6
1 1.4 1.8
N0 BPACL ACE Dfu N1 N2 N3 N4 F0 F1 F2 F3 D0 D1 D2 D3 AN P0 P1 P2 P3 P4 FL PY FP1 ReBaA C0 C1 C2 C3 C4 BbF BkF BeF BaF Pryl IOP DA BgP Co
0 0.2 0.4 0.6 0.8
N0 BPACL ACE Dfu N1 N2 N3 N4 F0 F1 F2 F3 D0 D1 D2 D3 AN P0 P1 P2 P3 P4 FL PY FP1 Re
BaA C0 C1 C2 C3 C4 BbF BkF BeF BaF Pryl IOP DA BgP Co
*
*
*
P
A
H c
o
nc
entration (
m
g/k
g
)
Figure 3. Individual PAH concentrations from the non vegetated zone from bulk sediment, humin, and de-ashed humin. Error bars indicate one standard deviation with n = 3. * indicated a non weathered alkylated PAH distribution.
Bulk Sediment
Humin
De-ashed humin
0 100 300 500 700
N0 BP ACL ACE Dfu N1 N2 N3 N4 F0 F1 F2 F3 D0 D1 D2 D3 AN P0 P1 P2 P3 P4 FL PY FP1 Re BaA C0 C1 C2 C3 C4 BbF BkF BeF BaF Pryl
IOP DA BgP Co
0 0.2 0.6
1 1.4 1.8
N0 BPACL ACE Dfu N1 N2 N3 N4 F0 F1 F2 F3 D0 D1 D2 D3 AN P0 P1 P2 P3 P4 FL PY FP1 ReBaA C0 C1 C2 C3 C4 BbF BkF BeF BaF Pryl IOP DA BgP Co
0 0.2 0.4 0.6 0.8
N0 BPACL ACE Dfu N1 N2 N3 N4 F0 F1 F2 F3 D0 D1 D2 D3 AN P0 P1 P2 P3 P4 FL PY FP1 Re
BaA C0 C1 C2 C3 C4 BbF BkF BeF BaF Pryl IOP DA BgP Co
*
*
*
P
A
H c
o
nc
entration (
m
g/k
g
)
Figure 3. Individual PAH concentrations from the non vegetated zone from bulk sediment, humin, and de-ashed humin. Error bars indicate one standard deviation with n = 3. * indicated a non weathered alkylated PAH distribution.
Bulk Sediment
Humin
De-ashed humin
0 100 300 500 700
N0 BP ACL ACE Dfu N1 N2 N3 N4 F0 F1 F2 F3 D0 D1 D2 D3 AN P0 P1 P2 P3 P4 FL PY FP1 ReBaA C0 C1 C2 C3 C4 BbF BkF BeF BaF Pryl IOP DA BgP Co
0 0.2 0.6
1 1.4 1.8
N0 BP AC
L AC
E
Dfu N1 N2 N3 N4 F0 F1 F2 F3 D0 D1 D2 D3 AN P0 P1 P2 P3 P4 FL PY FP1 ReBaA C0 C1 C2 C3 C4 BbF BkF BeF BaF Pryl IOP DA BgP Co
0 0.2 0.4 0.6 0.8
N0 BPACL ACE Dfu N1 N2 N3 N4 F0 F1 F2 F3 D0 D1 D2 D3 AN P0 P1 P2 P3 P4 FL PY FP1 Re BaA C
0 C1 C2 C3
C4 BbF BkF BeF BaF Pry l
IOP DA BgP Co
P
A
H
concent
rat
ion (
m
g/
kg
)
Bulk Sediment
Humin
De-ashed humin
Figure 4. Individual PAH concentrations from the Phragmites dominated zone from bulk sediment, humin, and de-ashed humin. Error bars indicate one standard deviation with n = 3. * indicated a weathered alkylated PAH distribution.
*
*
P
A
H
c
o
nc
ent
rat
io
n (
m
g/
k
g
)
0 200 400 600
N0 BPACL ACE Dfu N1 N2 N3 N4 F0 F1 F2 F3 D0 D1 D2 D3 AN P0 P1 P2 P3 P4 FL PY FP1 ReBaA C0 C1 C2 C3 C4 BbF BkF BeF BaF Pryl IOP DA
Bg
P Co
0 1 2 3 4
N0 BPACL ACE Dfu N1 N2 N3 N4 F0 F1 F2 F3 D0 D1 D2 D3 AN P0 P1 P2 P3 P4 FL PY FP1 ReBaA C0 C1 C2 C3 C4 BbF BkF BeF BaF Pryl IOP DA BgP Co
0 0.1 0.3 0.5 0.7 0.9
N0 BP ACL ACE Dfu N1 N2 N3 N4 F0 F1 F2 F3 D0 D1 D2 D3 AN P0 P1 P2 P3 P4 FL PY FP1 Re BaA C0 C1 C2 C3 C4 BbF BkF BeF BaF Pryl IOP DA BgP Co
Bulk Sediment
Humin
De-ashed humin
Figure 5. Individual PAH concentrations from the Cattails dominated zone from bulk sediment, humin, and de-ashed humin. Error bars indicate one standard deviation with n = 3.
0 200 400 600
N0 BPACL ACE Dfu N1 N2 N3 N4 F0 F1 F2 F3 D0 D1 D2 D3 AN P0 P1 P2 P3 P4 FL PY FP1 ReBaA C0 C1 C2 C3 C4 BbF BkF BeF BaF Pry l
IOP DA BgP Co
0 0.4 0.8 1.2
N0 BP ACL ACE Dfu N1 N2 N3 N4 F0 F1 F2 F3 D0 D1 D2 D3 AN P0 P1 P2 P3 P4 FL PY FP1 ReBaA C0 C1 C2 C3 C4 BbF BkF BeF BaF Pryl IOP DA BgP Co
0 0.2 0.4 0.6
N0 BPACL ACE Dfu N1 N2 N3 N4 F0 F1 F2 F3 D0 D1 D2 D3 AN P0 P1 P2 P3 P4 FL PY FP1 ReBaA C0 C1 C2 C3 C4 BbF BkF BeF BaF Pryl IOP DA BgP Co
P
A
H
c
onc
ent
rat
ion (
m
g/
k
g
)
Bulk Sediment
Humin
De-ashed humin
Figure 6. Individual PAH concentrations from the Willow dominated zone from bulk sediment, humin, and de-ashed humin. Error bars indicate one standard deviation with n = 3.
0 200 400 600
N0 BPACL ACE Dfu N1 N2 N3 N4 F0 F1 F2 F3 D0 D1 D2 D3 AN P0 P1 P2 P3 P4 FL PY FP1 ReBaA C0 C1 C2 C3 C4 BbF BkF BeF BaF Pry l
IOP DA BgP Co
0 0.4 0.8 1.2
N0 BP ACL ACE Dfu N1 N2 N3 N4 F0 F1 F2 F3 D0 D1 D2 D3 AN P0 P1 P2 P3 P4 FL PY FP1 ReBaA C0 C1 C2 C3 C4 BbF BkF BeF BaF Pryl IOP DA BgP Co
0 0.2 0.4 0.6
N0 BPACL ACE Dfu N1 N2 N3 N4 F0 F1 F2 F3 D0 D1 D2 D3 AN P0 P1 P2 P3 P4 FL PY FP1 ReBaA C0 C1 C2 C3 C4 BbF BkF BeF BaF Pryl IOP DA BgP Co
P
A
H
c
onc
ent
rat
ion (
m
g/
k
g
)
Bulk Sediment
Humin
De-ashed humin
0 200 400 600
N0 BPACL ACE Dfu N1 N2 N3 N4 F0 F1 F2 F3 D0 D1 D2 D3 AN P0 P1 P2 P3 P4 FL PY FP1 ReBaA C0 C1 C2 C3 C4 BbF BkF BeF BaF Pry l
IOP DA BgP Co
0 0.4 0.8 1.2
N0 BP ACL ACE Dfu N1 N2 N3 N4 F0 F1 F2 F3 D0 D1 D2 D3 AN P0 P1 P2 P3 P4 FL PY FP1 ReBaA C0 C1 C2 C3 C4 BbF BkF BeF BaF Pryl IOP DA BgP Co
0 0.2 0.4 0.6
N0 BPACL ACE Dfu N1 N2 N3 N4 F0 F1 F2 F3 D0 D1 D2 D3 AN P0 P1 P2 P3 P4 FL PY FP1 ReBaA C0 C1 C2 C3 C4 BbF BkF BeF BaF Pryl IOP DA BgP Co
0 200 400 600
N0 BPACL ACE Dfu N1 N2 N3 N4 F0 F1 F2 F3 D0 D1 D2 D3 AN P0 P1 P2 P3 P4 FL PY FP1 ReBaA C0 C1 C2 C3 C4 BbF BkF BeF BaF Pry l
IOP DA BgP Co
0 200 400 600
N0 BPACL ACE Dfu N1 N2 N3 N4 F0 F1 F2 F3 D0 D1 D2 D3 AN P0 P1 P2 P3 P4 FL PY FP1 ReBaA C0 C1 C2 C3 C4 BbF BkF BeF BaF Pry l
IOP DA BgP Co
0 0.4 0.8 1.2
N0 BP ACL ACE Dfu N1 N2 N3 N4 F0 F1 F2 F3 D0 D1 D2 D3 AN P0 P1 P2 P3 P4 FL PY FP1 ReBaA C0 C1 C2 C3 C4 BbF BkF BeF BaF Pryl IOP DA BgP Co
0 0.4 0.8 1.2
N0 BP ACL ACE Dfu N1 N2 N3 N4 F0 F1 F2 F3 D0 D1 D2 D3 AN P0 P1 P2 P3 P4 FL PY FP1 ReBaA C0 C1 C2 C3 C4 BbF BkF BeF BaF Pryl IOP DA BgP Co
0 0.2 0.4 0.6
N0 BPACL ACE Dfu N1 N2 N3 N4 F0 F1 F2 F3 D0 D1 D2 D3 AN P0 P1 P2 P3 P4 FL PY FP1 ReBaA C0 C1 C2 C3 C4 BbF BkF BeF BaF Pryl IOP DA BgP Co
0 0.2 0.4 0.6
N0 BPACL ACE Dfu N1 N2 N3 N4 F0 F1 F2 F3 D0 D1 D2 D3 AN P0 P1 P2 P3 P4 FL PY FP1 ReBaA C0 C1 C2 C3 C4 BbF BkF BeF BaF Pryl IOP DA BgP Co
P
A
H
c
onc
ent
rat
ion (
m
g/
k
g
)
Bulk Sediment
Humin
De-ashed humin
Figure 6. Individual PAH concentrations from the Willow dominated zone from bulk sediment, humin, and de-ashed humin. Error bars indicate one standard deviation with n = 3.