University of Windsor University of Windsor
Scholarship at UWindsor
Scholarship at UWindsor
Electronic Theses and Dissertations Theses, Dissertations, and Major Papers
2018
Automatic Vehicle Detection and Identification using Visual
Automatic Vehicle Detection and Identification using Visual
Features
Features
Hao Lyu
University of Windsor
Follow this and additional works at: https://scholar.uwindsor.ca/etd
Recommended Citation Recommended Citation
Lyu, Hao, "Automatic Vehicle Detection and Identification using Visual Features" (2018). Electronic Theses and Dissertations. 7378.
https://scholar.uwindsor.ca/etd/7378
This online database contains the full-text of PhD dissertations and Masters’ theses of University of Windsor students from 1954 forward. These documents are made available for personal study and research purposes only, in accordance with the Canadian Copyright Act and the Creative Commons license—CC BY-NC-ND (Attribution, Non-Commercial, No Derivative Works). Under this license, works must always be attributed to the copyright holder (original author), cannot be used for any commercial purposes, and may not be altered. Any other use would require the permission of the copyright holder. Students may inquire about withdrawing their dissertation and/or thesis from this database. For additional inquiries, please contact the repository administrator via email
Identification using Visual Features
By
Hao Lyu
A Thesis
Submitted to the Faculty of Graduate Studies through the School of Computer Science in Partial Fulfillment of the Requirements for
the Degree of Master of Science at the University of Windsor
Windsor, Ontario, Canada
2017
c
Automatic Vehicle Detection and Identification using Visual Features
by
Hao Lyu
APPROVED BY:
A. Hussein
Department of Mathematics and Statistics
A. Ngom
School of Computer Science
I. Ahmad, Advisor School of Computer Science
I hereby certify that I am the sole author of this thesis and that no part of this
thesis has been published or submitted for publication.
I certify that, to the best of my knowledge, my thesis does not infringe upon
anyones copyright nor violate any proprietary rights and that any ideas, techniques,
quotations, or any other material from the work of other people included in my
thesis, published or otherwise, are fully acknowledged in accordance with the standard
referencing practices. Furthermore, to the extent that I have included copyrighted
material that surpasses the bounds of fair dealing within the meaning of the Canada
Copyright Act, I certify that I have obtained a written permission from the copyright
owner(s) to include such material(s) in my thesis and have included copies of such
copyright clearances to my appendix.
I declare that this is a true copy of my thesis, including any final revisions, as
approved by my thesis committee and the Graduate Studies office, and that this thesis
ABSTRACT
In recent decades, a vehicle has become the most popular transportation
mech-anism in the world. High accuracy and success rate are key factors in automatic
vehicle detection and identification. As the most important label on vehicles, the
license plate serves as a mean of public identification for them. However, it can be
stolen and affixed to different vehicles by criminals to conceal their identities.
Fur-thermore, in some cases, the plate numbers can be the same for two vehicles coming
from different countries. In this thesis, we propose a new vehicle identification
sys-tem that provides high degree of accuracy and success rates. The proposed syssys-tem
consists of four stages: license plate detection, license plate recognition, license plate
province detection and vehicle shape detection. In the proposed system, the features
are converted into local binary pattern (LBP) and histogram of oriented gradients
(HOG) as training dataset. To reach high accuracy in real-time application, a novel
method is used to update the system. Meanwhile, via the proposed system, we can
store the vehicles features and information in the database. Additionally, with the
database, the procedure can automatically detect any discrepancy between license
I would like to express my sincere appreciation to my supervisor Dr. Imran Ahmad
for his constant guidance and encouragement during my whole Master’s period at the
University of Windsor. Without his valuable help, this thesis would not have been
possible.
I would also like to express my appreciation to my thesis committee members Dr.
Alioune Ngom and Dr.Abdulkadir Hussein. Thank you all for your valuable guidance
and suggestions to finish this thesis.
Last but not least, I want to express my gratitude to my parents and my friends
TABLE OF CONTENTS
DECLARATION OF ORIGINALITY III
ABSTRACT IV
AKNOWLEDGEMENTS V
LIST OF TABLES VIII
LIST OF FIGURES IX
1 Introduction 1
1.1 Automatic vehicle Identification system . . . 1
1.2 Research Motivation . . . 2
1.3 Problem Restatement . . . 3
1.4 ALPR system . . . 4
1.5 License plate province detection . . . 5
1.6 Vehicle shape detection and recognition . . . 6
1.7 Thesis Contributions . . . 8
2 Literature Review 10 2.1 Edge-based method for license plate detection . . . 10
2.2 ALPR based on fuzzy maps . . . 12
2.3 Character recognition with visual features . . . 13
2.4 Character recognition based on Template Matching . . . 15
2.5 Character recognition based on Neural Network . . . 17
2.6 Optical character recognition for handwritten English . . . 18
2.7 Vehicle detection and classification based on HOG . . . 20
3 Material and Methodology 22 3.1 Overview of our approach . . . 22
3.2 Automatic license plate recognition (ALPR) . . . 24
3.2.1 License plate detection and localization . . . 24
3.2.2 Processing with license plate recognition . . . 30
3.2.3 Character segmentation . . . 40
3.2.4 Character recognition . . . 41
3.3 Province detection . . . 43
3.4 Vehicle shape detection and recognition . . . 44
3.5 Evaluation . . . 47
4 Result and discussion 49 4.1 Platform and hardware . . . 49
4.2 Input . . . 49
5 Conclusion 65
REFERENCES 67
LIST OF TABLES
1 Vector crossing using three vectors . . . 16
2 Part of results derived by the system . . . 57
3 A comparison of the time required . . . 59
1 ALPR applied in Law enforcement [13] . . . 2
2 A simple flowchart of ALPR . . . 5
3 License plate samples from different provinces in Canada [43] . . . 6
4 Classification of vehicles [23] . . . 8
5 The zones of each image . . . 15
6 Character matrices for character “A”, “B” and “C” . . . 19
7 Flowchart of the proposed model . . . 23
8 Overview of the License plate detection . . . 25
9 Converting the image into HOG image . . . 25
10 Example of gamma compression . . . 26
11 Example results of LBP [40] . . . 28
12 Flowchart of cascade model [44] . . . 30
13 Detection on an image with the covered plate . . . 31
14 Detection on an image with noise . . . 31
15 There is an angle between camera and vehicle . . . 32
16 Vehicle image captured by the camera . . . 33
17 Comparison of transformation procedure with different degrees, 30◦, 60◦ and 75◦ . . . 36
18 A clear original License plate image . . . 38
19 Comparison of different binarization methods on a clear image . . . . 38
20 An original blurred License plate image . . . 38
21 Comparison of different binarization methods on a blurred image . . . 39
22 Procedure for contours detection . . . 40
23 Procedure for contours filter and text line detection . . . 40
24 Procedure for character segmentation . . . 41
26 Feature matching examples . . . 45
27 Camera position for vehicle shape recognition . . . 46
28 Result of classification using CNN . . . 47
29 Input image captured in a Parking lot . . . 50
30 Gray scale conversion of the captured image . . . 51
31 HOG conversion of the gray image . . . 51
32 LBP conversion of the gray image . . . 52
33 Histogram of LBP image . . . 53
34 License plate extraction from the image . . . 54
35 License plate image binarization . . . 54
36 Contours filter and text line detection . . . 55
37 License plate orientation . . . 55
38 Processing of plate image . . . 56
39 Character segmentation . . . 56
40 The characters of the license plate is recognized incorrectly . . . 58
41 Comparison of detection methods . . . 59
42 Comparison of OCR methods . . . 60
43 Result of the proposed system . . . 60
44 The license plate with a background . . . 61
45 The license plate with a noise line . . . 62
46 vehicle shape classification . . . 63
Introduction
In recent years, the transportation complexity has increased dramatically with the
increase of the population in the world. Consequently, there is mountainous traffic
work for different agencies due to the rise of vehicular movement. These organizations,
for example, law enforcement agencies, who are responsible for monitoring each vehicle
and arresting the illegal vehicles, need to do a lot of work such as checking if the
license plate is registered. However, a huge number of vehicles in the street makes
the work harder. Hence it is necessary to recognize the vehicles using machine learning
techniques, and automatic vehicle identification has become an essential stage in the
modern traffic system.
1.1
Automatic vehicle Identification system
Automatic vehicle identification and recognition system [41] is an autonomous
tech-nique applied in traffic system including electronic toll collection, border and customs
checkpoints, etc. With hardware like camera, the system can recognize each unique
vehicle correctly and quickly. As the most important part, automatic license plate
recognition (ALPR)[12] is one form of the vehicle identification. It is an image
pro-cess technology used to identify vehicles by reading the vehicle registration plates. It
plays a significant role in a modern intelligent transport system. It can be used to
enforce traffic bylaws, collect tolls on bridges and identify a person of interest to law
enforcement. Figure 1 shows an example of ALPR application in Law enforcement
1. INTRODUCTION
Figure 1: ALPR applied in Law enforcement [13]
1.2
Research Motivation
In 2016, there were over 33.7 million registered vehicles in Canada [4], compared with
2009 stats [28] which had nearly 20.5 million. This fact reflects that there was a
dramatic increase during about seven years. This significant increase enforced
mod-ern transportation system to promote the performance of traffic controlling system.
Therefore, in order to maintain the traffic effectively and safely, automation and
arti-ficial intelligence have become the mainstream in modern times. Numerous methods
involving Machine learning have been invoked in the systems, which can monitor and
control the transportation via identification and recognition. Additionally, the
inno-vative technology will be applied in other systems, such as toll collection and parking
lot access control. Application in these systems can satisfy great needs of our real
life.
With the growing speed of registered vehicles, more and more ALPR algorithms
have been proposed in recent years. However, the results, which are derived from
complex lighting conditions and noise of the images make success rate and accuracy
of these procedures unsatisfying. This means that the vehicle to be identified must
be photographed many times until the set of hardware can recognize it successfully,
which will cost much time and energy. Hence, it is extremely convenient to develop
or modify one ALPR program that can work efficiently and accurately.
Unfortunately, in some cases, there are variant illumination, perspective distortion
and interference characters due to the quality of the camera or the condition of the
weather. As a result,the accuracy is very low, which can lead to huge cost of human
labor. In addition, plates on the vehicle can be stolen and affixed on different cars.
Therefore, license plate number cannot be the only information to detect and identify
the vehicle. We need to identify one unique with more information such as the
province of the plate and the type of the vehicle. Hence, we have developed a system
to identify and recognize the vehicle efficiently and with high accuracy.
1.3
Problem Restatement
With the development of the nowadays technology and the rise of the number of
vehicles all over the world, the intelligent traffic system more highly depend on the
automatic vehicle recognition system. Hence the vehicle detection and recognition
system must have a good performance in both accuracy and time complexity. There
are some tips we need to focus on.
1. For development in real-time application, in each phase of the system, the
test-ing image should be modified for next procedure.
2. Feature extracting and selection are important. Model of the program should
be rebuilt to obtain more useful features, with which the procedure can detect
and recognize the license plate accurately.
3. For security and accuracy, more features obtained from the vehicle should be
1. INTRODUCTION
1.4
ALPR system
Generally, ALPR system consist a series of methods [16], which are associated with
some important techniques. These approaches come from some areas such as machine
learning, pattern recognition and computer vision. Hence, algorithm selection and
modification become the crucial parts of the procedure. Based on that, what we do
is to design a excellent system to reach the ultimate purpose of the system, which is
to get the license plate number from the images captured by the camera.
Basically, the system consists of six steps. The Figure 2 shows the steps of ALPR
system.
1. Image capture
• It is a hardware based process, which is affected by the quality and type of camera, lighting strength, illumination and weather conditions. As a
result, an image file is collected.
2. Plate detection and localization [19].
• This stage is responsible for finding and isolating the plate on the image, which involves the search, segmentation and transformation of the plate in
the file obtained from the previous stage.
3. Image binarization and normalization.
• Binarization is the process of converting a pixel image to a binary image [38]. The threshold value of the image can be derived in different
bina-rization methods. This includes global thresholding [34], adaptive method
[30], Niblack’s Algorithm [27], etc. These methods can separate the
fore-ground from the backfore-ground. Consequently, this technique can give us the
foreground text in white and background in black.
Figure 2: A simple flowchart of ALPR
4. Character segmentation.
• Character segmentation is a critical area of character processing and an important preprocess for character recognition. With previous steps, plate
has been extracted. To identify each character, individual characters must
be detected in the image. Several approaches have been proposed such
as projection, connected components or morphology. As a result, each
character is extracted.
5. Character recognition.
• Optical character recognition(OCR) is the main stage in ALPR [42]. Input characters may be noisy or broken. OCR techniques must be able to
tolerate these cases, and derive a result with a high accuracy.
1.5
License plate province detection
In some cases, plates on the vehicle can be stolen and affixed on different cars.
1. INTRODUCTION
Figure 3: License plate samples from different provinces in Canada [43]
vehicle. We need to identify one unique vehicle with more information such as the
province of the plate and the type of the vehicle.
Figure 3 shows some sample license plates from different provinces in Canada.
From that we can see the province characters in Canadian license plate are mostly
on the top of the numbers, and are smaller than the numbers. Consequently, it is
extremely hard to recognize them using OCR. Therefore, the best way to detect the
province is using feature matching. It takes the descriptor of one feature in the first
set and is matched with all other features in the second set using Euclidean distance
[10].
1.6
Vehicle shape detection and recognition
The goal of this stage is to detect the type of the vehicle. It can be seen as a task for
The features determine the type of the image. Therefore, in classification, if we desire
to get true type of the vehicle in the image, the type of classifier and features should
be detected. In the proposed system, there are some types which can be classified,
namely:
1. Sedan and sports car: Sedan is a passenger car with an enclosed automobile
body having two or four doors and seating four or more persons on two
full-width seats.
2. Hatchback: Hatchback car is a kind of car, in the ending of which there is a
single door that is lifted to open. And the car body is usually for cargo storage.
3. Sport utility vehicle(SUV): SUV is a vehicle classified as a light truck, which is
similar to a station wagon.
4. Pickup: Pickup truck is a light truck having an enclosed cab and an open body
with low sides and tailgate.
5. Cube van: “Cube van is a van with a cube-shaped storage compartment that
1. INTRODUCTION
Figure 4: Classification of vehicles [23]
1.7
Thesis Contributions
In our proposed system, we has developed a novel method for detecting the license
plate. Many useful features are extracted from the images which serve as the
employed to detect the license plate. For deriving result with high accuracy in
charac-ter recognition, there are many image preprocessing programs in our system such as
image orientation, image binarization, character segmentation, etc. Our license plate
recognition model has a good performance both in success rate and time complexity.
We have also developed a method to detect province from the license plate. To make
the security of the system high, we use a neural network model to recognize the shape
of the vehicles. The license plate recognition, province detection and vehicle shape
recognition make our system reliable for application in an intelligent transportation
CHAPTER 2
Literature Review
This chapter provides a brief reviews of the previous research on license plate detection
and recognition using machine learning and computing vision methods.
2.1
Edge-based method for license plate detection
An edge based multi-stage approach of license plate localization was proposed by
Satadal Saha et al [37]. In this paper, license plate image is extracted from original
image by edge detection. Localization of plate is undoubtedly a challenging task
since there are significant variations in plate size, color, lighting condition and spatial
orientations of license plate in images. In this work, at preprocessing stage, three
steps are employed.
1. Gray scale conversion
• By the following formula, the 24-bit color image can be converted into 8-bit gray image.
Gray= 0.59×R+ 0.30×G+ 0.11×B (1)
2. Median filtering
• As one of non-linear filter, it can calculate the median of the gray values of a pixels neighbors. In this stage, they use 3×3 masks to get eight surrounding neighbors gray value and replace the pixel value with the median value. As
3. Contrast enhancement
• Histogram equalization technique is invoked to enhance contrast of the images. In the procedure of the conversion, the total number of pixels in
the image isN and the number of pixels with the gray level k isnk. Then
the stretched gray levelSk is calculated by he following formula.
Sk= k
X
j=0
nj
N ×255 (2)
After that, edge detection is implemented with Sobel edge operator. Via prominent
vertical edges, they develop several stages to localize the plate.
1. Minimum and maximum threshold value is derived from the dataset. Then the
image is scanned to get mean value and variance value of each edge pixel
posi-tions. Compared with the threshold values, potential band of rows is identified.
2. For each band, diagonal corners are detected by calculating the minimum and
maximum values of the edge gradient value. With these two points, the
maxi-mum area of the license plate are indicated.
3. The minimum value of heightHminis dependent on the height of the characters
in the character set. It is obtained by getting the average value of the vertical
edges in the bounding box which derived from the second stage. Among theses
new bounding boxes, the overlapped or very closed boxes were merged.
4. From the generated dataset, the procedure obtained the average value of aspect
ration and the area, by which noise boxes are removed.
In this experiment, 500 images with the resolution 704×576 pixels are selected as training dataset. Meanwhile, another 500 images are used for the test. In the
result, the false negative was only 8%, which meant that there were 40 samples in
which true license plates were not found or false location were detected as license
plate. If the false negative cases were just considered as wrong cases, the accuracy of
2. LITERATURE REVIEW
good performance in different lighting conditions, shadows and complicated scenes.
However, the main limitation of the system is that it will not be good if the image
are more noisy.
2.2
ALPR based on fuzzy maps
Shyang-Lih Chang et al. [7] proposed a license plate image technique consisting of
two main models: a license plate locating model and a license number identification
module. Specifically, the license plate candidates extracted from the first model are
examined in the identification model to reduce the error rate. In the first model,
several features such as color are taken into consideration to determine the license
plate region. Initially, they use color edge detection to compute edge map E which
contains three types edge (i.e., black-white, red-white and green-white edges) due to
the fact that there are just four kinds of color(white, black, red and green) for the plate
and character in Taiwan. To detect the color edges, these three kinds of edges are
taken into consideration. The RGB color differences (4r,4g,4b) can be calculated to find the edge. Next, with unique formulas, the program can transform RGB space
into HSI space that denote (red, green, blue) and (hue, saturation, intensity) values
of an image pixel, respectively. The transform formula is as below.
I = (r+g+b) 3
S = 1−min{r, g, b}
I
H = cos−1
(
(r−g) + (r−b) 2[(r−g)2+ (r−b)(g−b)]12
)
(3)
Besides, from given four maps E, H, S and I the stage can derive four fuzzy maps
ˆ
E, ˆH, ˆS and ˆI based on the idea that the entry of any cell in the map expresses the
degree of the cell possessing the property due to the fact that each map can encode
some features about the scene. Moreover, two fuzzy aggregators will be employed to
The identification module consists of two main stages, preprocessing and
recogni-tion. The preprocessing stage contains three tasks, namely, binarization, connected
component labelling and noise removal. After these processes, segmentation and
recognition will be invoked sequentially. In the segmentation procedure, three
func-tions (delete, merge and split) is applied to the surviving components until no
charac-ter can be extracted. The characcharac-ter recognition is composed of three steps which are
character categorization, topological sorting and self-organizing recognition. First
step is that input character is distinguished as numerical or alphabetical by
com-positional semantics of license numbers. Next, topological features of characters is
calculated and compared with stored templates. Finally, a test will be formed, where
the template that best matches the input character is detected. This proposed work is
much less restrictive compared to most of the other work that restricted their working
conditions and still has a high success rate. However, the identification model takes
about two seconds to recognize the numbers, which means it take much time and the
complex program need to be modified.
2.3
Character recognition with visual features
Salah Al-Shami et al. [1] proposed a new feature extraction method for license plate
number recognition which focus on the character recognition. Some approaches to
recognize characters is usually taking lines as features. Here, the algorithm they
devel-oped searches for the line containing a feature or a group of combined features. Each
line of character is selected manually by the process. These features are extracted
from horizontal lines and vertical lines. In the horizontal lines feature extraction,
three types of features are employed, which are presented as following lists.
• Feature 1: the number of transitions is counted in each horizontal line by the program.
2. LITERATURE REVIEW
• Feature 3: the image is divided into 3 identical regions vertically, which are left, middle and right. The feature is 0 or 1 in each region, which depends on the
occurrence of transitions in each region.
Next, these three features are modified into five features.
• Feature 1: Transition features are stored in the database as an integer number.
• Feature 2: the percentage-of-white features are float number. And quantization process is applied. The formula is showed below, in which the value Q could
range between 2 and 100.
P ercentage of W hite(Q) =d(P ercentage of W hite∗Q)e (4)
• Feature 3: Position-of-transition features are stored as a code of three binary bits. For example, if the original feature is “left=1, middle=0, right=”, it will
be stored as “100”.
• Feature 4: This feature will be derived by combining Feature 1 and 2 in a decimal format. For example, the value of Feature 4 may be 16.3, which means
that the value of Feature 2 is 16 and the value of Feature 1 is 3.
• Feature 5: It is grouped by combining the first 3 features together in a decimal format. If the value of Feature 5 is 8.3111, it means that the Feature 2 is 8, and
the Feature 1 is 3 and the Feature 3 is coded as “111”.
Then, classification model will be invoked after feature selection, in which a cube
constructed from the lines is composed of horizontal lines and vertical lines.
Addi-tionally, there are three dimensions.
• Dimension 1: 5 features discussed above
• Dimension 2: The set of horizontal lines
In the third dimension, the set of 10 classes is used for labelling the character.
After construction, feature selection is employed in the program, which can search
for dissimilarity of features. From the modified model, the recognition tree can be
built to recognize the numbers on the plate. The tests are performed on the real
KSA (Kingdom Of Saudi Arabia) license plate. Consequently, experimental results
implemented using MATLAB, showed the efficient and productive way of the system
with an over 95% accuracy.
2.4
Character recognition based on Template
Match-ing
A modified template matching Correlation algorithm has been proposed by Ali Farhat
et al. in [14]. Numeric ALPR systems in the past, have faced different kinds of
challenges for character recognition. Some of the methods used extensive calculations
which could slow down the operation. Hence, they have developed four algorithms
to overcome the limitations: Vector crossing, zoning and combined zoning-vector and
template matching correlation. First three algorithms are based on feature extraction
techniques and the last one is application of correlation technique.
To distinguish numbers, three vectors are used in vector crossing process. The
three vectors are vertical vector, horizontal vector at one-third of image and horizontal
vector at two-third of the image. Then with counting numbers of the vectors, the ten
characters(0−9) are distinguished except the characters “2”, “3” and “5” since they have the same number of the vectors. Table 1 presents the result of this approach.
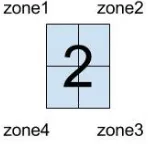
Figure 5: The zones of each image
2. LITERATURE REVIEW
Table 1: Vector crossing using three vectors
Digits Crossing Vector Crossing
0 1 2 3 4 5 6 7 8 9
Vertical Vector 2 1 3 3 3 2 3 2 2 3
Horizontal Vector1 2 2 1 1 1 1 1 1 2 2
Horizontal Vector2 2 1 1 1 2 1 2 1 2 1
Zoning has been employed. Here, each character image will be divided into four zones
as the Figure 5. Densities of the image in each zone are derived by the algorithm to
determine the characters. The third approach is the combination of the previous two
methods. In that, density of the image is calculated. Meanwhile, the method will
take one or two vector crossing into account to reduce the error rate and increase the
probability of correct character recognition. However, the three algorithms cannot
determine a noise in the image. Hence, they develop a system based on template
matching. In this system, correlations of two images is evaluated by the following
expression.
r =
P
m
P
n(Anm−A¯)·(Bnm−B¯)
p
(P
m
P
n(Anm−A¯)2)·(
P
m
P
n(Bnm−B¯)2)
(5)
After that, threshold value is set to be 0.45 to detect the noise. Additionally, the
value or r will tend to 1 if the images match.
This system, which implemented and tested with 2790 characters, has the
ex-tremely recognition rate at 99.5% and takes 1.95 ms to precess an image. However,
the limitations of the approach is that it just can recognize 10 numbers instead of the
alphabet. If more templates are added to the system, the success rate may decline
2.5
Character recognition based on Neural
Net-work
Christos-Nikolaos Anagnostopoulos et al. [2] proposed a new algorithm for license
plate identification. For faster detection of regions of license plate, they developed
a novel method called sliding concentric windows(SCW), which can describe the
ir-regularity in the image based on image statistics. The SCW segmentation algorithm
involes following steps.
1. Two concentric windows A and B were created for the upper left corner pixel
of the image.
2. Mean value were obtained from both of the windows.
In the program, the RoI(Region of Interest) will be detected if the ratio of the
statistical measurements in the couple of windows reaches a threshold. The formula
is as below.
RoI =
0 if MB MA ≤T 1 if MB
MA > T
(6)
where M is the mean value of the two windows and T was set manually. Next,
image masking, binarization with Sauvola[38] and connected components analysis
(CCA) are employed in sequence. In the image masking phase, the output of the
SCW method are viewed as the mask, which is used in theAN D masking operation.
After that, Sauvola method is invoked to binarize the image. The threshold value is
derived by the following equation.
T(x, y) =m(x, y) + [1 + 0.5∗(σ(x, y)
128 −1)] (7)
where m(i, j) and σ(i, j) are the sample mean and variance, respectively. In next
stage, CCA is applied in the binarization to scan the image and label its pixels into
2. LITERATURE REVIEW
successfully.
In license plate processing stage, they create an approach to segment characters,
in which bounding box of characters are determined using column and row standard
deviation criterion. Then, probabilistic neural network(PNN) is invoked to recognize
the characters. The process takes individual character image(9X12) pixels value as
the input feature vector, which means the input layer consists of 108 nodes. Besides,
the pattern layer takes 5 image patterns of every character as nodes to organize the
training set. As a result, possible character is determined in the output layer. The
proposed system relies highly on the lighting condition and the physical appearance of
the plates. In some cases, the program cannot detect the plate due to the illumination
condition or the quality of the plates.
2.6
Optical character recognition for handwritten
English
Vijay Patil and Sanjay Shimpi [32] proposed a Character Recognition System for
handwritten English. “It is extremely difficult to recognize the handwritten characters
since there is a great variation of writing style, different font size and orientation angle
of the characters” [32]. In their sytem, each character is represented by a character
matrix with the size 8×5. If the size of the character matrix is too small, the letters may not be presented properly. If the size of the matrix is too big, the train process
will take more time. Hence, size 8×5 is good for the system. In the matrix, black stands the vector of 1 and white stands for 0. The Figure 6 shows three matrices
for character “A”, “B” and “C”. In the architecture of the neural network, there are
40(= 5×8) inputs, 26 neurons in its output layer and 5 neurons in hidden layer. The log-sigmoid transfer function is used in tow-layer network. The weights of the neural
network is updated by calculating the error between actual output and the target
output. In training process, the network on ideal samples and noisy samples. The
Figure 6: Character matrices for character “A”, “B” and “C”
1. The dataset is split into two sets: a training set and a test set. The target
output is normalized to the range (0,1).
2. All weights and biases are initialized to random values from −1 to +1.
3. Each neuron sums the weighted input. The forward propagation of first input
pattern passes weighted input through the nonlinearity and the sum is sent to
next layer.
4. Difference between the actual output and target result is derived.
5. The difference update each weight by using Back propagation rule.
6. Forward propagation is invoked in the next input pattern.
7. Step 3-7 is repeated until the error falls below a threshold value.
There are some learning factors that can affect the performance of the neural
network, such as the number of hidden neurons and the number of hidden layers.
“The dimension n of the input vector and the number of separable regions in n
dimensional Euclidean input space can detect the number of hidden neurons” [32].
In the test, there are 5 neurons in hidden layers and 22 hidden layer neurons.
The experiment gets an accuracy of more than 70%. In the handwritten recognition
problem, the result is not so bad. However, the accuracy is extremely important to
2. LITERATURE REVIEW
Though the training of the system is fast, the features sometimes may provide wrong
information for training system.
2.7
Vehicle detection and classification based on
HOG
A vehicle shape classification model has been presented by Zezhi Chen and Tim Ellis
[8]. Vehicle classification is a crucial stage in Intelligent Transportation System (ITS).
Most of the classification task is done by human, which has a bad performance in time
complexity. However, an automatic system can provide a more accurate and lower
cost solution. Classification model contains two parts: feature extraction and classifier
selection. In their approach, measurement-based features (MBP) and the histogram
of orientation gradients (HOG) features are used to classify the road vehicles into four
categories: car, van, bus, and motorcycle. In MBP features, there are serval different
measurements shown below to make up the feature vector including perimeter, width
and height of the bounding box, convex area and so on.
In camera calibration process, to compute the transformation between 2D image
points and 3D world points, four systems need to be determined: world, camera,
camera sensor plane and image plate. For implementations of camera calibration, they
used Google Earth as the tool to provide a plane view. As a result, the car wireframe
model is projected into the image. This model is used in model-based classification.
In this method, “the vehicle silhouettes are matched against 2D projections of the 3D
models” [8]. The best 3D model can be found to match the original vehicle model.
For classification, two classifiers are used, which are Random Forest (RF) and
Support Vector Machines (SVM). Due to the multiple classification problems, they
decided to use one-vs-all strategy. In the phase, one of the four classes is considered
as one group and the others are seen as another group. Then, after finding the
hyperplane between two groups, the classifier RF or SVM is repeated for the group
concluded that SVM is better than RF in the system. The true positive rate reaches
to 0.9911. The model they have presented is a novel vehicle type classification, which
provides an accurate and reliable performance. However, the models among the
four vehicle types are very different. Sometimes 3D models of two vehicles such as
hatchback and SUV, may be similar. In this case, this system may be hard to detect
CHAPTER 3
Material and Methodology
3.1
Overview of our approach
In this chapter, we will propose three systems for vehicle detection and recognition,
which are automatic license plate recognition, province detection and vehicle shape
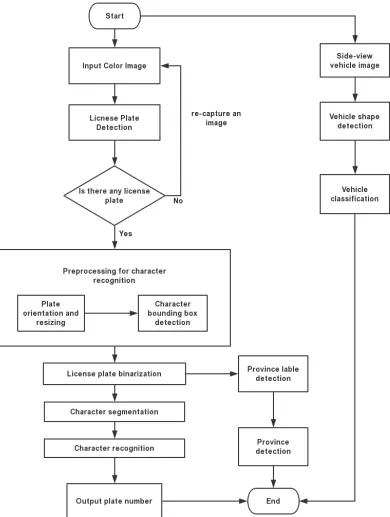
detection and recognition respectively. Figure 7 shows the flowchart of the proposed
system. In the system, ALPR and vehicle shape classification are individual.
There-fore, they can be executed at the same time. Additionally, after plate detection, plate
recognition and province detection can also run at the same time. This design can
reduce much time for application in real-time system.
The recognition program is based on the Canadian vehicles. Hence, the data set
that we tests are from the Canada. The approach we developed consists of four main
stages:
1. License plate detection and localization
2. Processing with licence plate image
3. Character segmentation
4. Character recognition
These four stages are sequential. The result derived from an earlier stage provides
3. MATERIAL AND METHODOLOGY
3.2
Automatic license plate recognition (ALPR)
3.2.1
License plate detection and localization
License plate localization is a crucial stage in the system. The result derived from the
stage will affect directly the performance of the recognition system. From literature
review, we know that some approaches for localization are more productive, such as
edge-based detection and fuzzy detection. However, these methods are restricted by
lighting conditions, which motivate us to develop a system that can overcome these
restrictions. To detect the license plate efficiently, we take feature description as
our target, which means that if we learn about the features that can describe the
number plates, we can extract them. Meanwhile, local binary pattern (LBP) [18]
and histogram of oriented gradients (HOG) [9] are texture visual descriptors used
for classification, of which the important properties are the tolerance against the
illumination changes.
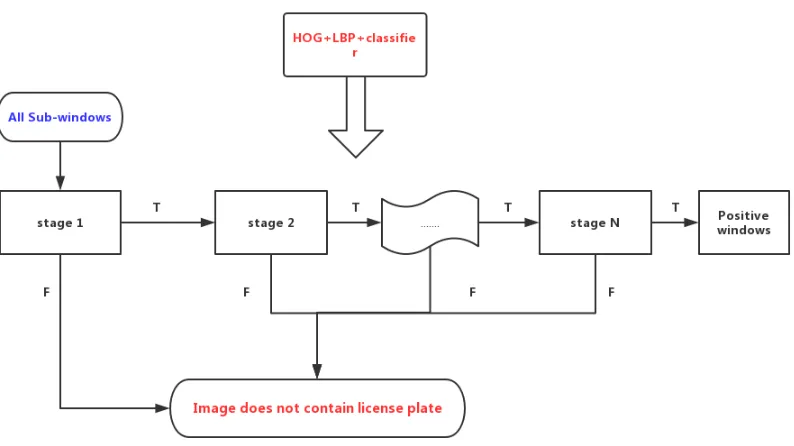
The basic idea of this phase is based on multi-stage structure, which is a kind
of cascade classifiers. Figure 8 shows an overview of Plate detection procedure. The
architecture is improved from [45] [26]. Instead of applying all features on one window,
the program groups the LBP and HOG features into different stages. In the sequential
stages, positive results from the previous stage will trigger the next stage classifiers,
which uses the LBP and HOG features. The negative results are rejected immediately.
Using this approach, we can detect the license plate image rapidly and accurately.
Histogram of oriented gradients(HOG)
The histogram of oriented gradients (HOG) is a feature descriptor employed in object
detection program. It provides excellent performance in human detection [9]. The
HOG feature descriptor is invariant to geometric and photometric transformations
because it operates on cells in the image. And magnitude of gradients is large around
edges and corners, which can pack in much information about object shape. The
following list shows the procedure of HOG calculating. Figure 9 presents one HOG
Figure 8: Overview of the License plate detection
Figure 9: Converting the image into HOG image
1. Global image normalisation
3. MATERIAL AND METHODOLOGY
point-wise correction of the form [15]:
g(u) = uγ1, (1)
where u∈ [0,1] denotes the image pixel intensity. In our system, γ is set to 1.5, which can make the output image lighter than the original. When
γ is set to be smaller than 1.5, images from our dataset are a little darker.
When it set to be more than 1.5, the output image too light. Figure 10
shows the result of gamma compression.
Figure 10: Example of gamma compression
2. Calculating the gradient image in x and y.
• Horizontal and vertical gradients can be calculated by Sobel operator [20], the operator is as below formula. Then, magnitude and angle can be
calculated.
g =pgx2+gy2 (2)
θ = arctangy gx
(3)
3. Orientation binning
• The cell histograms is created in this step. Each pixel within the cell casts a weighted vote for an orientation-based histogram channel based on the
be rectangular or radial in shape, and the histogram channels are evenly
spread over 0 to 180 degrees or 0 to 360 degrees, depending on whether
the gradient is unsigned or signed [9].
4. Block normalization
• The normalization factor can be derived by the L2−nrom as following formula:
f = q v
kvk22 +e2
(4)
5. Calculating the HOG feature vector
Local binary pattern(LBP)
LBP computes a local representation of texture. This local representation is
con-structed by comparing each pixel with its surrounding neighborhood. Initially, the
input RGB colorful image will be converted into grayscaling one by the following
formula [29]
Gray= 0.299×R+ 0.587×G+ 0.114×B (5)
where R, G and B are the image color channels’ value, which red, green and blue
respectively.
Next, each pixel of the image is labelled by LBP operator via thresholding 3×3 neighborhood of each pixel with the center pixel value. As a result, binary number
is extracted as a LBP code. For each pixel in the grayscaling image, we select a
neighborhood of size r surrounding the center pixel. A LBP value is then calculated
for this center pixel and stored in the output 2D array with the same width and
height as the input image. Then, we can calculate the LBP value for the center pixel.
We can start from any neighboring pixel and work our way clockwise or
counter-clockwise, but the ordering must be kept consistent for all pixels in the image and for
all images in the dataset. Consequently, this process of thresholding, accumulating
binary strings, and storing the output decimal value in the LBP array is then repeated
3. MATERIAL AND METHODOLOGY
output LBP array. Since a 3×3 neighborhood has 256(= 28) possible patterns, our
LBP 2D array thus has a minimum value of 0 and a maximum value of 255, allowing
us to construct a 256-bin histogram of LBP codes as our final feature vector.
193 151 172
095 150 142
117 120 143
→
1 1 1
0 P 0
0 0 0
→(11000001)2 (6)
Figure 11 shows example results with black (or white) representing pixels that are
less (or more) intense than the central pixel. When surrounding pixels are all black
or all white, then that image region is spot or flat.
Figure 11: Example results of LBP [40]
Learning classification
Given a training dataset of positive and negative images, serval machine learning
methods can be used as a classification function. In our proposed approach, Gentle
AdaBoost is invoked to select the features and to train the classifier. Generally,
AdaBoost is a form of learning algorithm which is used to promote the classification
performance of a weak learning algorithm. It can provide strong guarantees in the
procedure. It is proved in [24] that the training error of the strong classifier can
almost reach to 0. The following figure is the steps of the AdaBoost [24].
In addition, the weak learning function is employed to select the license plate
Algorithm 1 Gentle AdaBoost
1. Given N examples, (x1, y1), . . . ,(xN, yN) with yi ∈[−1,1] 2. Start with wi = N1, i= 1,2, . . . , N
3. Repeat for m= 1, . . . , M
(a) Fit the regression functionfm(x) by weighted least-squares ofyi toxi with weight
(b) Set wi ← wi ·exp(−yi ·fm(xi)), i = 1, . . . , N, and renormalize weights so that P
iwi = 1
4. Output the classifier sign[PM
m=1fm(x)]
the best. Specifically, for each feature, the weak algorithm can detect the threshold
function, which can make the number of misclassified examples minimum. The weak
classification function fj(x) is composed of a feature fj denoting the LBP histogram
bin, a threshold value j and a parity pj indicating the direction of the inequality sign.
The formula is as the following.
fi(x) =
1 if pifi(x)≤piθ
0 otherwise
(7)
Cascade classifiers
For detection of the license plate in the sub-image, a cascade of classifiers is used,
which can boost the detection performance while reducing the time complexity of
the procedure. A cascade of classifiers is constructed like a degenerated tree, in
which at each step, a classifier is trained to detect the license plate and to reject
the majority of sub-windows where there is no any license plate. Specifically, Gentle
AdaBoost is used as training classifiers in stages of the cascade and threshold value
is adjusted to minimize false negatives. In the construction of the cascade classifiers,
the previous strong classifier can derive a positive result. Then, the result can rigger
the next classifier which is adjusted to get a higher detection rate than the last one.
3. MATERIAL AND METHODOLOGY
shown in Figure 12.
Figure 12: Flowchart of cascade model [44]
Generally, a lower threshold value results in higher detection rates and higher
false positive rates [24]. Therefore, the threshold value can be adjusted to detect the
license plate with high accuracy.
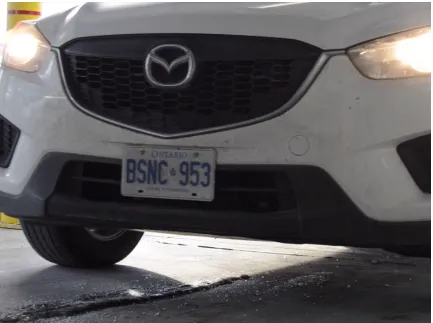
The proposed system has a good performance in detecting license plates on images
with various types of illumination. Figure 13 and Figure 14 illustrate two examples
of detection on the images with illumination. In the first case, there is a cover on
the license plate. However, its LBP and HOG features still can be extracted and
detected. In the second case, the noise does not affect the detection result. Both of
them are detected successfully.
3.2.2
Processing with license plate recognition
The preprocessing stage consists of three stages, which are plate orientation, image
Figure 13: Detection on an image with the covered plate
Figure 14: Detection on an image with noise
Plate orientation
In most cases, the camera capturing the vehicle image is not just directly in front of
the vehicle, which means that there will be an angle with degree between the camera
and the vehicle. Figure 15 shows the positions of camera and vehicle when the vehicle
3. MATERIAL AND METHODOLOGY
From the image, we can see that the camera is in front of the vehicle at the right
hand side.
Figure 16: Vehicle image captured by the camera
From the related work, the edge-based detection gives us an idea to process with
the plate image. With the image extracted from the previous step, we can detect the
lines of the plate via Canny edge detection, which is a multi-stage algorithm to detect
3. MATERIAL AND METHODOLOGY
Algorithm 2 Canny edge detection
1. Use the Gaussian filter G(m,n) to smooth out the image f(m, n).
g(m, n) = G(m, n)∗f(m, n) (8)
where G(m, n) = √1
2πσ2 exp (−
m2+n2
2σ2 )
2. Compute gradient of g(m, n) using any of gradient operators to reach
M(m, n) =pgm2(m, n) +gn2(m, n) (9) θ(m, n) = tan−1[gn(m, n)/gm(m, n)] (10)
The gradient operator can be Soble operator.
gm(m, n) =
+1 0 −1
+2 0 −2 +1 0 −1
∗f(m, n) (11)
gn(m, n) =
+1 +2 +1
0 0 0
−1 −2 −1
∗f(m, n) (12)
3. Threshold M is given as:
MT(m, n) =
(
M(m, n) if M(m, n)> T
0 otherwise (13)
After computing the threshold value M, we can derive the four edges of the license
plate. Whereas, four corners of the plate are extracted from the four edges. It does
not matter whether the region we extracted is rectangle. Because the four corners
can be taken as four corresponding points. At the same time, the four target points
are the four corners of one rectangle shape. We can calculate a perspective transform
one for recognition. The transformation is:
˜
p0 =Hp,˜ (14)
where H is a 3×3 transformation matrix, ˜p is the coordinate of the corresponding quadrangle vertices in the destination image, ˜pis the coordinate of quadrangle vertices
in the source image. To obtain an inhomogeneous resultp, coordinates are normalized
by the following formula.
px =
h00x+h01y+h02
h20x+h21y+h22
, py =
h10x+h11y+h12
h20x+h21y+h22
(15)
With this formula, we can project the source image into a destination image in
a two-dimensional space. For testing the limitation of the program, we tested the
image with the degree ranging from 30◦ to 75◦. Figure 17 shows an example of this
procedure. From the results, we can see that when the degree reach to around 75◦,
the result image become blurry and the characters are extremely hard to recognize
by the program.
Image binarization
Image normalization, also known as the image binarization, is one processing stage
for character recognition, and also can separate foreground from the background [6].
An ideal text image can be extracted through the binarization procedure, in which
the characters are in white, and background with complicated objects is in black.
Numerous binarization methods have been proposed over past ten years or so. Among
them, there are four methods, which can obtain a good result for recognition.
1. Adaptive method. In this algorithm, threshold value is calculated for a small
re-gions of the image. Different rere-gions has different threshold values. “Threshold
value is the weighted sum of neighbourhood values where weights are a gaussian
window.” [30]
3. MATERIAL AND METHODOLOGY
(a)
(b)
(c)
sliding a rectangular window over the gray level image.” [21] The computation
is given by the equation below:
TN iblack =m+ 0.2∗
r
1 N P
X
(pi−m)2 (16)
wherem is mean value of the pixelspi,N P is the number of pixels in the image.
3. Sauvola’s Algorithm [39]. It is modified algorithm from Niblack’s Algorithm.
TSauvola=m∗(1−0.5∗(1− s
128)) (17)
where m is mean value of the pixels, ands is the standard deviation.
4. Wolf’s Algorithm [47].
Twolf = (1−k)∗m+k∗M + k∗s
R (m−M) (18)
where k is set to 0.5 by authors in [wolf2004extraction], m is the mean value
of the image, M is the minimum gray value of the image and R is set to the
maximum gray value. Standard deviation is obtained over all the local
neigh-borhoods.
Figure 18 is an original license plate image for binarization used in our test.
Figure 19 is the comparison of four binarization methods. From the results, we
cannot find which method is the best since the image we captured is good in quality.
However, when we select a blurred or low quality license plate image, we can see
that the results. Figure 20 is the original image. Figure 21 is the comparison of four
binarization methods with a blurred image. From our experiments, we conclude that
the Wolf algorithm is better than the other three approaches. Hence, from previous
work [21] and our own tests, the Wolf Algorithm appears to be the best approach for
3. MATERIAL AND METHODOLOGY
Figure 18: A clear original License plate image
Figure 19: Comparison of different binarization methods on a clear image
Figure 21: Comparison of different binarization methods on a blurred image
Character bounding box detection
To obtain a better result for recognition, the province label before the characters
and the tag line after it should be removed from the processed license image from
the previous step. Therefore, with the binarization image extracted, we can detect
contours which can be explained simply as a curve joining all the continuous points
(along the boundary), having same color or intensity [31] . Our procedure takes
contours as one tool for character analysis and text line detection. The following
Figure 22 is an example of contours detection. In this phase, all contours in the
license plate image are detected by the system. However, the contours that we need
is those around the characters. Therefore, the small contours above the numbers and
below numbers are filtered through one method. In this method, bounding rectangle
algorithm [36] can be used to find minimal up-right rectangle for the specified point
set. For computing the minimum height of the rectangle, we find a relationship
between character height and plate size from our dataset:
3. MATERIAL AND METHODOLOGY
Figure 22: Procedure for contours detection
Figure 23: Procedure for contours filter and text line detection
where Hplate is the height of the license plate and Hcharacter is the height of the
characters. Hence, if the height of bounding rectangle is smaller than Hplate, all the
contours in it will be removed. Consequently, a couple of text lines are determined by
the program. The Figure 23 presents the example of text line detection procedure.
3.2.3
Character segmentation
Character segmentation is an operation that attempts to decompose an image of
a sequence of characters into individual ones [5]. As one preprocess of character
recognition, its result can highly affect the performance of recognition. In this stage,
characters separation method is used in the image extracted from previous stage. As
a result, the individual character are obtained from character segmentation phase to
carry out the process of identification.
In our system, to isolate all the characters, histogram calculation is used to find
gaps in the plate characters. Histogram is a plot which can describe the intensity
distribution of an image, in which X-axis denote the column of the image which is
from 1 to the width of the image, and Y-axis represent number of the pixel which
Figure 24: Procedure for character segmentation
characters are detected, which determine the bounding box for each symbol in the
license plate. Figure 24 is an example of character segmentation procedure.
3.2.4
Character recognition
Character recognition, popularly referred as Optical Character Recognition(OCR) is
a very important stage in the proposed system. OCR is the automatic process of
converting typed, handwritten, or printed text to machine-encoded text that we can
access and manipulate via a string variable. In recent decades, with the development
of the computer vision techniques, the OCR has been one of the challenging and
popular fields of research in pattern recognition. Serval methods have been proposed,
such as template-matching and structure analysis method.
Nevertheless, we can take OCR as one of the classification problem in the image
processing step, since the most crucial step in OCR is identifying characters as one
of 36 symbols (A-Z and 0-9). Therefore, for classification, we need to extract visual
features from individual character image.Then, character can be classified with these
features using machine learning. The most effective way for now is OCR-tesseract,
which is originally developed by Hewlett Packard in the 1980s. It is one of the
most accurate open source OCR engines currently available. As other traditional
procedures, this processing follow a step by step approach. As the most important
part, recognition consists of two stages, which are adaptive classification and repeating
recognition, respectively. In the first stage, each character is recognized sequentially.
Additionally, the symbol that is classified is stored by the adaptive classifier as the
training data. Then, the adaptive classifier will learn the information that classified
3. MATERIAL AND METHODOLOGY
Figure 25: Flowchart of OCR process
be classified again. This two-stage process make this method accurate and efficient.
The Figure 25 is the flowchart of the OCR approach.
Finally, the above five main stages build up our proposed ALPR system. However,
as we discussed before, only license plate information cannot correctly detect and
identify the vehicle. Hence, in next two parts, we introduce the province detecting
3.3
Province detection
In most provinces in Canada, there are tag lines to describe the province on the
license plate. In contour detection phase, we use a filter function to discard the small
contours, which may be in the tag lines. Therefore, in this processing, what we need
to test is the plate extracted just from the license plate detection procedure. Since
the character of the province name is too small to recognize in the license plate image,
the features of the symbol of the province need to be taken into consideration.
A feature is a piece of information that can describe the image, such as edges,
corners, blobs and ridges. Generally, features are used as a starting phase for may
computer vision algorithms, which is known as feature detection. Feature detection is
a procedure for determining whether the given image features can be found in other
images. Hence, the detected features become a key to find other images which have
the same features.
In our proposed system, the character area has been detected by the contours
detection phase, which stands below the tag lines. Therefore, the tag lines can be
determined, which is located in the top or the bottom of the plate. Next, to detect
the feature, FAST (Features from Accelerated Segment Test) algorithm [35]will be
used. Other detectors do well in performance, such as SIFT (Scale-Invariant Feature
Transform) [25] and SURF (Speeded-Up Robust Features) [3]. However, in a
real-time application, real-time complexity is one of key point which need to be taken into
consideration. FAST, which keeps good performance in detecting features, is several
times faster than other existing feature detectors. The following lists the steps of the
feature detection.
1. Select a pixel pfrom the province area and its intensity IP
2. Threshold value t will be set manually. In our system, the value is chosen as 5,
which can make the program more sensitive to the corners in a image.
3. 16 Surrounding pixels are determined as one set G.
3. MATERIAL AND METHODOLOGY
than IP + 5 or all darker than IP −5, pis determined as a corner.
5. Among the 16 pixels, four of them are tested, which are above, below, left and
right the pixel, respectively. If p is a corner, then at least three of these must
all be brighter thanIP+ 5 or darker thanIP −5. If neither of these is the case, then p can not be the corner.
The limitation of the program is that the algorithm is not robust if there exist
high levels of noise in the image. Additionally, the threshold can not be determined
automatically, which means, inappropriate threshold value will lead to slow speed and
poor performance in the test.
After that, with the extracted features, we need to use one approach to match the
image that we test. Hence, Brute-Force Matcher is used to match the features between
training dataset and testing images. Initially, the matcher will store the features of
training images into one dataset. Then, the descriptor of one feature is matched with
the test image via distance calculation. Finally, the name of the province is obtained
by searching the smallest distance value.
3.4
Vehicle shape detection and recognition
In our system, the camera is active when the vehicle come to the monitoring area
such as entry lane of the parking facility. To detect the vehicle, LBP, HOG, and
Cascading classifiers are employed as the same way for the plate detection.
In this phase, the result that we want to derive is the type of the vehicle, such as
SUV, pickup or sedan. Therefore, the task can be considered as image classification,
which assigns an input image one label from a fixed set of categories. In
machin-ing learnmachin-ing, extractmachin-ing features of the object are indispensable part of procedure.
However, in vehicle categorization program, it is extremely hard to get useful
fea-tures without noise from the image with various illumination. Histogram of oriented
gradients (HOG), Region-based Shape Descriptor (RSD), Edge Histogram Descriptor
(a)
(b)
(c)
Figure 26: Feature matching examples
because similar objects have so closed feature descriptors that normal classification
cannot classify them with high accuracy. Therefore, Neural Networks are employed
in the procedure, which can progressively improve performance by considering
ex-amples. Additionally, among them, convolutional neural network (CNN) is the best
approach in image processing application.
CNN, which is very similar to ordinary Neural Network, consists of a serval neurons
that have learnable weights and biases. In the procedure, each neuron receives some
inputs, performs a dot product and follows it with a nonlinearity. Meanwhile, unlike
3. MATERIAL AND METHODOLOGY
Figure 27: Camera position for vehicle shape recognition
width, height, depth. Therefore, in our system, the vehicle image of side view captured
from the camera, its width and height would be the dimension of the image, and the
depth would be 3 (Red, Green and Blue). In CNN architecture, four layers are
employed for training data and performing a test. Fig28 shows the classification
result of CNN.
1. Convolutional layer. Each neuron in it computes a dot product between and a
small region of the vehicle image
2. Rectified Linear Units (RELU) Layer. It will apply a thresholding function.
4. Fully Connected (FC) Layer. It will compute the class score.
Figure 28: Result of classification using CNN
After vehicle detection and recognition, the system can identify the vehicle along
with the license plate number and province information. In detail, when the license
plate number is derived by ALPR system, the machine will search the database with
the number to get the information of the vehicle. The information is the license
plate’s registration province and the vehicle’s shape type. Comparing the
informa-tion with the result computed from province detecinforma-tion procedure and vehicle shape
detection and recognition procedure, we can find whether the vehicle is legal or not
and determine whether the plate is affixed on another vehicle.
3.5
Evaluation
To evaluate the results of our system, accuracy will be set to the benchmark. It can
be calculated by following formula:
accuracy = T P +T N
T P +T N +F P +F N, (20)
where TP is the number of true positive samples and ALL is the number of all samples,
TN is the number of true negative samples. TP and TN are the number of samples
which are classified correctly by some methods. False positive and false negative are
3. MATERIAL AND METHODOLOGY
Specifically, in license plate detection system, there are no negative samples in the
dataset, which means every image contains a license plate. Hence, the accuracy of
the detection system should be calculated by following formula:
Detection accuracy = The number of detected license plates
The number of all license plates (21)
In recognition system, accuracy for character recognition is calculated by below
formula:
Recognition accuracy = ncr
N (22)
wherencris the number of characters which are recognized correctly. N is the number
of all characters in the dataset.
The accuracy of the whole system is derived by following formula:
Recognition accuracy = ncp Ni
(23)
wherencpis the number of the image, in which the license plate is detected and each
character is recognized correctly. Ni is the number of all images in the dataset.
In license plate detection and vehicle shape detection and recognition,
Cross-validation[22] is used to evaluate the methods. It is a model validation for estimating
how good a classification model will perform in practice. In our system, 10-fold cross
validation is considered as the main function for evaluation. In the method, our image
dataset is divided randomly into 10 disjoint sets of equal size. Next, our classifier is
trained 10 times. At each time, one of the 10 groups is left out for testing. The other
9 sets are used for training. Finally, we can derive 10 error rates. Mean error rate is
computed by below formula:
er = e1+e2+e3+· · ·+e10
10 , (24)
where er the mean error rate and ei is the error rate obtained by each training
Result and discussion
4.1
Platform and hardware
1. Developing language: python with OpenCV,
2. Operation system: ubuntu 16.04 LTS
3. CPU: 1.6GHZ Inter Core i5
4. Memory: 4GB, 1333MHz DDR3
4.2
Input
For evaluation of the our system and comparison with other approaches, vehicle
im-ages captured by the entrance of a public parking garage are used both for training
and testing. The dataset contains 500 images of resolution 1280× 720. We have extracted license plate image from the each image. Then the program extracts LBP
and HOG features from the them, which are for detection. For vehicle shape
clas-sification, cars dataset from [23] are used as training image dataset of CNN. In the
dataset, we group all of the images into four classes, which are sedan, SUV, pickup
and hatchback. With the four groups, we build a model to recognize the type of
![Figure 1: ALPR applied in Law enforcement [13]](https://thumb-us.123doks.com/thumbv2/123dok_us/1356485.1168474/13.612.110.540.71.340/figure-alpr-applied-in-law-enforcement.webp)
![Figure 3: License plate samples from different provinces in Canada [43]](https://thumb-us.123doks.com/thumbv2/123dok_us/1356485.1168474/17.612.115.533.72.359/figure-license-plate-samples-from-dierent-provinces-canada.webp)
![Figure 4: Classification of vehicles [23]](https://thumb-us.123doks.com/thumbv2/123dok_us/1356485.1168474/19.612.123.539.81.563/figure-classication-of-vehicles.webp)
![Figure 12: Flowchart of cascade model [44]](https://thumb-us.123doks.com/thumbv2/123dok_us/1356485.1168474/41.612.136.532.121.340/figure-flowchart-of-cascade-model.webp)