25
16
I
WET Sensor Technique to Evaluate Soil Moisture
Distribution Patterns under Different Discharge
Rates
E.M. Hokam
Soil and Water Department, Faculty of Agriculture, Suez Canal University, Ismailia, Egypt.
NSURANCE precise placement of water and fertilizer in active root
…….zone is based on suitable moisture distribution pattern under point source emitter, consequently, is affected by some soil properties and emitter discharge rate. This investigation aims to evaluate the patterns of soil moisture distribution under different discharge rates for two different soils (sandy and loamy). The studied discharge rates were 1.8, 4.6 and 8 L h-1, in addition to flooding application for comparison. Study also aims to detect the reliability of applying equivalent water depth equation particularly when water is trickling. For all treatments, soil moisture was measured using a moisture meter called "WET sensor" which calibrated in Lab. for both soils before field work. Validation of Schwartzman and Zur’s model as a simplified semi-empirical method to determine the geometry of wetted soil volume was to detect both studied soils as an additional objective. The obtained results showed a high correlation between sensor reading and oven-dried value, introduced high R2 values equaled 0.999 and 0.9804 for sandy and loamy soil, respectively. Based on the designed wetted soil volume, results showed that the best moisture distribution was recorded under 4.6 L h-1 and flooding treatment for sandy soil, while recorded under 1.8 and 4.6 L h-1 rates for loamy soil. Generally, the application rate of 4.6 L h-1 could achieved the desired moisture distribution in both soils, therefore, this trickling rate should be selected in such soils than the other. Applying of equivalent water depth equation, showed that desired progression of wetting front appeared to be closely achieved under flooding treatment in sandy soil than in loamy. So, flooding irrigation could be successfully applied on sandy soil with rationally water amounts. Therefore, from view point of wastewater, nutrients loss and soil contamination, flooding could be more safety compared to the other treatments. On the other hand, applying the same equation for loamy soil could only achieved by 87 % and 67 % of the desired moisture for a given depth under 8.0 L h-1 and flooding treatments,
cost. Considering the difficult in measuring both laterally and vertically water movement, obtained results showed a good agreement between simulated of Schwartzman-Zur's model and field observations particularly for loamy soil than sandy.
Keywords: Emitter discharge, Equivalent water depth, Moisture pattern, Wetted soil volume.
Moisture distribution patterns under point source trickle emitters are an important factor for the design and operation of trickle irrigation system. Nutrients uptake and fertilizer unit efficiency are related closely to soil moisture distribution, consequently, affecting plant growth and quality. This consideration should provide high water use efficiency but only if the system is designed to meet the soil and plant condition, i.e., texture and root distribution, respectively. The wetted soil volume and moisture patterns under a point source trickle system is important to be known and considered as a function of soil texture, amount of applied water and discharge rate (Schwartzman and Zur, 1986, Phene, 1995, Watson et al., 1995, Lubana et al., 2002, Moncef et al., 2002, Cook et al., 2006, Ainechee et al., 2009 and Omran et al., 2012). Ainechee et al. (2009) concluded that an increased in the value of soil hydraulic conductivity representing a shift to lighter soils results in an increase in the ratio of the wetted soil depth to the wetted soil width. Therefore, more transmissive soil has greater wetted depth and smaller wetted width than more slowly permeable soil. Their results showed that extension application of water the value of wetted width changes little in sandy soil but is still increasing in silt clay loamy soil, therefore, doubling the value of emitter discharge tends to increase the surface wetted radius and depth.
Soil particle size is a significant factor in how water moves through soil. Water moves more rapidly in the sandy soil because the capillary conductivity of the larger pores is greater. On the other hand, clay soil has small pores and attracts water more strongly than the sandy soil with large pores, but transmits it more slowly. Generally, short duration time will minimize deep percolation of applied water, but may also confine the lateral distribution of water near the dripper. On the other hand, when longer run time is used with the same discharge rate, the distribution of applied water will be increased. In fine textured soils, the horizontal and vertical extension of wetting front moves with approximately similar velocity, but in coarse textured soils, the vertical velocity component of wetting front is more than the horizontal component, which causes more deep percolation in such soils under point source application of water (Fletcher and Wilson, 1983, Clark, 1992, Al-Qinna and Awwad, 2001, and Nafchi et al., 2011).
Egypt. J. Soil Sci. 54, No. 4 (2014) efficiency due to a large amount of wasted water, especially for coarse soil compared to the fine one. According to Hokam et al. (2011) when irrigation water calculated based on the equivalent water depth equation, and applied using a drip irrigation system double wetted depth of irrigated soil could be reached to the desired moisture content. They reported that this finding may resulted because of the water amounts were applied to a limited point (under emitter), while the calculation was based on a specific area. Therefore, a second important objective of this study was to detect the feasibility to apply equivalent water depth equation, EWDE, successfully for all discharge rates on both studied soils, where the maximum allowable depletion technique used as a management method for irrigation scheduling.
In general, wetting pattern can be obtained by measuring moisture contents either in laterally or vertically direction. Considering the difficult in deeper downward direction, a simulation model could be conducted to predict the water movement in two direction. The model of Schwartzman and Zur (1986) was developed as a simplified semi-empirical method for determining the geometry of wetted soil zone under line source of water application placed on soil surface. They assumed that the geometry of wetted soil (wetted width and depth) at the end of irrigation depends on soil type, emitter discharge and total amount of water. So, an additional objective of this study was to detect the validation of the semi-empirical method of Schwartzman and Zur for determining the geometry of wetted soil volume under point sources in the two soil types.
Material and Methods
The experiment was conducted in five stages as following: 1) Calibration for moisture meter (WET sensor), has been carried out in Soil and Water lab. (Faculty of Agr., Suez-Canal Uni.), 2) Evaluation of emitter discharge, in the same lab., 3) Planning of irrigation scheduling, 4) Applying water and field measurements of soil moisture distribution under different discharge rates and 5) Detection the validation of Schwartzman-Zur's model to predict the geometry of wetted soil volume.
Theories
WET sensor
meter calculates Soil Moisture using its calibration tables (water has a dielectric constant ε ˷ 81, compared to soil ˷ 4, and air ˷ 1). Whally (1993) and White et al. (1994) have shown that there is a simple relationship between the complex refractive index (equivalent to the square root of ε) and the volumetric water content, θ, as following:
√ ε = a0 + a1* θ (1)
θ = (√ ε – a0) / a1 (2)
Where a0 and a1 are specific parameters of soil. They could be obtained experimentally and are unique for each soil type. These parameters are used with a linearization table, in the Meter, to convert the sensor output (in mV) into soil moisture readings. For mineral soil the a0 and a1 coefficients are permanently installed in the Moisture Meter as 1.6 and 8.4 for a0 and a1, respectively, according to Roth et al. (1992).
Irrigation scheduling: maximum allowable depletion (MAD)
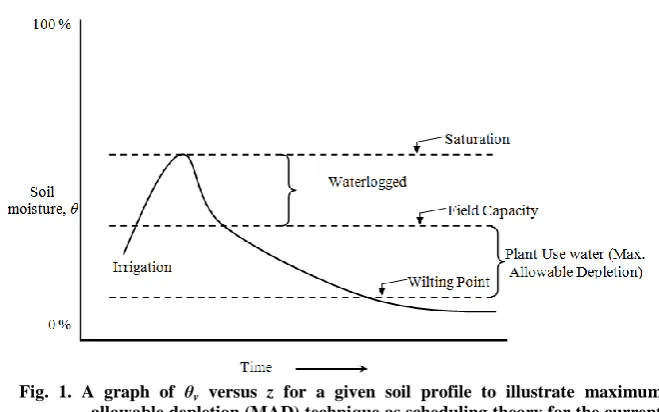
There are several possible approaches could be used for irrigation scheduling or rational applied water, each one may be adapted or no adapted according to many conditions. The most precise one is the process to determine exactly when and how much water to apply to a defined soil profile, consequently, soil profile will be returned to field capacity. Maximum allowable depletion (MAD) technique may provides an average 35 % savings in water and energy (Sassenrath, 2011). Theoretically, Figure 1 illustrate that the rational water amount is that allowable amount of water can be withdrawn from the soil between two irrigations without stressing the crop to the point where significant reduction in crop yield or quality (i.e., MAD = θf c – θi, where θi is initial
moisture content). However and for successful apply of MAD-theory, easy monitoring for soil moisture under field conditions using the portable moisture meter, accuracy irrigation scheduling could be achieved by application of Equivalent Water Depth equation, EWDE:
(3)
Where Deq is the equivalent water depth in unit length, that represented
water amount θv required to return a defined soil depth Z to field capacity, Δz is
the soil depth interval.The units of Deq should converted in L m-2. This equation
shows that Deq can be calculated by the product of the volumetric water content
and the depth interval Δz for each soil layer i, which differs in its field capacity.
i n
i
i z i v z
z d z v eq
D
0 0
Egypt. J. Soil Sci. 54, No. 4 (2014) Fig. 1. A graph of θv versus z for a given soil profile to illustrate maximum
allowable depletion (MAD) technique as scheduling theory for the current study.
Schwartzman-Zur model
According to Schwartzman and Zur (1986) their model should be used for surface drip irrigation to predict the geometry of wetted soil volume: width (W) and depth (Z) at the end of drip irrigation technique. The wetted soil volume was assumed to be dependent on emitter discharge (q), total amount of applied water (V) and saturated hydraulic conductivity (Ks) of soil. So, the functional relationship for these parameters can be written as following:
and (4)
2
Three dimensional terms were developed using dimensional analysis and are represented as following:
, and (5)
Using experimental V, Z and W and estimated values of V*, Z* and W* the graphical relationships between dimensionless parameters V* versus Z*, and V* versus W* could be obtained, then data will fitted to obtain the optimum regression equation from which the exponents n1 and n2, and the constants A1
and A2 could be extracted and putted in the following relationships to obtain
wetted width and depth:
V
q
Ks
f
W
1,
,
Z
f
2
V
,
q
,
Ks
and (6)
Experiments
WET sensor calibration
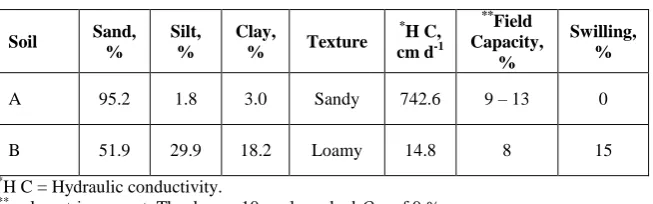
Sensor readings had found to give over/under-values for soil moisture content compared to that oven-dried. To convert the sensor readings to reliable values, a calibration process was carried out in Soil and Water Lab., for which ten different moist soil samples were involved for both studied soils. After that the relationship between WET-Readings and its corresponded soil moisture contents (oven-dried) was studied using simple regression equations analysis. This analysis was used to determine an equation used to obtain the correct soil moisture content measured either in the Lab. or field. Directly before oven drying, WET sensor inserted and readings were recorded in the same ten soil samples. The correlation coefficients of both data (i.e., WET readings versus gravimetric values) were also computed to select the most fitted equation.
Water applications and field measurements
Table 1 showed some physical properties for the tow soil types used, on which the different application treatments were conducted. The emitters used in this investigation (Self compensation, Euro Key – class) were evaluated in Lab. to provide three various rates of water discharge (1.8, 4.6 and8 L h-1). The used emitters were placed on the top of soil surface and connected to water reservoir of 2 m in height. The three different emitter discharges were used to give the same water volume, 8.25 and 63.25 L which represented the water depleted from soil to bring 0.25 and 0.5 m2 of soil by 0.4 m depth back to its field capacity for sandy and loamy soil, respectively. At the end of application duration, evaporation from wetted soil surface has been prevented.
TABLE 1. Some physical properties of studied soils.
Soil Sand, %
Silt, %
Clay,
% Texture
*
H C, cm d-1
**Field
Capacity, %
Swilling, %
A 95.2 1.8 3.0 Sandy 742.6 9 – 13 0
B 51.9 29.9 18.2 Loamy 14.8 8 15
*
H C = Hydraulic conductivity.
**
volumetric percent. The deeper 10 cm layer had Ɵf.c. of 9 %.
Egypt. J. Soil Sci. 54, No. 4 (2014) The measurements were achieved each 5 cm increments horizontally and 10 cm vertically. Where the limitation of WET usage is the difficulty to be inserted deeper than 8 cm, so, measuring in next 10 cm soil layer required the removal of previous layer. For each soil layer surface wetting diameter has been measured. Water distribution pattern and uniformity was assessed using the software Surfer program version 8.
Results and Discussion
Sensor calibration
Calibration of WET sensor showed that its readings were over/under-values for soil moisture content in comparison to that oven-dried samples. Calibration processes was conducted using 10 different moist soil samples (varied from air dry to saturated) for both studied soils. Appling the simple regression equations indicated that optimum equation to represent the relationship between device-readings and soil moisture (oven dried) were exponential and polynomial (third order) regression equations, which gave good accuracy with R2 of 0.9997 and 0.9804 for sandy and loamy soil respectively. Figure 2 showed the calibration curves could be used directly to obtain the corrected moisture content or using the regression equation. The results showed that the sensor is suitable for moisture monitoring at different distances and depths. It is quick responses time, but the limitation is the difficulty to be inserted deeper than8 cm.
Wetting front progression
Irrigation scheduling applied here was based on equivalent water depth equation, EWDE, represented the most precision and timely-work low cost. The feasibility to apply EWDE was an important objective of this investigation. Hokam et al. (2011) reported that soil moisture content resulted from irrigation water (calculated based on EWDE) applied by drip irrigation system, penetrated the soil to a double depth of that calculated, and brought it back to soil field capacity. They attributed this finding to the fact that the water amounts were applied for a limited point, while it was planned for one plant area.
Fig. 2. Calibration curves: WET – Readings versus and gravimetric moisture values, for both sandy (A) and loamy (B) soils.
WET Reading, vol. %
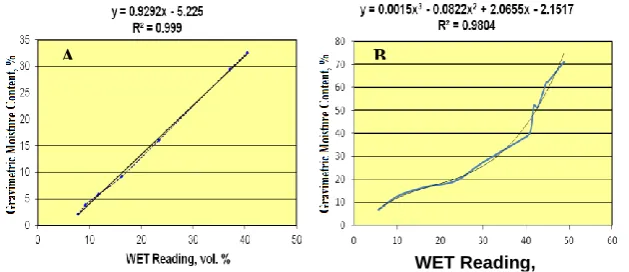
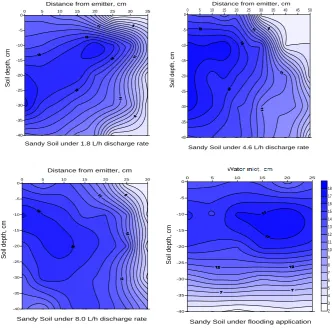
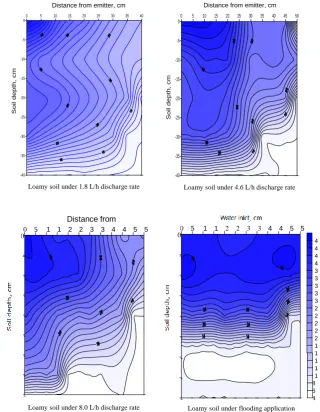
Therefore, the applied water amounts were calculated using EWDE to bring 40 cm soil depth to its field capacity, then checked the moisture pattern under the three different discharges and flooding application. Figure 3 illustrates the progression of wetting front in both studied soils under flooding application. The Figure showed that wetting front was progressed closely to the desired depth (40 cm) in sandy soil, while it reached only 27 cm in loamy soil (i.e., achieved 67.5 % of the desired or planed depth). This result indicated good agreement between the calculated soil depth wetted to field capacity and that found experimentally. Consequently, in sandy soil, irrigation process could be successfully achieved under flooding application when water amounts are rationally calculated using EWDE. Additionally, field observations showed that wetting front (with small diameters) progressed deeper than 50 cm in sandy soil under the three emitters, therefore, wastewater, nutrients loss and soil contamination are expected. Therefore, while flooding application for rationally water amount are more safety in sandy soil, it is not recommended for loamy soil. This declination to achieve EWDE for irrigation scheduling in loamy soil may be attributed to the dominance of lateral movement of water rather than the downward gravity force, which plays a main role in moisture distribution. Also, the declination may be associated somewhat to the swelling phenomena found in such soil (i. e., 15 %, Table 1).
Moisture pattern
Water trickling from a point source takes place in the soil and moves downwards and sideways. To detect the dimensional transit flows occur differentially based on the discharge rate and soil texture, the three different discharge rates (i.e., 1.8, 4.6 and 8.0 L h-1) were applied on each soil type (i.e. Sandyand loamy).Where the main problem in such situation is how to express moisture distributed radial in two dimensions, the software surfer program (version 8) has been used to produce the wetting patterns. Moisture meter data obtained from field experiment (where measurements were taken 5 cm
Wetting front 40
cm
27 cm
Sa
nd
Lo
am
y
Egypt. J. Soil Sci. 54, No. 4 (2014) increments horizontally and 10 cm vertically) were involved in surfer program. The obtained results showed that soil moisture distribution values under each emitter discharge were varied from each to other either in the same soil or from soil to other under the same rate. The smallest wetting diameter was related to the discharge rate of 1.8 L h-1, this is in good agreement with that found by Ainechee et al. (2009) and Nafchi et al. (2011). Generally, Figures 4 and 5 indicated that soil moisture distribution and its uniformity within the soil profile under surface drip was to great extent affected by soil texture rather than emitter discharge, while the factor dominantly affected the moisture pattern was the emitter discharge under the same texture. Also, the results showed that the treatments to be recommended as they resulted in the most suitable moisture distribution are 4.6 L h-1 and flooding application compared to the other two discharges.
The results could be attributed to the fact that just as sandy soil included large pores, water moves downward more quickly than through smaller pores. When the soil becomes saturated as happened under 8 L h-1 discharge rate, gravity becomes the dominant force moving water downward, therefore, water moved and penetrated more deeply in the sandy soil, while under 4.6 L h-1 the discharge rate brought the soil high moisture content but was not so as rapid to prepare the opportunity for air trapped, consequently, increasing the laterally water movement. The results also shown that increasing the emitter discharge from 1.6 L h-1 to 4.6 L h-1 tends to increase the wetted soil width from 35 to 50 cm, respectively, as shown in Table 2, a similar result was obtained by Ainechee et al. (2009) who found that the surface wetted radius and depth increased with an increase in application rates of emitters from 1.38, 2.17 and 3.46 L h-1. Therefore, sandy soils under drip irrigation should irrigated under discharge rate not more than 4 or 5 L h-1 to maintain adequate water pattern and maintain the plant nutrition with minimum losses below the root zone, this result is agreed with that reported by Watson et al. (1995). In other words, when the same soil irrigated with 4.6 L h-1 discharge, soil pores are not open to free water (as the case occurred under 8 L h-1), so water moves primarily by capillary action around the voids until the soil become saturated, so gravity dominates and causing to move downward. However, the two forces that make water move through soil (i. e., gravitational and capillary) act simultaneously in soils.
such condition when water is applied with high rate, it moves outward almost as far as it moves downward.
Fig. 4: Moisture distribution patterns in sandy soil under different application rates.
Furthermore, because of finesoil (loamy soil) exhibited the swelling phenomena (determined value = 15 %, Table 1), a similar conclusion was reported by Gal et al. (1990). This means that soil may included expended clay minerals which hinders the downward water movement. Under both 8.0 L h-1 and flooding applications the wetting front did not reached the desired soildepth (i.e., 40 cm) for which irrigation amount was calculated, therefore the recommended discharge for such soil are 1.8 and 4.6 L h-1. However, application duration which known as the time needed to apply the water consumed since previous irrigation must be considered for energy cost. Generally, and in traditional drip irrigation practice, it may ranged between 1 and 16 hr and should not be continuous. If more than 16 hr are needed, the number of emitters should be increased and at the same time water
0 5 10 15 20 25 30
-40 -35 -30 -25 -20 -15 -10 -5 0
Distance from emitter, cm
S o il d e p th , cm
Sandy Soil under 8.0 L/h discharge rate
0 5 10 15 20 25 30 35
-40 -35 -30 -25 -20 -15 -10 -5 0
Sandy Soil under 1.8 L/h discharge rate
S o il d e p th , c m
Distance from emitter, cm
0 5 10 15 20 25 30 35 40 45 50
-40 -35 -30 -25 -20 -15 -10 -5 0
Distance from emitter, cm
S o il d e p th , cm
Sandy Soil under 4.6 L/h discharge rate
0 5 10 15 20 25
-40 -35 -30 -25 -20 -15 -10 -5 0 2 3 4 5 6 7 8 9 10 11 12 13 14 15 16 17 18
Distance from emitter, cm
S o il d e p th , c m
Egypt. J. Soil Sci. 54, No. 4 (2014) pounding or runoff may be starts (Marsh et al., 1982). According to the major aim of this investigation, and to overcome the extend application duration, doubling of 1.8 L h-1 emitters may be acceptable for both soil types, but not acceptable for 4.6 L h-1 emitters, because it resulted in poor soil moisture distribution either for sandy or loamy soil. So, selection of emitter with appropriate discharge for a particular soil is essentially to insure appropriate irrigation management, consequence, achieving high water- and nutrient-use efficiency.
Fig. 5. Moisture distribution patterns in Loamy soil under different application rates.
0 5 10 15 20 25 30 35 40
-40 -35 -30 -25 -20 -15 -10 -5 0
Distance from emitter, cm
S o il d e p th , c m
Silty loam soil under 1.8 L/h discharge rate
0 5 1
0 1 5 2 0 2 5 3 0 3 5 4 0 4 5 5 0 5 5 -4 0 -3 5 -3 0 -2 5 -2 0 -1 5 -1 0 -5 0 Distance from emitter, cm S oil d e pt h, c m
Silty loamy soil under 8.0 L/h discharge rate
0 5 1
0 1 5 2 0 2 5 3 0 3 5 4 0 4 5 5 0 5 5 -4 0 -3 5 -3 0 -2 5 -2 0 -1 5 -1 0 -5 0 4 6 8 1 0 1 2 1 4 1 6 1 8 2 0 2 2 2 4 2 6 2 8 3 0 3 2 3 4 3 6 3 8 4 0 4 2 4 4 4 6 Distance from emitter, cm S oil d e pt h, c m
Silty loamy soil under flooding application
0 5 10 15 20 25 30 35 40 45 50
-40 -35 -30 -25 -20 -15 -10 -5 0
Distance from emitter, cm
S o il d e p th , c m
Silty loam soil under 4.6 L/h discharge rate
Loamy soil under 1.8 L/h discharge rate Loamy soil under 4.6 L/h discharge rate
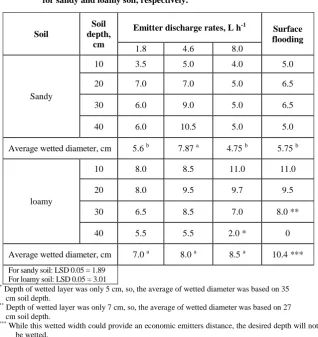
Ratio of wetted width to wetted depth
Data listed in Table 2 revealed that the most important properties contributed to the geometry of wetted soil volume (represented by the ratio of wetted width to wetted depth) were soil texture emitter discharge. For both soils, the results showed that not these characters were correlated with wetted width and depth in the same manner. For example, wetted width to depth ratio was increased from upper to lower layers in sandy soil, while this ratio was decreased from upper to lower in loamy soil. On the other hand, the same ratio was increased as discharge increased in loamy for all layers, while in sandy soil ratio was increased from 1.8 to 4.6 L h-1, then decreased under 8.0 l h-1. Therefore, bubbler application may be not recommende either for sandy or loamy soils. Assuming that desired wetted depth for both soil was 40 cm, and the desired width was 50 and 70 cm for sandy and loamy soil, respectively, then the width/depth ratio will be 0.5 and 0.7 for sandy and loamy soil, respectively. Therefore, data in Table 2 indicated that 4.6 L h-1 and flooding treatments on sandy soil may achieved the designed ratio than the other two discharges. On the other hand, 8.0 L h-1 and flooding treatments for loamy soil could achieve the designed ratio but not for the desired depth, therefore, 1.8 and 4.6 are the recommended discharges for such loamy soil. Values of soil saturated hydraulic conductivity, Ks, listed in Table 1 indicated that an decreased in Ks-value from 742.6 cm d-1 to 14.8 cm d-1 representing a shift from coarse to fine soil resulted in an decrease in the wetted ratio, particularly in the upper two layers, these results are in agreement with those found by this is good agreed with that found by Clark (1992) and Ainechee et al. (2009). Generally, doubling the value emitter discharge on loamy soil tends to increase the wetted soil width more than to decrease the wetted depth, while in the case of sandy soil, it tends to increase the wetted depth more than to increase the wetted width. Clearly, and because the irrigation was scheduled to obtain a wetted widths of 0.50 and 0.70 m for sandy and loamy soil, respectively, with 0.4 m soil depth, the average wetted diameter (Table 2) could be used to make a decision support. So, 47.5cm (represented 0.8 L h-1 on sandy soil) and 85 cm – 103.3 cm extended to depth shorter than 0.4 m (represented 0.8 L h-1 and flooding treatment for loamy soil) must be excluded at irrigation management.
Egypt. J. Soil Sci. 54, No. 4 (2014) distance. On the other side, although the most wetted width was obtained under 8.0 L h-1 and flooding application, both 1.8 and 4.6 L h-1 discharges with accepted wetted width could reached the desired soil depth in the regard of irrigation scheduling.
TABLE 2. Values of wetted width to wetted depth ratio for both soils recorded under different treatments. Total applied water, V, was 8.2 and 63.25 L for sandy and loamy soil, respectively.
* Depth of wetted layer was only 5 cm, so, the average of wetted diameter was based on 35 cm soil depth.
** Depth of wetted layer was only 7 cm, so, the average of wetted diameter was based on 27 cm soil depth.
***
While this wetted width could provide an economic emitters distance, the desired depth will not be wetted.
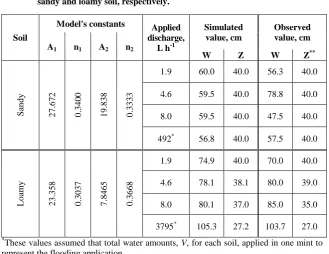
Simulated and observed data
Field observations showed that the most transmissive soil (i.e., sandy where K = 742 cm d-1) showed greater wetted depth, Z, and smaller values of wetted width, W, compared to the other more slowly soil (loamy soil where Ks= 14.8 cm d-1). Generally, and due to the difference among discharges, values of W and Z observably changed. Practically, these changes are strongly related either to laterally and vertically roots distribution or emitter spacing. Schwartzman-Zur model has been developed to predict these wetted parameter (i.e., W and Z) and tested in this study to detect its precision to use for field detections. The
Soil
Soil depth,
cm
Emitter discharge rates, L h-1 Surface flooding
1.8 4.6 8.0
Sandy
10 3.5 5.0 4.0 5.0
20 7.0 7.0 5.0 6.5
30 6.0 9.0 5.0 6.5
40 6.0 10.5 5.0 5.0
Average wetted diameter, cm 5.6 b 7.87 a 4.75 b 5.75 b
loamy
10 8.0 8.5 11.0 11.0
20 8.0 9.5 9.7 9.5
30 6.5 8.5 7.0 8.0 **
40 5.5 5.5 2.0 * 0
Average wetted diameter, cm 7.0 a 8.0 a 8.5 a 10.4 *** For sandy soil: LSD 0.05 = 1.89
simulated values of W and Z obtained using Schwartzman-Zur's model were computed and compared with those measured in the field. Data listed in Table 3, showed that there was good agreement (particularly, for loamy soil) between the simulated values and observed values strengthens our confidence in the validity of this empirical equation, to use for point source water application. There was a poor relationship between simulated W and that observed for sandy soil. This poor relation between the model-Values for sandy soil have been found also either by Ekhmaj et al. ( 2006) using Hydrus 2D model or Ainechee et al. (2009) using Schwartzman-Zur model. The regulated manner in the relation between wetted volume (represented by W and Z) in loamy soil compared to that hysterically in sandy, may be attributed to the different in Ks values. In the case of loamy soil, the absolutely increasing the laterally wetting compared to vertical direction may be due to that all different discharges were more than water penetrating through the soil. Thus water will be accumulated in upper layers leads to horizontally movement as well as a chance for capillary rise of water, So, cone moisture appears delightful rather than length (Fig. 5).
TABLE 3. Comparison between observed and simulated values of wetted width, W and wetted depth, Z according to Schwartzman-Zur model, Eq. 6, in which V values were 8.2 and 63.25 and Ks were 742.6 and 14.8 cm d-1 for sandy and loamy soil, respectively.
*
These values assumed that total water amounts, V, for each soil, applied in one mint to represent the flooding application.
**
Actual wetted depth in sandy soil excised 40 cm, while the observed depth was limited here to 40 cm because the irrigation scheduling was achieved to this depth back to its field capacity.
Soil
Model's constants Applied discharge,
L h-1
Simulated value, cm
Observed value, cm A1 n1 A2 n2
W Z W Z**
S
an
d
y
2
7
.6
7
2
0
.3
4
0
0
1
9
.8
3
8
0
.3
3
3
3
1.9 60.0 40.0 56.3 40.0
4.6 59.5 40.0 78.8 40.0
8.0 59.5 40.0 47.5 40.0
492* 56.8 40.0 57.5 40.0
Lo
am
y
2
3
.3
5
8
0
.3
0
3
7
7
.8
4
6
5
0
.3
6
6
8
1.9 74.9 40.0 70.0 40.0
4.6 78.1 38.1 80.0 39.0
8.0 80.1 37.0 85.0 35.0
Egypt. J. Soil Sci. 54, No. 4 (2014) Conclusion
Irrigation decision-making must be depended on a good description of soil moisture patterns in both laterally and vertically directions. Assessing of soil moisture status under surface drip irrigation systems, is a function of soil texture and discharge rate, thus it is a pre-requisite successful irrigation management. Both WET sensor meter and Surfer program could be used as reliably techniques for detection of laterally and vertically soil moisture pattern. Obtained results indicated that soil moisture distribution and its uniformity within the soil profile under surface drip was greatly affected by emitter discharge and soil texture. Regarding to appropriate moisture distribution, it is preferably to use discharge rates of 1.8 and 4.6 L h-1 for both soils, while bubbler application (8 L h-1) may be not recommende either for sandy or loamy soil, because the last two techniques could not achieved the desired wetted volume (i.e., wetted width and wetted depth). Irrigation scheduling based on equivalent water depth equation was found to be successfully applicable for sand soil compared to the loamy. To quantify the geometry wetted volume in soil, Schwartzman-Zur's model could be reliably used particularly for loamy soil than the sandy, in which the model provides an accurate description about the wetted width and depth ratio.
References
Ainechee, G., Boroomand-Nasab, S. and Behzad, M. (2009) Simulation of soil wetting pattern under point source trickle irrigation. Journal of Applied Science9: 1170 – 1174.
Al-Qinna, M. and Awwad, A.M. (2001) Wetting patterns under trickle source in arid soils with surface crust. J. Agric. Engng. Res. 80 (3): 301 – 305.
Clark, G.A. (1992) Drip irrigation management and scheduling for vegetable production. Journal of HortTechnology 2: 32 – 37.
Cook, F.J., Fitch, P., Thorburn, P.J., Charlesworth, P.B. and Bristow, K.L. (2006) Modeling trickle irrigation: Comparison of analytical and numerical models for estimation of wetting front position with time. Environment Modeling & Software (in Omran 2012) 21: 1353 – 1359.
Ekhmaj, A.I., Amin, M.S., Almadny, A.H., Abdulaziz, A.M. and Aimrun, W. (2006) Simulation of soil water movement in sandy soil under a prairie field with Hydrus_2D model. The 2nd International Conf. on Water Resources & Arid Environment (2006).
Hokam, E.M., El-Sheikh, I. and Rashad, M.A. (2011) Optimizing greenhouse productivity: Effective Irrigation and Soil Warming. American-Euroasian J. Agric. & Environ. Sci. 11 (6): 824 – 833.
Gal, M., Wahittig, L.D. and Faber, B.A. (1990) Influence of clay on water movement in coarse-textured soils. J. Clay and Clay Minerals 38 (2) : 144 – 150.
Lubana, P.S., Narda, N.K. and Brown, L.C. (2002) Application of a hemispherical model to predict radius of wetted soil volume under point source emitters for trickle irrigated tomatoes in Punjab state. ASAE 32: 243 – 257.
Mitchell, J.K. and Lembke, W.D. (1981) Effect of discharge rate on distribution of moisture in heavy soil from an irrigated trickle source. ASAE Paper no. 81, 2081.
Marsh, A.W., Branson, R.L., Davis, S., Gustafson, C.D. and Aljibury, F.K. (1982) “Drip irrigation-Review Article”, Division of Agricultural Science, Vegetable Research & Information Center, pp. 2740 – 2743 , University of California.
Moncef, H., Daghari, H. Balti, J. and Maalej, M. (2002) Approach for predicting the wetting front depth beneath a surface point source: theory and numerical aspect. Irrig. Drain 51: 347 – 360.
Nafchi, R.F., Mosavi, F. and Parvanak, K. (2011) Experimental study of shape and volume of wetted soil in trickle irrigation method. African Journal of Agricultural Research 6: 458 – 466.
Omran, E., El-Masry, G. and Rashad, M.A. (2012) A new approach to assess wetting front map by image analysis technique for precision irrigation farming. International Conference of Agricultural Engineering, CIGR-AgEng, Valencia 8 – 12 July, 2012, Papers Book.
Phene, C.J. (1995) Research trends in micro irrigation. In: “Micro Irrigation for a Changing World: Conserving Resources/ Preserving the Environment” , F.R. Lamm (Ed.), Orlando, Florida, USA, 26 April 1995, Proceedings of the Fifth International Micro Irrigation Congress. American Society of Agricultural Engineers, St. Joseph, Michigan, pp. 6 – 24.
Roth, C.H., Malicki, M.A. and Plagge, R. (1992) Empirical evaluation of the relationship between soil dielectric constant and volumetric water content as the basis for calibrating soil moisture measurements. Journal of Soil Sci. 43: 1 – 13.
Schwartzman, M. and Zur, B. (1986) Emitter spacing and geometry of wetted soil volume. Journal of Irrigation and Drainage Engineering 112: 242 – 253.
Egypt. J. Soil Sci. 54, No. 4 (2014) Watson, J., Hardy, L., Cordell, T., Cordell, S., Minch, E. and Pachek, C. (1995) How
water moves through soil. A Guide to the Video. Cooperative Extension, College of Agriculture, University of Arizonz, 1995, Tucson, Arizonz 85721.
Whally, W.R. (1993) Considerations on the use of time time-domain reflectometry (TDR) for measuring soil moisture content. Journal of Soil Sci. 43: 1 – 13.
White, I., Knight, J.H., Zegelin, S.J. and Topp, G.C. (1994) Comments on " Considerations on the use of time-domain reflectometry (TDR) for measuring soil moisture content" by W. R. Whally. Journal of Soil Sci. 44: 1 – 9.
( Received 19/ 2 /2014; accepted 2 / 11 /2014)
ةفلتخم فرصت تلادعم تحت ةبرتلا ةبوطر عيزوت طامنأ مييقت
ـلا سحم مادختسإب
WET
ماكح محمد ماصع هايملاو يضارلأا مسق –
ةعارزلا ةيلك –
سيوسلا ةانق ةعماج –
ةيليعامسلإا –
رصم .
تاتابنلل ةطشنلا روذجلا ةقطنم يلإ ةيلاع ةءافكب ةدمسلأاو ءاملا ليصوت نامض نإ ةبرتلا لخاد ةبوطرلا عيزوت طمنل ديج باعيتسإو مهف بلطتي .
عيزوت طمن رثأتيو
نم لكب ةبوطرلا يرلا ءام هب فاضي يذلا فرصتلا لدعمو ةبرتلا صئاصخ
.
و تحت ةثداحلاو ،ةبرتلا لخاد ةبوطرلا عيزوت طامنأ مييقت يلإ ثحبلا اذه فدهي
ماوقلا يف نيفلتخم ةبرت نيعون يف كلذو ،ةفلتخم فرصت تلادعم (
ةبرت امهادحإ
ةيمول يرخلأاو ةيلمر .)
مت ت قحلا يف ةساردلا ل
لادعم ةعبرأ تحت كلذو ، ةفاضإ ت
هايملل ةفلتخم :
يهو طيقنت تلادعم ثلاث :
1,8 ، 4,6 و 8,0 رتل / ةفاضلإاب ،ةعاس
يف اهيلع دامتعلإا يدم مييقتلو ةنراقملا ضرغب كلذو رمغلا ةقيرط قيبطت ىلإ نيتبلاتلا لاك يف للاتبلإا ةهبج مدقت ةسارد للاخ نم كلذو ،يرلا ةيلمع ةلودج .
فرعم ىلإ ًاضيأ ةساردلا فدهت امك ءاملا قمع ةلداعم قيبطت نكمي يدم يأ يلإ ة
لكشب ئفاكملا يرلا ماظن تحت كلذو هيف قوثوم
لاب طيقنت . يوتحملا سايق مت دقل
عيمجل كلذو يسأرلاو يقفلأا نيهاجتلإا يف ةديدع تافاسم يلع ةبرتلاب يبوطرلا سحم هيلع قلطي ةبرتلا ةبوطر سايقل زاهج كلذ يف مدختسإ دقو ،تلاماعملا Sensor ـلا WET تدجو زاهجلا يلع تمت يتلا ةيئدبملا تارابتخلإل ًاقفوو ،
تمت دقو ،لقحلا يف همادختسإ لبق ادح يلع ةبرت عون لكل هترياعم ةرورض لمعملا لخاد ةرياعملا .
ةددعتم تافاسمو قامعأ يلع يبوطرلا عيزوتلا عبتت نأ امب
نم ءاوس ،بويعلا ضعب هنع جتني دق ،ةيلقحلا فورظلا تحت وأ ةبرتلا ةيحان
نامسترافش جذومن رابتخإ مت دقف ،تقولا وأ تابنلا
ةيبيرجت هبش ةقيرطك روست
ةبرتلاب ةبوطرلا عيزوتل يسدنهلا لكشلاب ءوبنتلا اهللاخ نم نكمي ةطيسب (
مجح
للبلا ) ًافده نيتبرتلا لاكل همادختسلإ جذومنلا اذه ةيحلاص يدم ةسارد ناكو ،
ةساردلا هذه يف ًايفاضإ .
ميقو زاهجلا تاءارق نيب ريبك طابترإ دوجو اهيلع لصحتملا جئاتنلا ترهظأ لماعم غلب ثيح ،نزولاو فيفجتلا ةقيرطب اهيلع لصحتملا يبوطرلا يوتحملا
ةساردل هيلع دامتعلإا نكمي سايقملا اذه نأ حضوي لخاد ةبوطرلا عيزوت عبتتو
ةبرتلا . ةبسنلاب هيلع لوصحلا نكمي يبوطر عيزوت لضفأ نأ جئاتنلا ترهظأ امك
فرصتلا لدعم يتلماعم تحت ناك ةيلمرلا ةبرتلل 4,6
رتل / رمغلا ةلماعمو ةعاس
نيلدعملاب ةنراقم كلذو 1,8
و 8,0 رتل / ةعاس . ناك دقف ةيموللا ةبرتلل ةبسنلاب امأ
ر عيزوت لضفأ نيتلماعملا تحت يبوط
1,8 و 4,6 رتل / ةعاس . مكحلا ةيعجرم تناك
يلع متي ،نيددحم قمعو ةيقفأ ةحاسم نييعت وه يبوطر عيزوت لضفأ يلع اهتفاضإ بولطملا هايملا ةيمك باسح امهساسأ .
ةهبج مدقت نأ يلع جئاتنلا تلد دقو
ديج لكشب هيلع لوصحلا نكمي للاتبلإا (
مادختسإ ةءافك نم عفري امم هايملا ةدحو
ةيدامسلا ةدحولا كلذكو )
ةفاضإ دنع كلذو ،ةلودجلا ةيلمع يف بوغرم وه امك
ةحيحص ةجردب كلذ ققحتي مل امنيب ةيلمرلا ةبرتلا يف رمغلا ةقيرطب يئاملا ننقملا ةبسنب طقف ققحت ثيح ،ةيموللا ةبرتلا يف 66
٪ .
لإا ليلحتلا لد دقف ،ًاعم ةلودجلاو ميمصتلا ةيحان نمو لضفأ نأ يلع يئاصح
طيقنت لدعم تحت امهيلع لوصحلا نكمي للب قمعو رطق 4,6
رتل / ةبرتلا يف ةعاس
نيلدعم تحتو ،ةيلمرلا 1,8
و 4,6 رتل / عم نكمي ثيح ،ةيموللا ةبرتلا يف ةعاس
ةديج للب لخادت ةقطنم يلع لوصحلا تلادعملا كلت (
نوكت ةلكشم نم للقي دق امم
تاطاقنلا لوح حلاملأا رئاود )
ددع ةيحان نم ةيداصتقإ نوكت نأ نكمي امك
دحاولا طخلا يلع تاطاقنلا .
ةيمكو ،ةبرتلاب يكيلورديهلا ليصوتلا ةيصاخل ًاقفو
ا فرصتلا لدعمو ةفاضملا هايمل طقف
. نامسترافش جذومن رابتخإ جئاتن تلد
-روست
كلتو جذومنلا نم ةبوسحملا للبلا قمعو ضرع ميق نيب ريبك قفاوت كانه نأ ،لقحلا ةبرجت يف ةلجسملا همادختسإ نكميو