Noise-Contrastive Estimation of Unnormalized Statistical Models,
with Applications to Natural Image Statistics
Michael U. Gutmann [email protected]
Aapo Hyv¨arinen [email protected]
Department of Computer Science
Department of Mathematics and Statistics
Helsinki Institute for Information Technology HIIT University of Helsinki, Finland
Editor: Yoshua Bengio
Abstract
We consider the task of estimating, from observed data, a probabilistic model that is parameterized by a finite number of parameters. In particular, we are considering the situation where the model probability density function is unnormalized. That is, the model is only specified up to the partition function. The partition function normalizes a model so that it integrates to one for any choice of the parameters. However, it is often impossible to obtain it in closed form. Gibbs distributions, Markov and multi-layer networks are examples of models where analytical normalization is often impossible. Maximum likelihood estimation can then not be used without resorting to numerical approximations which are often computationally expensive. We propose here a new objective func-tion for the estimafunc-tion of both normalized and unnormalized models. The basic idea is to perform nonlinear logistic regression to discriminate between the observed data and some artificially gener-ated noise. With this approach, the normalizing partition function can be estimgener-ated like any other parameter. We prove that the new estimation method leads to a consistent (convergent) estimator of the parameters. For large noise sample sizes, the new estimator is furthermore shown to be-have like the maximum likelihood estimator. In the estimation of unnormalized models, there is a trade-off between statistical and computational performance. We show that the new method strikes a competitive trade-off in comparison to other estimation methods for unnormalized models. As an application to real data, we estimate novel two-layer models of natural image statistics with spline nonlinearities.
Keywords: unnormalized models, partition function, computation, estimation, natural image statistics
1. Introduction
This paper is about parametric density estimation, where the general setup is as follows. A sample
X= (x1, . . . ,xTd) of a random vectorx∈R
n is observed which follows an unknown
probabil-ity densprobabil-ity function (pdf)pd. The data-pdf pdis modeled by a parameterized family of functions {pm(.;θ)}θ whereθ is a vector of parameters. It is commonly assumed that pd belongs to this
family. In other words,pd(.) =pm(.;θ⋆)for some parameterθ⋆. The parametric density estimation
normalized pdfpm(.; ˆθ)which satisfies Z
pm(u; ˆθ)du= 1, pm(.; ˆθ)≥0. (1)
These are two constraints in the estimation.
If the modelpm(.;θ)is such that the constraints hold for allθ, and not onlyθˆ, we say that the
model is normalized. The maximum likelihood principle can then be used to estimateθ. If the model is specified such that the positivity constraint but not the normalization constraint is satisfied for all parameters, we say that the model is unnormalized. By assumption there is, however, at least one value of the parameters for which an unnormalized model integrates to one, namelyθ⋆. In order to highlight that a model, parameterized by some α, is unnormalized, we denote it by p0
m(.;α).
Unnormalized models are easy to specify by taking, for example, the exponential transform of a suitable function.
The partition functionZ(α),
Z(α) =
Z
p0m(u;α)du, (2)
can be used to convert an unnormalized modelp0
m(.;α)into a normalized one:p
0
m(.;α)/Z(α)
inte-grates to one for every value ofα. Examples of distributions which are often specified by means of an unnormalized model and the partition function are Gibbs distributions, Markov networks or mul-tilayer networks. The functionα7→Z(α)is, however, defined via an integral. Unlessp0
m(.;α)has
some particularly convenient form, the integral cannot be computed analytically so that the function
Z(α)is not available in closed form. For low-dimensional problems, numerical integration can be used to approximate the functionZ(α)to a very high accuracy but for high-dimensional problems this is computationally expensive. Our paper deals with density estimation in this case, that is, with density estimation when the computation of the partition function is analytically intractable and computationally expensive.
Several solutions for the estimation of unnormalized models which cannot be normalized in closed form have been suggested so far. Geyer (1994) proposed to approximate the calculation of the partition function by means of importance sampling and then to maximize the approximate log-likelihood (Monte Carlo maximum log-likelihood). Approximation of the gradient of the log-log-likelihood led to another estimation method (contrastive divergence by Hinton, 2002). Estimation of the pa-rameterαdirectly from an unnormalized modelp0
m(.;α)has been proposed by Hyv¨arinen (2005).
This approach, called score matching, avoids the problematic integration to obtain the partition function altogether. All these methods need to balance the accuracy of the estimate and the time to compute the estimate.
In this paper,1 we propose a new estimation method for unnormalized models. The idea is to
consider Z, orc= ln 1/Z, not any more as a function ofα but as an additional parameter of the model. That is, we extend the unnormalized modelp0
m(.;α)to include a normalizing parameterc
and estimate
lnpm(.;θ) = lnp0m(.;α) +c,
with parameter vectorθ= (α, c). The estimateθˆ= ( ˆα,cˆ)is then such that the unnormalized model
p0
m(.; ˆα)matches the shape ofpd, whileˆcprovides the proper scaling so that Equation (1)holds.
Unlike in the approach based on the partition function, we aim not at normalizingp0
m(.;α)for all
αbut only forαˆ. This avoids the problematic integration in the definition of the partition function
α7→Z(α). Such a separate estimation of shape and scale is, however, not possible for maximum likelihood estimation (MLE). The reason is that the likelihood can be made arbitrarily large by setting the normalizing parameter c to larger and larger numbers. The new estimation method which we propose here is based on the maximization of a well defined objective function. There are no constraints in the optimization so that powerful optimization techniques can be employed. The intuition behind the new objective function is to learn to classify between the observed data and some artificially generated noise. We approach thus the density estimation problem, which is an unsupervised learning problem, via supervised learning. The new method relies on noise which the data is contrasted to, so that we will refer to it as “noise-contrastive estimation”.
The paper is organized in four main sections. In Section 2, we present noise-contrastive estima-tion and prove fundamental statistical properties such as consistency. In Secestima-tion 3, we validate and illustrate the derived properties on artificial data. We use artificial data also in Section 4 in order to compare the new method to the aforementioned estimation methods with respect to their statistical and computational efficiency. In Section 5, we apply noise-contrastive estimation to real data. We estimate two-layer models of natural images and also learn the nonlinearities from the data. This section is fairly independent from the other ones. The reader who wants to focus on natural image statistics may not need to go first through the previous sections. On the other hand, the reader whose interest is in estimation theory only can skip this section without missing pieces of the theory al-though the section provides, using real data, a further illustration of the workings of unnormalized models and the new estimation method. Section 6 concludes the paper.
2. Noise-Contrastive Estimation
This section presents the theory of contrastive estimation. In Section 2.1, we motivate noise-contrastive estimation and relate it to supervised learning. The definition of noise-noise-contrastive es-timation is given in Section 2.2. In Section 2.3, we prove that the estimator is consistent for both normalized and unnormalized models, and derive its asymptotic distribution. In Section 2.4, we dis-cuss practical aspects of the estimator and show that, in some limiting case, the estimator performs as well as MLE.
2.1 Density Estimation by Comparison
Density estimation is much about characterizing properties of the observed dataX. A convenient way to describe properties is to describe them relative to the properties of some reference dataY. Let us assume that the reference (noise) dataY is an i.i.d. sample(y1, . . .yTn)of a random variable y∈Rnwith pdfpn. A relative description of the dataXis then given by the ratiopd/pnof the two density functions. If the reference distributionpnis known, one can, of course, obtainpdfrom the
ratiopd/pn. In other words, if one knows the differences betweenXandY, and also the properties
ofY, one can deduce from the differences the properties ofX.
Denote byU = (u1, . . . ,uTd+Tn) the union of the two setsX andY, and assign to each data
pointut a binary class labelCt: Ct= 1 ifut∈X andCt= 0if ut∈Y. In logistic regression,
the posterior probabilities of the classes given the data are estimated. As the pdf pd of the data x is unknown, we model the class-conditional probabilityp(.|C= 1)with pm(.;θ).2 The
class-conditional probability densities are thus
p(u|C= 1;θ) =pm(u;θ), p(u|C= 0) =pn(u).
The prior probabilities areP(C= 1) =Td/(Td+Tn)andP(C= 0) =Tn/(Td+Tn). The posterior
probabilities for the classes are therefore
P(C= 1|u;θ) = pm(u;θ)
pm(u;θ) +νpn(u), P(C= 0|u;θ) =
νpn(u)
pm(u;θ) +νpn(u), (3)
whereνis the ratioP(C= 0)/P(C= 1) =Tn/Td. In the following, we denoteP(C= 1|u;θ)by h(u;θ). Introducing the log-ratioG(.;θ)betweenpm(.;θ)andpn,
G(u;θ) = lnpm(u;θ)−lnpn(u), (4)
h(u;θ)can be written as
h(u;θ) =rν(G(u;θ)), (5)
where
rν(u) = 1
1 +νexp(−u) (6)
is the logistic function parameterized byν.
The class labels Ct are assumed Bernoulli distributed and independent. The conditional
log-likelihood is given by
ℓ(θ) =
Td+Tn X
t=1
CtlnP(Ct= 1|ut;θ) + (1−Ct) lnP(Ct= 0|ut;θ)
=
Td X
t=1
ln [h(xt;θ)] + Tn X
t=1
ln [1−h(yt;θ)]. (7)
Optimizingℓ(θ)with respect toθleads to an estimateG(.; ˆθ)of the log-ratioln(pd/pn). That is,
an approximate description ofXrelative toY can be obtained by optimization of Equation(7). The sign-flipped objective function,−ℓ(θ), is also known as the cross-entropy error function (Bishop, 1995).
Thus, density estimation, which is an unsupervised learning problem, can be performed by logistic regression, that is, supervised learning. While this connection has been discussed earlier by Hastie et al. (2009, Chapter 14.2.4, pp. 495–497), in the next sections, we will prove that even unnormalized models can be estimated with the same principle.
2. Classically,pm(.;θ)would, in the context of this section, be a normalized pdf. In our paper, however,θmay include
2.2 Definition of the Estimator
Given an unnormalized statistical modelp0
m(.;α), we include for normalization an additional
pa-rametercinto the model. That is, we define the model as lnpm(.;θ) = lnp0m(.;α) +c,
whereθ= (α, c). The parametercscales the unnormalized modelp0
m(.;α)so that Equation(1)can
be fulfilled. After learning,cˆprovides an estimate forln 1/Z( ˆα). If the initial model is normalized in the first place, no such inclusion of a normalizing parametercis needed.
In line with the notation so far, we denote by X = (x1, . . . ,xTd) the observed data set that
consists ofTdindependent observations ofx∈Rn. We denote byY = (y1, . . . ,yTn)an artificially
generated data set that consists ofTn=νTdindependent observations of noisey∈Rnwith known
distributionpn. The estimator is defined to be the argumentθˆT which maximizes
JT(θ) =
1
Td
Td X
t=1
ln [h(xt;θ)] + Tn X
t=1
ln [1−h(yt;θ)]
, (8)
where the nonlinearityh(.;θ)was defined in Equation(5). The objective functionJT is, up to the
division byTd, the log-likelihood in Equation(7). It can also be written as
JT(θ) =
1
Td Td X
t=1
ln [h(xt;θ)] +ν
1
Tn Tn X
t=1
ln [1−h(yt;θ)]. (9)
Note thath(.;θ)∈(0 1), where zero is obtained in the limit ofG(.;θ)→ −∞and one in the limit ofG(.;θ)→ ∞. Zero is an upper bound forJT, which is reached if, for allt,h(xt;θ)andh(yt;θ)
tend to one and zero, respectively. Therefore, the optimal parameterθˆT is such thatG(ut; ˆθT)is as
large as possible forut∈Xand as small as possible forut∈Y. Intuitively, this means that logistic
regression has learned to discriminate between the two sets as well as possible.
2.3 Properties of the Estimator
We characterize here the behavior of the estimatorθˆT for large sample sizesTdand fixed ratioν.
Sinceνis kept fixed,Tn=νTdwill also increase asTdincreases. The weak law of large numbers
shows that asTdincreases the objective functionJT(θ)converges in probability toJ,
J(θ) = E{ln [h(x;θ)]}+νE{ln [1−h(y;θ)]}. (10)
Let us denote byJ˜the objectiveJ seen as a function offm(.) = lnpm(.;θ),
˜
J(fm) = E{ln [rν(fm(x)−lnpn(x))]}+νE{ln [1−rν(fm(y)−lnpn(y))]}. (11)
We start the characterization of the estimatorθˆT by describing the optimization landscape forfm.
The following theorem shows that the data-pdfpd can be found by maximization ofJ˜, that is by
learning a nonparametric classifier under the ideal situation of an infinite amount of data.
Theorem 1 (Nonparametric estimation) J˜attains a maximum atfm= lnpd. There are no other
The proof is given in Appendix A.2. A fundamental point in the theorem is that the maximization is performed without any normalization constraint forfm. This is in stark contrast to MLE, where
exp(fm)must integrate to one. With our objective function, no such constraints are necessary. The
maximizing pdf is found to have unit integral automatically.
The positivity condition forpnin the theorem tells us that the data-pdfpdcannot be inferred at
regions in the data space where there are no contrastive noise samples. For example, the estimation of a pdfpdwhich is nonzero only on the positive real line by means of a noise distributionpnthat
has its support on the negative real line is impossible. The positivity condition can be easily fulfilled by taking, for example, a Gaussian as contrastive noise distribution.
In practice, the amount of data is limited and a finite number of parameters θ∈Rm specify
pm(.;θ). This has two consequences for any estimation method that is based on optimization: First, it restricts the space where the data-pdfpdis searched for. Second, it may introduce local maxima
into the optimization landscape. For the characterization of the estimator in this situation, it is normally assumed thatpd follows the model, so that there is aθ⋆ with pd(.) =pm(.;θ⋆). In the
following, we make this assumption.
Our second theorem shows thatθˆT, the value of θwhich (globally) maximizesJT, converges
toθ⋆. The correct estimate ofpdis thus obtained as the sample sizeTdincreases. For unnormalized
models, the conclusion of the theorem is that maximization ofJT leads to the correct estimates for
both the parameterαin the unnormalized pdfp0
m(.;α)and the normalizing parameterc.
Theorem 2 (Consistency) If conditions (a) to (c) are fulfilled thenθˆT converges in probability to
θ⋆,θˆT →P θ⋆.
(a) pnis nonzero wheneverpdis nonzero
(b) supθ|JT(θ)−J(θ)|→P 0 (c) The matrixIν =R
g(u)g(u)TPν(u)pd(u)duhas full rank, where
g(u) =∇θlnpm(u;θ)|θ⋆, Pν(u) =
νpn(u) pd(u) +νpn(u)
.
The proof is given in Appendix A.3. Condition (a) is inherited from Theorem 1. Conditions (b) and (c) have their counterparts in MLE (see for example Wasserman, 2004, Theorem 9.13): We need in (b) uniform convergence in probability ofJT toJ; in MLE, uniform convergence of the
log-likelihood to the Kullback-Leibler divergence is required likewise. Condition (c) assures that for large sample sizes, the objective functionJT becomes peaked enough around the true valueθ⋆.
This imposes a constraint on the modelpm(.;θ)via the vectorg. A similar constraint is required in
MLE.
The next theorem describes the distribution of the estimation error(ˆθT −θ⋆)for large sample
sizes. The proof is given in Appendix A.4.
Theorem 3 (Asymptotic normality) √Td(ˆθT −θ⋆)is asymptotically normal with mean zero and
covariance matrixΣ,
Σ=I−ν1−
1 +1
ν
I−ν1E(Pνg) E(Pνg)TI−ν1,
From the distribution of√Td(ˆθT−θ⋆), we can easily evaluate the asymptotic mean squared error
(MSE) of the estimator.
Corollary 4 For large sample sizesTd, the mean squared errorE
||θˆT−θ⋆||2
equalstr(Σ)/Td.
Proof Using that for any vectorv,||v||2= tr(vvT), the corollary follows directly from the
defini-tion of the MSE and Theorem 3.
2.4 Choosing the Noise
Theorem 3 shows that the noise distributionpn and the ratioν=Tn/Td have an influence on the
accuracy of the estimateθˆT. A natural question to ask is what, from a statistical standpoint, the best
choice ofpnandν is. Our result on consistency (Theorem 2) also includes a technical constraint
forpnbut this one is so mild that many distributions will satisfy it.
Theorem 2 shows that, for a given samples size Td, Pν tends to one as the size Tn of the
contrastive noise sample is made larger and larger. This implies that for large ν, the covariance matrixΣdoes not depend on the choice of the noise distributionpn. We have thus the following
corollary.
Corollary 5 Forν→ ∞,Σis independent of the choice ofpnand equals Σ=I−1−I−1E(g) E(g)TI−1, whereE(g) =R
g(u)pd(u)duandI=Rg(u)g(u)Tpd(u)du.
The asymptotic distribution of the estimation error becomes thus independent frompn. Hence, as
the size of the contrastive-noise sampleY increases, the choice of the contrastive-noise distribution becomes less and less important. Moreover, for normalized models, we have the result that the estimation error has the same distribution as the estimation error in MLE.
Corollary 6 For normalized models, noise-contrastive estimation is, in the limit ofν→ ∞, asymp-totically Fisher-efficient for all choices ofpn.
Proof For normalized models, no normalizing parametercis needed. In Corollary 5, the function
gis then the score function as in MLE, and the matrixIis the Fisher information matrix. Since the expectationE(g)is zero, the covariance matrixΣis the inverse of the Fisher information matrix.
The corollaries above give one answer to the question on how to choose the noise distributionpnand
the ratioν: Ifνis made large enough, the actual choice ofpnis not of great importance. Note that
this answer considers only estimation accuracy and ignores the computational load associated with the processing of noise. In Section 4, we will analyze the trade-off between estimation accuracy and computation time.
For any givenν, one could try to find the noise distribution which minimizes the MSEE||ˆθT−
θ⋆||2. However, this minimization turns out to be quite difficult. Intuitively, one could think that a good candidate for the noise distributionpnis a distribution which is close to the data distribution pd. Ifpnis too different frompd, the classification problem might be too easy and would not require
Corollary 7 Ifpn=pdthenΣ=
1 +1ν I−1−I−1E(g) E(g)TI−1.
Proof The corollary follows from Theorem 3 and the fact thatPν equalsν/(1 +ν)forpn=pd.
For normalized models, we see that forν= 1,Σis two times the inverse of the Fisher information matrix, and that forν= 10, the ratio is already down to 1.1. For a noise distribution that is close to the data distribution, we have thus even for moderate values ofν some guarantee that the MSE is reasonably close to the theoretical optimum.
To get estimates with a small estimation error, the foregoing discussion suggests the following
1. Choose noise for which an analytical expression forlnpnis available.
2. Choose noise that can be sampled easily.
3. Choose noise that is in some aspect, for example with respect to its covariance structure, similar to the data.
4. Make the noise sample size as large as computationally possible.
Some examples for suitable noise distributions are Gaussian distributions, Gaussian mixture dis-tributions, or ICA distributions. Uniform distributions are also suitable as long as their support includes the support of the data distribution so that condition (a) in Theorem 2 holds.
3. Simulations to Validate and Illustrate the Theory
In this section,3we validate and illustrate the theoretical properties of noise-contrastive estimation. In Section 3.1, we focus on the consistency of the estimator. In Section 3.2, we validate our theoret-ical results on the distribution of the estimation error, and investigate its dependency on the ratioν
between noise and data sample size. In Section 3.3, we study how the performance of the estimator scales with the dimension of the data.
3.1 Consistency
For the illustration of consistency, we estimate here the parameters of a zero mean multivariate Gaussian. Its log-pdf is
lnpd(x) =−
1 2x
TΛ⋆x+c⋆, c⋆=
−12ln|detΛ⋆| −n
2ln(2π)
, (12)
wherec⋆does not depend onxand normalizespdto integrate to one. The precision matrixΛ⋆is the
inverse of the covariance matrix. It is thus a symmetric matrix. The dimension ofxis heren= 5. As we are mostly interested in the estimation of unnormalized models, we consider here the hypothetical situation where we want to estimate the model
lnp0m(x;α) =−1 2x
TΛx
without knowing how to normalize it in closed form. This unnormalized model is a pairwise Markov network with quadratic node and edge potentials (see for example Koller and Friedman, 2009, Chap-ter 7). The parameChap-ter vectorα∈R15contains the coefficients of the lower-triangular part ofΛas the
matrix is symmetric. For noise-contrastive estimation, we add an additional normalizing parameter
cto the model. The model that we estimate is thus
lnpm(x;θ) = lnp0m(x;α) +c.
The model has 16 parameters given by θ = (α, c). They are estimated by maximization of the objective function JT(θ) in Equation (8). We used a standard normal distribution for pn. The
optimization was performed with the nonlinear conjugate gradient algorithm of Rasmussen (2006).
3.1.1 RESULTS
The presented results are an average over 500 estimation problems where the true precision matrix
Λ⋆ was drawn at random with the condition number being controlled to be smaller than ten. The sampling ofΛ⋆ was performed by randomly sampling its eigenvalues and eigenvectors: We drew the eigenvalues from an uniform distribution on the interval [0.1 0.9]. The orthonormal matrix
Ewith the eigenvectors was created by orthogonally projecting a matrixMwith elements drawn independently from a standard Gaussian onto the set of orthonormal matrices:E= (MMT)−1/2
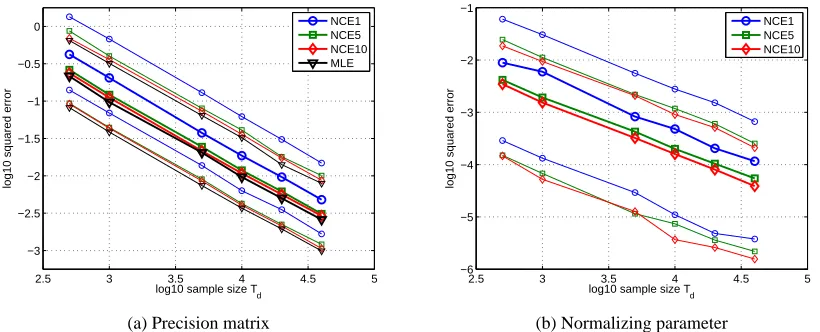
M. Figure 1(a) and (b) show the mean squared error (MSE) forα, which contains the elements of the precision matrixΛ, and the normalizing parameterc, respectively. The MSE as a function of the data sample sizeTddecays linearly on a log-log scale. This illustrates our result of consistency
of the estimator, stated as Theorem 2, as convergence in quadratic mean implies convergence in probability. The plots also show that taking more noise samples Tn than data samples Td leads
to more and more accurate estimates. The performance for noise-contrastive estimation withν=
Tn/Tdequal to one is shown in blue with circles as markers. For that value ofν, there is a clear
difference compared to MLE (black triangles in Figure 1(a)). However, the accuracy of the estimate improves strongly forν = 5(green squares) or ν= 10 (red diamonds) where the performance is rather close to the performance of MLE.
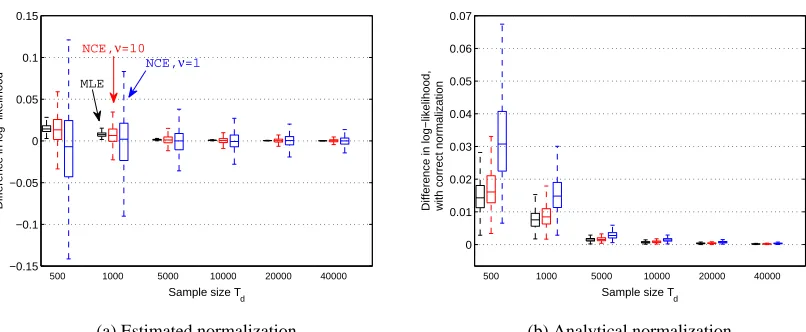
Another way to visualize the results is by showing the Kullback-Leibler divergences between the 500 true and estimated distributions. Figure 2 shows boxplots of the divergences for ν= 1 (blue) and ν= 10(red). The results for MLE are shown in black. In line with the visualization in Figure 1, the estimated distribution becomes closer to the true distribution as the sample size increases. Moreover, the divergences become clearly smaller asνis increased from one to ten.
For unnormalized models, there is a subtlety in the computation of the divergence. With a validation set of sizeTv, a sample versionDKLof the Kullback-Leibler divergence is given by the difference
DKL=
1
Tv Tv X
t=1
lnpd(xt)−
1
Tv Tv X
t=1
lnp0
m(xt; ˆα) + ln 1/Z( ˆα) !
.
The first term is the rescaled log-likelihood (average, sign-inverted log-loss) for the true distribution. The term in parentheses is the rescaled log-likelihoodLof the estimated model. In the estimation of unnormalized models, we do not assume to know the mappingα→Z(α)so thatLcannot be computed. With noise-contrastive estimation, we can obtain an estimateLˆ,
ˆ
L= 1
Tv Tv X
t=1
lnp0m(xt; ˆα) + ˆc, (13)
2.5 3 3.5 4 4.5 5 −3
−2.5 −2 −1.5 −1 −0.5 0
log10 sample size T
d
log10 squared error
NCE1 NCE5 NCE10 MLE
(a) Precision matrix
2.5 3 3.5 4 4.5 5
−6 −5 −4 −3 −2 −1
log10 sample size T
d
log10 squared error
NCE1 NCE5 NCE10
(b) Normalizing parameter
Figure 1: Validation of the theory of noise-contrastive estimation: Estimation errors for a 5 dimen-sional Gaussian distribution. Figures (a) and (b) show the mean squared error for the precision matrixΛand the normalizing parameter c, respectively. The performance of noise-contrastive estimation (NCE) approaches the performance of maximum likelihood estimation (MLE, black triangles) as the ratioν=Tn/Tdincreases: the case ofν= 1is
shown with blue circles,ν= 5with green squares, andν= 10with red diamonds. The thicker curves are the median of the performance for 500 random precision matrices with condition number smaller than ten. The finer curves show the 0.9 and 0.1 quantiles of the logarithm of the squared estimation error.
the true distribution. This happens becausecˆcan be an over or underestimate ofln 1/Z( ˆα). This result follows from Figure 2(b) where we have computedDKL with the analytical expression for
ln 1/Z( ˆα), which is available for the Gaussian model considered here, see Equation(12).
3.2 Distribution of the Estimation Error
We validate and illustrate further properties of our estimator using the ICA model (see for example Hyv¨arinen et al., 2001b)
x=As. (14)
In this subsection,n= 4, that isx∈R4, andA= (a1, . . . ,a4)is a4×4mixing matrix. The sources in the vectors∈R4 are identically distributed and independent from each other so that the data
log-pdflnpdis
lnpd(x) = n X
i=1
f(b⋆ix) +c⋆. (15)
Thei-th row of the matrixB⋆=A−1is denoted byb⋆i. We consider here Laplacian sources of unit variance and zero mean. The nonlinearityf and the constantc⋆, which normalizespdto integrate
to one, are in this case given by
f(u) =−√2|u|, c⋆= ln|detB⋆| −n
−0.15 −0.1 −0.05 0 0.05 0.1 0.15
Sample size T
d
500 1000 5000 10000 20000 40000
Difference in log−likelihood
MLE
NCE,ν=10
NCE,ν=1
(a) Estimated normalization
0 0.01 0.02 0.03 0.04 0.05 0.06 0.07
Sample size T
d
500 1000 5000 10000 20000 40000
Difference in log−likelihood, with correct normalization
(b) Analytical normalization
Figure 2: Validation of the theory of noise-contrastive estimation: Distributions of the Kullback-Leibler divergences between the true and estimated 5 dimensional Gaussians. For each sample size, from left to right, the results for maximum likelihood estimation (MLE) are shown in black, the results for noise-contrastive estimation (NCE) withν= 10in red, and the results forν= 1in blue. The sizeTv of the validation set was100000. For MLE, the results shown in Figures (a) and (b) are the same. For NCE, the divergences in Figure (a) were computed using the estimateˆcofln 1/Z( ˆα). In Figure (b), the analytical expression forln 1/Z( ˆα)was used.
As in Section 3.1, we apply noise-contrastive estimation to the hypothetical situation where we want to estimate the unnormalized model
lnp0
m(x;α) = n X
i=1
f(bix) (17)
without knowing how to normalize it in closed form. The parameter vectorα∈R16
contains the elements of the row vectorsbi. For noise-contrastive estimation, we add an additional normalizing
parametercand estimate the model
lnpm(x;θ) = lnp0m(x;α) +c,
withθ= (α, c). As for the Gaussian case, we estimate θ by maximizingJT(θ) in Equation(8)
with the nonlinear conjugate gradient algorithm of Rasmussen (2006). For the noise distributionpn, we used a Gaussian distribution with covariance matrix given by the sample covariance of the data.
3.2.1 RESULTS
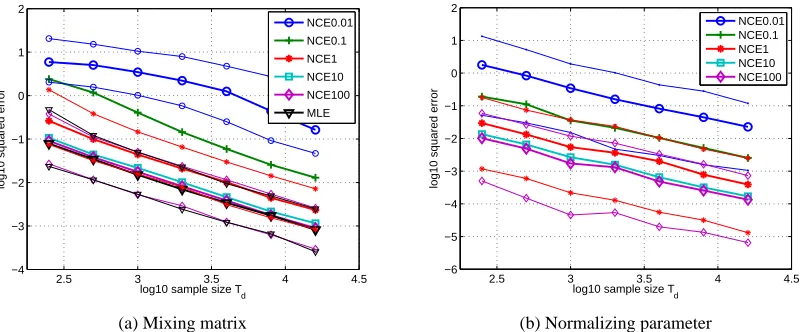
Figure 3(a) and (b) show the mean squared error (MSE) forα, corresponding to the mixing ma-trix, and the normalizing parameterc, respectively. As illustrated for the Gaussian case in Figure 1, this figure visualizes the consistency of noise-contrastive estimation. Furthermore, we see again that makingν=Tn/Tdlarger leads to a reduction of the error. The reduction gets, however, smaller
asνincreases. On average, changingν from one (red curve with asterisks as markers) to ten (light blue squares) reduces the MSE for the mixing matrix by 53%; relative toν= 10,ν= 100(magenta diamonds) leads to a reduction of 18%. Forc, the relative decrease in the MSE is 60% and 17%, respectively.
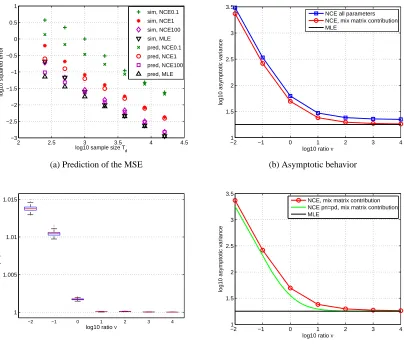
In Figure 4(a), we test the theoretical prediction of Corollary 4 that, for large samples sizesTd,
the MSE decays liketrΣ/Td. The covariance matrixΣcan be numerically evaluated according to
its definition in Theorem 3.4 This allows for a prediction of the MSE that can be compared to the
MSE obtained in the simulations. The figure shows that the MSE from the simulations (labelled “sim” in the figure) matches the prediction (“pred”) for largeTd. Furthermore, we see again that
for largeν, the performance of noise-contrastive estimation is close to the performance of MLE. In other words, the trace ofΣis close to the trace of the Fisher information matrix. Note that for clarity, we only show the curves forν∈ {0.1,1,100}. The curve forν= 10was, as in Figure 3(a) and (b), very close to the curve forν= 100.
In Figure 4(b), we investigate how the value of trΣ(the asymptotic variance) depends on the ratioν. Note that the covariance matrix Σincludes terms related to the parameter c. The Fisher information matrix includes, in contrast toΣ, only terms related to the mixing matrix. For better comparison with MLE, we show thus in the figure the trace ofΣboth with the contribution of the normalizing parameterc(blue squares) and without (red circles). For the latter case, the reduced trace ofΣ, which we will denote bytrΣB, approaches the trace of the Fisher information matrix.
Corollary 6 stated that noise-contrastive estimation is asymptotically Fisher-efficient for large values ofν if the normalizing constant is not estimated. Here, we see that this result also approximately holds for our unnormalized model where the normalizing constant needs to be estimated.
Figure 4(c) gives further details to which extent the estimation becomes more difficult if the model is unnormalized. We computed numerically the asymptotic variancetr ˜Σ if the model is correctly normalized, and compared it to the asymptotic variancetrΣBfor the unnormalized model.
The figure shows the distribution of the ratiotrΣB/tr ˜Σfor different values ofν. Interestingly, the
ratio is almost equal to one for all tested values ofν. Hence, additional estimation of the normalizing constant does not really seem to have had a negative effect on the accuracy of the estimates for the mixing matrix.
In Corollary 7, we have considered the hypothetical case where the noise distributionpnis the
same as the data distributionpd. In Figure 4(d), we plot for that situation the asymptotic variance as
a function ofν(green curve). For reference, we plot again the curve for Gaussian contrastive noise (red circles, same as in Figure 4(b)). In both cases, we only show the asymptotic variancetrΣB
for the parameters that correspond to the mixing matrix. The asymptotic variance for pn=pdis,
for a given value ofν, always smaller than the asymptotic variance for the case where the noise is Gaussian. However, by choosingν large enough for the case of Gaussian noise, it is possible to get estimates which are as accurate as those obtained in the hypothetical situation wherepn=pd.
Moreover, for largerν, the performance is the same for both cases: both converge to the performance of MLE.
2.5 3 3.5 4 4.5 −4
−3 −2 −1 0 1 2
log10 sample size T
d
log10 squared error
NCE0.01 NCE0.1 NCE1 NCE10 NCE100 MLE
(a) Mixing matrix
2.5 3 3.5 4 4.5
−6 −5 −4 −3 −2 −1 0 1 2
log10 sample size T
d
log10 squared error
NCE0.01 NCE0.1 NCE1 NCE10 NCE100
(b) Normalizing parameter
Figure 3: Validation of the theory of noise-contrastive estimation: Estimation errors for an ICA model with four sources. Figures (a) and (b) show the mean squared error for the mix-ing matrixBand the normalizing parameterc, respectively. The performance of noise-contrastive estimation (NCE) approaches the performance of maximum likelihood esti-mation (MLE, black triangles) as the ratioν =Tn/Td increases: the case ofν = 0.01
is shown with blue circles,ν = 0.1with green crosses,ν= 1with red asterisks,ν= 10 with light blue squares, andν = 100 with magenta diamonds. The thicker curves are the median of the performance for 500 random precision matrices with condition number smaller than ten. The finer curves show the 0.9 and 0.1 quantiles of the logarithm of the squared estimation error. To increase readability of the plots, the quantiles forν= 0.1 andν= 10are not shown.
3.3 Scaling Properties
We use the ICA model from the previous subsection to study the behavior of noise-contrastive estimation as the dimension n of the data increases. As before, we estimate the parameters by maximizingJT(θ)in Equation(8)with the nonlinear conjugate gradient algorithm of Rasmussen
(2006). Again, we use a Gaussian with the same covariance structure as the data as noise distribution
pn.
2 2.5 3 3.5 4 4.5 −3
−2.5 −2 −1.5 −1 −0.5 0 0.5 1
log10 sample size T
d
log10 squared error
sim, NCE0.1 sim, NCE1 sim, NCE100 sim, MLE pred, NCE0.1 pred, NCE1 pred, NCE100 pred, MLE
(a) Prediction of the MSE
−21 −1 0 1 2 3 4
1.5 2 2.5 3 3.5
log10 ratio ν
log10 asymptotic variance
NCE all parameters NCE, mix matrix contribution MLE
(b) Asymptotic behavior
1 1.005 1.01 1.015
−2 −1 0 1 2 3 4
log10 ratio ν
Ratio of asymptotic variance
(c) Normalized vs unnormalized model
−21 −1 0 1 2 3 4
1.5 2 2.5 3 3.5
log10 ratio ν
log10 asymptotic variance
NCE, mix matrix contribution NCE pn=pd, mix matrix contribution MLE
(d) Effect of the noise distribution
Figure 4: Validation of the theory of noise-contrastive estimation: Estimation error for large sample sizes. Figure (a) shows that Corollary 4 correctly predicts the MSE for large samples sizes
Td. Figure (b) shows the asymptotic variancetrΣas a function ofν. Figure (c) shows
a boxplot of the ratio between the asymptotic variance when the model is unnormalized and the asymptotic variance when the model is normalized. Figure (d) compares noise-contrastive estimation with Gaussian noise to the hypothetical case wherepnequals the
data distribution pd. As in Figure 3, the curves in all figures but in Figure (c) are the
median of the results for 500 random mixing matrices. The boxplot in Figure (c) shows the distribution for all the 500 matrices.
3.3.1 RESULTS
Figure 5(a) shows the asymptotic variancetrΣB related to the mixing matrix as a function of the
dimensionn. Noise-contrastive estimation (NCE) withν=Tn/Td=1 is shown in red with asterisks
1.5 2 2.5 3 3.5 4 4.5 5
10 20 30 40 50 60 70 80
Dimension
10 20 30 40 50 60 70 80
Log10 asymptotic variance (pred and sim)
2.5 5 7.5 10 12.5 15 17.5 20
Ratio of asymptotic variances
NCE, ν=1
MLE
(a) NCE and MLE in higher dimensions
0 0.5 1 1.5 2 2.5 3
1 2 4 6 8 10 12 14
ν per dimension
Ratio of mean squared errors, NCE to MLE
Theory, dim=10 Theory, dim=20 Theory, dim=30 Theory, dim=40 Theory, dim=50 Theory, dim=60 Theory, dim=70 Theory, dim=80 Sim, dim 10−70, ν=1 Sim, dim=60, ν=30 Sim, dim=80, ν=40
(b) Relative estimation error and amount of noise per dimen-sion
Figure 5: Investigating how noise-contrastive estimation (NCE) scales with the dimension of the data. Figure (a) shows the logarithm of the asymptotic variance for NCE (ν=Tn/Td= 1,
in red) and MLE (in black). The boxplots show simulation results; the asterisks and triangles theoretical predictions for NCE and MLE, respectively. The same figure shows the ratio of the two asymptotic variances (blue circles, right scale). Figure (b) plots the ratio of the mean squared errors of the two estimators as a function ofνper dimensionn. The value ofνneeds to be increased as the dimensions increases; a linear increase leads to acceptable results.
random mixing matrices withTd= 80000. The simulation results match the predictions well, which
validates the theory of noise-contrastive estimation in large dimensions.
Since the number of parameters increases with largern, it is natural thattrΣB increases with n. However, for noise-contrastive estimation, the increase is larger than for MLE. This is more clearly visible by considering the blue curve in Figure 5(a) (circles as markers, scale on the right axis). The curve shows the ratio between the asymptotic variance for noise-contrastive estimation and for MLE. By definition of the asymptotic variance, this ratio is equal to the ratio of the two estimation errors obtained with the two different methods. The ratio does not depend on the number of parameters and the sample size Td. It is hence a suitable performance indicator to investigate
how noise-contrastive estimation scales with the dimensionnof the data. The plot shows that for fixedν, the performance deteriorates as the dimension increases. In order to counteract this decline in performance, the parameterνneeds to be increased as the dimension increases.
4. Investigating the Trade-Off between Statistical and Computational Performance
We have seen that for large ratiosν of noise sample sizeTnto data sample sizeTd, the estimation
error for noise-contrastive estimation behaves like the error in MLE. For largeν, however, the com-putational load becomes also heavier because more noise samples need to be processed. There is thus a trade-off between statistical and computational performance. Such a trade-off exists also in other estimation methods for unnormalized models. In this section, we investigate the trade-off in noise-contrastive estimation, and compare it to the trade-off in Monte Carlo maximum likelihood estimation (Geyer, 1994), contrastive divergence (Hinton, 2002) and persistent contrastive diver-gence5(Younes, 1989; Tieleman, 2008), as well as score matching (Hyv¨arinen, 2005).
In Section 4.1, we comment on the data which we use in the comparison. In Section 4.2, we review the different estimation methods with focus on the trade-off between statistical and computa-tional performance. In Section 4.3, we point out the limitations of our comparison before presenting the simulation results in Section 4.4.
4.1 Data Used in the Comparison
For the comparison, we use artificial data which follows the ICA model in Equation(14)with the data log-pdflnpdbeing given by Equation(15). We set the dimensionnto ten and useTd= 8000
observations to estimate the parameters. In a first comparison, we assume Laplacian sources in the ICA model. The log-pdflnpd is then specified with Equation(16). Note that this log-pdf has a
sharp peak around zero where it is not continuously differentiable. In a second comparison, we use sources that follow the smoother logistic density. The nonlinearityf and the log normalizing constantc∗in Equation(15)are in that case
f(u) =−2 ln cosh
π
2√3u
, c∗= ln|detB⋆|+nln
π
4√3
,
respectively. We are thus making the comparison for a relatively nonsmooth and smooth den-sity. Both comparisons are based on 100 randomly chosen mixing matrices with condition number smaller than 10.
4.2 Estimation Methods Used in the Comparison
We introduce here briefly the different methods and comment on our implementation and choices of parameters.
4.2.1 NOISE-CONTRASTIVE ESTIMATION
To estimate the parameters, we maximizeJT in Equation(8). We use here a Gaussian noise density pnwith a covariance matrix equal to the sample covariance of the data. As before,JT is maximized using the nonlinear conjugate gradient method of Rasmussen (2006). To map out the trade-off between statistical and computational performance, we measured the estimation error and the time needed to optimizeJT forν∈ {1,2,5,10,20,50,100,200,400,1000}.
4.2.2 MONTECARLOMAXIMUMLIKELIHOODESTIMATION
For normalized models, an estimate for the parametersα can be obtained by choosing them such that the probability of the observed data is maximized. This is done by maximization of
JMLE(α) = 1
Td Td X
t=1
lnp0m(xt;α)−lnZ(α). (18)
If no analytical expression for the partition functionZ(α)is available, importance sampling can be used to numerically approximateZ(α)via its definition in Equation(2), that is
Z(α)≈ 1
Tn Tn X
t=1
p0
m(nt;α) pIS(nt)
.
Thentare independent observations of “noise” with distributionpIS. Note that more sophisticated
ways exist to numerically calculate the value ofZat a givenα(see for example Robert and Casella, 2004, in particular Chapter 3 and Chapter 4). The simple approach above leads to the objective functionJIS(α)known as Monte Carlo maximum likelihood (Geyer, 1994),
JIS(α) = 1
Td Td X
t=1
lnp0m(xt;α)−ln 1
Tn Tn X
t=1
p0
m(nt;α) pIS(nt)
! .
We maximizedJIS(α)with the nonlinear conjugate gradient algorithm of Rasmussen (2006). Like in noise-contrastive estimation, there is a trade-off between statistical performance and running time: The largerTn gets the better the approximation of the log-likelihood. Hence, the
estimates become more accurate but the optimization ofJIStakes also more time. To map out the trade-off curve, we used the same values ofTn=νTd as in noise-contrastive estimation, and also
the same noise distribution, that ispIS=pn.
4.2.3 CONTRASTIVEDIVERGENCE
IfJMLEis maximized with a steepest ascent algorithm, the update rule forαis
αk+1=αk+µk∇αJMLE(α)|αk, (19)
whereµkis the step-size. For the calculation of∇αJMLE, the gradient of the log partition function lnZ(α)is needed, see Equation(18). Above, importance sampling was used to evaluatelnZ(α) and its gradient∇αlnZ(α). The gradient of the log partition function can, however, also be ex-pressed as
∇αlnZ(α) =∇α
Z(α)
Z(α) =
Z p0 m(n;α)
Z(α) ∇αlnp
0
m(n;α)dn. (20)
If we had data nt at hand which follows the normalized model density p0m(.;α)/Z(α), the last
equation could be evaluated by taking the sample average. The parameter vector α could then be learned based on Equation(19). In general, sampling from the model density is, however, only possible by means of Markov chain Monte Carlo methods. In contrastive divergence (Hinton, 2002), to computeαk+1, Markov chains are started at the data pointsxtand stopped after a few Monte
Carlo steps before they actually reach the stationary distributionp0
ntthat are created in that way follow thus only approximatelyp0m(.;αk)/Z(αk). For every update
ofαthe Markov chains are restarted from thext. Note that this update rule for αis not directly
optimizing a known objective function.
In our implementation, we used Hamiltonian Monte Carlo (see for example Neal, 2010) with a rejection ratio of 10% for the sampling (like in Teh et al., 2004; Ranzato and Hinton, 2010). There are then four tuning parameters for contrastive divergence: The number of Monte Carlo steps, the number of “leapfrog” steps in Hamiltonian Monte Carlo, the choice of the step sizesµk, as well as the number of data pointsxtand noise pointsntused in each update step ofα. The choice of the
tuning parameters will affect the estimation error and the computation time. For our comparison here, we used contrastive divergence with one and three Monte Carlo steps (denoted by CD1 and CD3 in the figures below), together with either three or twenty leapfrog steps. Ranzato and Hinton (2010) used CD1 with twenty leapfrog steps (below denoted by CD1 20), while Teh et al. (2004) used CD1 30 to estimate unnormalized models from natural image data. For theµk, we considered
constant step sizes, as well as linearly and exponentially decaying step sizes.6 For each update step, we chose an equal number of data and noise points. We considered the case of using all data in each update step, and the case of using minibatches of only 100 randomly chosen data points.
We selected the step size µk and the number of data points used in each update by means of
preliminary simulations on five data sets. We limited ourselves to contrastive divergence with one Monte Carlo and three leapfrog steps (CD1 3). For both Laplacian and logistic sources, using mini-batches with an exponential decaying step size gave the best results. The results are reported below in Section 4.4. The use of minibatches led to faster estimation results without affecting their accu-racy. Exponentially decaying step sizes are advocated by the theory of stochastic approximation; in some cases, however, linear decay was found to be more appropriate (Tieleman, 2008, Section 4.5). For Laplacian sources, the initial step size µ0 was 0.005; for logistic sources, it was µ0 = 0.01.
Note that in this selection of the tuning parameters, we used the true parameters to compute the estimation error. Clearly, this cannot be done in real applications since the true parameter values are not known. The choice of the tuning parameters must then solely be based on experience, as well as trial and error.
4.2.4 PERSISTENTCONTRASTIVE DIVERGENCE
As contrastive divergence, persistent contrastive divergence (Younes, 1989; Tieleman, 2008) uses the update rule in Equation(19)together with an approximative evaluation of the integral in Equa-tion(20)to learn the parametersα. The integral is also computed based on Markov chain Monte Carlo sampling. Unlike contrastive divergence, however, the Markov chains are not restarted at the data points xt. For the computation of αk+1, the Markov chains are initialized with the
samplesnt that were obtained in the previous iteration by running Markov chains converging to p0
m(.;αk−1)/Z(αk−1). As in contrastive divergence, the Markov chains are only run for a short
time and stopped before having actually converged.
Since persistent contrastive divergence differs from contrastive divergence only by the initial-ization of the Markov chains, it has the same tuning parameters. As in contrastive divergence, we used preliminary simulations to select suitable parameters: again, exponentially decaying step sizes
µktogether with minibatches of size 100 gave the best performance. The preliminary simulations
yielded also the same initial step sizes µ0 as in contrastive divergence. It turned out, however,
that the number of leapfrog steps in persistent contrastive divergence needs to be larger than in contrastive divergence: using, for example, only three leapfrog steps as in contrastive divergence resulted in a poor performance in terms of estimation accuracy. For the results reported below in Section 4.4, we used 20 and 40 leapfrog steps, together with one and three Monte Carlo steps.
4.2.5 SCORE MATCHING
In score matching (Hyv¨arinen, 2005), the parameter vectorα is estimated by minimization of the cost functionJSM,
JSM(α) =
1
Td Td X
t=1
n X
i=1
1 2Ψ
2
i(xt;α) + Ψ′i(xt;α).
The termΨi(x;α)is the derivative of the unnormalized model with respect tox(i), thei-th element
of the vectorx,
Ψi(x;α) =∂lnp
0
m(x;α) ∂x(i) . The termΨ′
i(x;α) denotes the derivative of Ψi(x;α)with respect to x(i). The presence of this
derivative may make the objective function and its gradient algebraically rather complicated if a sophisticated model is estimated. For the ICA model with Laplacian sources,Ψi(x;α)equals
Ψi(x;α) = n X
j=1
−√2sign(bjx)Bji (21)
which is not smooth enough to be used in score matching. Using the smooth approximation sign(u)≈tanh(10u) is a way to obtain a smooth enoughΨi(x;α) andΨ′i(x;α). The
optimiza-tion ofJSMis done by the nonlinear conjugate gradient algorithm of Rasmussen (2006). Note that, unlike the estimation methods considered above, score matching does not have a tuning parameter which controls the trade-off between statistical and computational performance. Moreover, score matching does not rely on sampling.
4.3 Limitations of the Comparison
For all considered methods but contrastive and persistent contrastive divergence, the algorithm which is used to optimize the given objectives can be rather freely chosen. This choice will influence the trade-off between statistical and computational performance. Here, we use the optimization al-gorithm by Rasmussen (2006). Our results below show thus the trade-off of the different estimation methods in combination with this particular optimization algorithm. With this optimization algo-rithm, we used for each update all data. The algorithm is not suitable for stochastic optimization with minibatches (see for example Schraudolph and Graepel, 2002). Optimization based on mini-batches may well lead not only for (persistent) contrastive divergence to gains in speed but also for the other estimation methods, including noise-contrastive estimation.
Finally, the reader may want to keep in mind that for other kinds of data, in particular also in very high dimensions, differences may occur.
4.4 Results
We first compare noise-contrastive estimation with the methods for which we use the same opti-mization algorithm, that is Monte Carlo maximum likelihood estimation and score matching. Then, we compare it with contrastive and persistent contrastive divergence.
4.4.1 COMPARISON WITHMONTECARLOMLEANDSCOREMATCHING
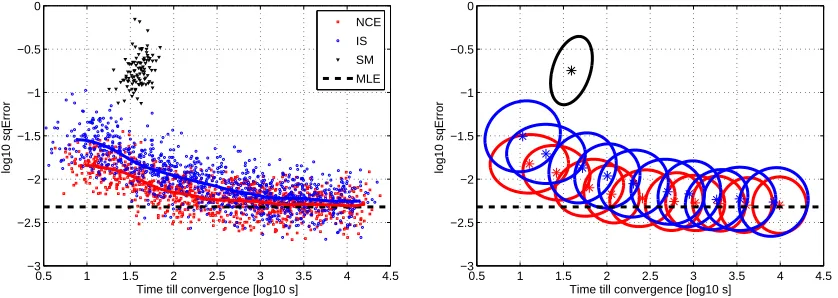
Figure 6 shows the comparison of noise-contrastive estimation (NCE, red squares), Monte Carlo maximum likelihood (IS, blue circles) and score matching (SM, black triangles). The left panels show the simulation results in form of “result points” where the x-coordinate represents the time till the algorithm converged and the y-coordinate the estimation error at convergence. Convergence in the employed nonlinear conjugate gradient algorithm by Rasmussen (2006) means that the line search procedure failed twice in a row to meet the strong Wolfe-Powell conditions (see for example Sun and Yuan, 2006, Chapter 2.5.2). For score matching, 100 result points corresponding to 100 different random mixing matrices are shown in each figure. For noise-contrastive estimation and Monte Carlo maximum likelihood, we used ten different values of ν so that for these methods, each figure shows 1000 result points. The panels on the right present the simulation result in a more schematic way. For noise-contrastive estimation and Monte Carlo maximum likelihood, the different ellipses represent the outcomes for different values of ν. Each ellipse contains 90% of the result points. We can see that increasingνreduces the estimation error but it also increases the running time. For score matching, there is no such trade-off.
Figure 6(a) shows that for Laplacian sources, noise-contrastive estimation outperforms the other methods in terms of the trade-off between statistical and computational performance. The large estimation error of score matching is likely to be due to the smooth approximation of the sign function in Equation(21). The figure also shows that noise-contrastive estimation handles noise that has lighter tails than the data more gracefully than Monte Carlo maximum likelihood estimation. The reason is that the nonlinearityh(u;θ)in the objective function in Equation(8)is bounded even if data and noise distribution do not match well (see also Pihlaja et al., 2010).
For logistic sources, shown in Figure 6(b), noise-contrastive estimation and Monte Carlo max-imum likelihood perform equally. Score matching reaches its level of accuracy about 20 times faster than the other methods. Noise-contrastive estimation and Monte Carlo maximum likelihood can, however, have a higher estimation accuracy than score matching ifν is large enough. Score matching can thus be considered to have a built-in trade-off between estimation performance and computation time: Computations are fast but the speed comes at the cost of not being able to reach an estimation accuracy as high as, for instance, noise-contrastive estimation.
4.4.2 COMPARISON WITHCONTRASTIVE ANDPERSISTENTCONTRASTIVEDIVERGENCE
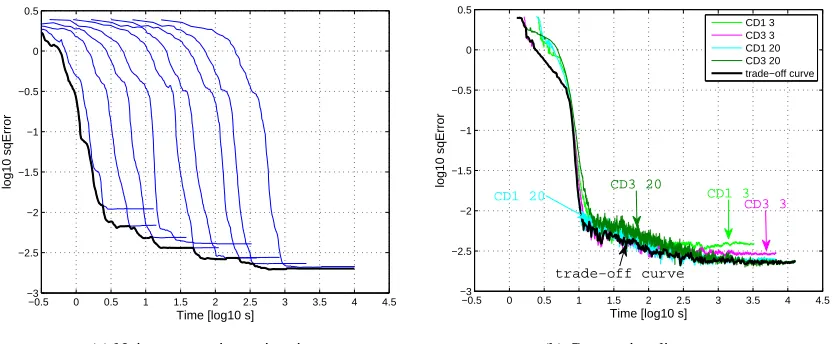
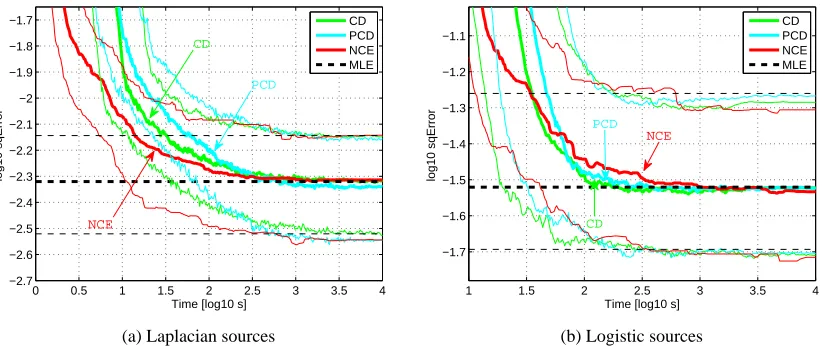
We base our comparison on the estimation error as a function of the running time of the algo-rithm. This makes the comparison independent from the stopping criterion that is used in noise-contrastive estimation. For noise-noise-contrastive estimation, the parameterν controls the trade-off be-tween computational and statistical performance; for contrastive and persistent contrastive diver-gence, it is the number of leapfrog steps and the number of Markov steps taken in each update. We compiled a trade-off curve for each of the one hundred estimation problems by taking at any time point the minimum estimation error over the various estimation errors that are obtained for different values of the trade-off parameters.7 Figure 7 shows an example for noise-contrastive estimation and contrastive divergence. The distribution of the trade-off curves is shown in Figure 8. For large running times, the distribution of the estimation error is for all estimation methods similar to the one for maximum likelihood estimation. For shorter running times, noise-contrastive estimation is seen to have for Laplacian sources a better trade-off than the other methods. For logistic sources, however, the situation is reversed.
4.4.3 SUMMARY
The foregoing simulation results and discussion suggest that all estimation methods trade, in one form or the other, estimation accuracy against computation speed. In terms of this trade-off, noise-contrastive estimation is particularly well suited for the estimation of data distributions with heavy tails. In case of thin tails, noise-contrastive estimation performs similarly to Monte Carlo maximum likelihood, and contrastive or persistent contrastive divergence has a better trade-off. If the data distribution is particularly smooth and the model algebraically not too complicated, score matching may, depending on the required estimation accuracy, be the best option.
5. Simulations with Natural Images
In this section, we estimate with our new estimation method models of natural images. In the theory of noise-contrastive estimation, we have assumed that all variables can be observed. Noise-contrastive estimation can thus not be used for models with latent variables which cannot be inte-grated out analytically. Such models occur for example in the work by Olshausen and Field (1996), Hyv¨arinen et al. (2001a), Karklin and Lewicki (2005), L¨ucke and Sahani (2008) and Osindero and Hinton (2008). We are here considering models which avoid latent variables. Recent models which are related to the models that we are considering here can be found in the work by Osindero et al. (2006), K¨oster and Hyv¨arinen (2010) and Ranzato and Hinton (2010). For a comprehensive intro-duction to natural image statistics, see for example the textbook by Hyv¨arinen et al. (2009).
The presented models will consist of two processing layers, like in a multilayer neural network. The output of the network for a given input image gives the value of the model-pdf at that image. Because of the two processing layers, we call the models “two-layer models”.
We start with giving some preliminaries in Section 5.1. In Section 5.2, we present the settings of noise-contrastive estimation. In Section 5.3, we properly define the two-layer model and estimate a version with more than 50000 parameters. In Section 5.4, we present an extension of the model where the learned output nonlinearity of the network belongs to the flexible family of splines. The different models are compared in Section 5.5.
0.5 1 1.5 2 2.5 3 3.5 4 4.5 −3
−2.5 −2 −1.5 −1 −0.5 0
Time till convergence [log10 s]
log10 sqError
NCE IS SM MLE
0.5 1 1.5 2 2.5 3 3.5 4 4.5
−3 −2.5 −2 −1.5 −1 −0.5 0
Time till convergence [log10 s]
log10 sqError
(a) Sources following a Laplacian density
0.5 1 1.5 2 2.5 3 3.5 4
−2.5 −2 −1.5 −1 −0.5 0 0.5
Time till convergence [log10 s]
log10 sqError
NCE IS SM MLE
0.5 1 1.5 2 2.5 3 3.5 4
−2.5 −2 −1.5 −1 −0.5 0 0.5
Time till convergence [log10 s]
log10 sqError
(b) Sources following a logistic density
Figure 6: Trade-off between statistical and computational performance for noise-contrastive es-timation (NCE, red squares), Monte Carlo maximum likelihood (IS, blue circles) and score matching (SM, black triangles). Each point represents the result of one simula-tion. Performing local linear kernel smoothing regression on the result points yields the thick curves. For noise-contrastive estimation and Monte Carlo maximum like-lihood, the ten ellipses represent the outcomes for the ten different values of ν ∈ {1,2,5,10,20,50,100,200,400,1000}. The ellipses were obtained by fitting a Gaussian to the distribution of the result points, each one contains 90% of the results points for a givenν. The asterisks mark their center. For an ICA model with Laplacian sources, NCE has the best trade-off between statistical and computational performance. For lo-gistic sources, NCE and IS perform equally well. For medium estimation accuracy, score matching outperforms the other two estimation methods.
5.1 Data, Preprocessing and Modeling Goal
−0.5 0 0.5 1 1.5 2 2.5 3 3.5 4 4.5 −3
−2.5 −2 −1.5 −1 −0.5 0 0.5
Time [log10 s]
log10 sqError
(a) Noise-contrastive estimation
−0.5 0 0.5 1 1.5 2 2.5 3 3.5 4 4.5
−3 −2.5 −2 −1.5 −1 −0.5 0 0.5
Time [log10 s]
log10 sqError
CD1 3 CD3 3 CD1 20 CD3 20 trade−off curve
CD1 3
CD3 3
CD3 20
trade−off curve
CD1 20
(b) Contrastive divergence
Figure 7: Example of a trade-off curve for noise-contrastive estimation and contrastive divergence. (a) The different curves in blue show the estimation error which is obtained for the various values ofν. The thicker curve in black shows the trade-off curve. It is is obtained by taking at any time point the minimum estimation error. (b) The trade-off curve, shown in black, is similarly obtained by taking the minimum over the estimation errors which are obtained with different settings of contrastive divergence.
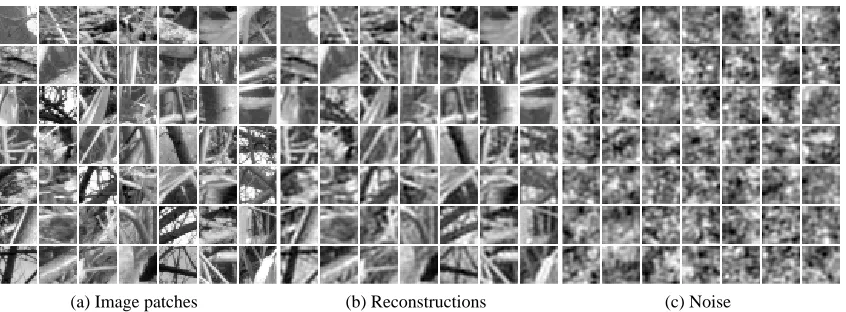
As preprocessing, we removed from each image patch its average value (local mean, DC com-ponent), whitened the data and reduced the dimension from d= 25·25 = 625 to n= 160. This retains93%of the variance of the image patches. After dimension reduction, we additionally cen-tered each data point and rescaled it to unit variance. In order to avoid division by small numbers, we avoided taking small variance patches. This gave our dataX= (x1, . . . ,xTd). Because of the
centering and rescaling, each data pointxtsatisfies n
X
k=1
xt(k) = 0,
1
n−1
n X
k=1
xt(k)2= 1. (22)
This means that each data point lies on the surface of an−1dimensional sphereS.
This kind of preprocessing is a form of luminance and contrast gain control which aim at can-celing out the effects of the lighting conditions (see for example Hyv¨arinen et al., 2009, Chapter 9, where also the statistical effects of such a preprocessing are analyzed). Centering and rescaling to unit variance has also been used in image quality assessment in order to access the structural com-ponent of an image, which is related to the reflectance of the depicted objects (Wang et al., 2004, in particular Section III.B). By modeling the dataX, we are thus modeling the structure in the image patches.
Given a data pointxt, we can reconstruct the original (vectorized) image patch via
it=V−xt, V−=ED1/2, (23)