_____________________________________________________________________________________________________ *Corresponding author: E-mail: [email protected];
31(6): 1-8, 2019; Article no.JPRI.52943
ISSN: 2456-9119
(Past name: British Journal of Pharmaceutical Research, PastISSN: 2231-2919, NLM ID: 101631759)
Extraction Procedure Optimization of Atenolol from
Dried Plasma Spots
A. A. Chernonosov
1*and V. V. Koval
1,21
Institute of Chemical Biology and Fundamental Medicine SB RAS, Lavrentiev Ave. 8, Novosibirsk, 630090, Russia.
2Novosibirsk State University, Pirogova Str. 2, Novosibirsk, 630090, Russia.
Authors’ contributions
This work was carried out in collaboration between both authors. Author VVK designed the study, wrote the protocol and managed the literature searches. Author AAC managed analyses, performed the statistical analysis and wrote the first draft of the manuscript. Both authors read and approved the final manuscript.
Article Information
DOI: 10.9734/JPRI/2019/v31i630330 Editor(s): (1) Rahul S. Khupse, Assistant Professor, Pharmaceutical Sciences, University of Findlay, USA. Reviewers: (1) Manohar V. Lokhande, Sathaye College and Mumbai University, India. (2)Camilo Torres-Serna, Universidad Santiago de Cali, Colombia. (3)Jacilene Silva, Federal University of Ceará State, Brazil. (4)Muhammad Asif Khan, Sarhad University, Pakistan. Complete Peer review History:http://www.sdiarticle4.com/review-history/52943
Received 05 November 2019 Accepted 29 November 2019 Published 30 November 2019
ABSTRACT
Aims: Atenolol is one of the β-blockers widely used for the treatment of hypertension and other cardiovascular diseases. To simplify the methods for determining of drugs concentrations in blood and plasma the dried spots assays (dried blood spots or dried plasma spots) could be used. In this case high sensitive detector like mass-spectrometer is required as well as high level of drug recovery from dried spot. In this study the extraction of atenolol from dried plasma spots (DPS) was studied to offer the optimum parameters of extraction method.
Study Design: Short research articles.
Place and Duration of Study: Core Facility of Mass Spectrometric Analysis, Institute of Chemical Biology and Fundamental Medicine SB RAS, between January and October 2019.
Methodology: The organic extraction method was chosen for evaluation as the most suitable for LC-MS assay. Several parameters: % of organic solvent, presence or absence of 0.1% formic acid,
time, volume and temperature of extraction were investigated to find the best combination for atenolol recovery from DPS for further LC
Results: Results showed that the solvent composition and temperature has main influence on the extraction. The effect of extraction time and volume of solvent have no significant influence on atenolol recovery. Pure acetonitrile is the worst solvent for atenolol extraction from DPS. The solvents: MeOH:H2O (60:40, v:v), MeOH:0.1% FA in H
v:v) or ACN:MeOH (60:40, v:v) provide the best recovery of atenolol temperature is 40°C, time of extraction is 15
Conclusion: Several solvents acceptable for LC from DPS can be used for routine extraction of atenolol.
Keywords: Dried plasma spot; DPS;
1. INTRODUCTION
Cardiovascular diseases are the leading cause of mortality in the world [1]. The main attributable risk factor of death is hypertension. The hypertension is also responsible for 50% of the cases of ischemic and cerebrovascular heart diseases [2,3]. For hypertension treatment various classes of antihypertensive drugs have been developed: diuretics, calcium channel blockers, blockers, blockers, etc.
example, atenolol was among the 200 most prescribed drugs in the United States in 2003 with 4th rank.
Atenolol is a representative of blockers The chemical structure of atenolol, [4
3-isopropylaminopropoxy) phenyl acetamide], is presented at Fig.1. It is used for the treatment of cardiovascular disease including hypertension, angina pectoris and arrhythmia [4].
Fig. 1. Chemical structure of atenolol
The use of dried blood spots (DBSs) can simplify the methods for determining the concentrations of drugs [2]. The DBS sampling technique is suitable even for small children [5]
for routine clinical testing [4]. DBS helps with recruitment of subjects for preclinical or clinical studies [6] due to simpler storage and easier transfer by mail to the assigned analytical laboratory [2].
temperature of extraction were investigated to find the best combination for atenolol recovery from DPS for further LC-MS analysis.
Results showed that the solvent composition and temperature has main influence on the raction time and volume of solvent have no significant influence on atenolol recovery. Pure acetonitrile is the worst solvent for atenolol extraction from DPS. The
O (60:40, v:v), MeOH:0.1% FA in H2O (60:40, v:v), ACN:0.1% FA in H
v:v) or ACN:MeOH (60:40, v:v) provide the best recovery of atenolol. The optimum extraction C, time of extraction is 15-30 min and volume of solvent - 200-300
Several solvents acceptable for LC-MS analysis with optimized recovery parameter from DPS can be used for routine extraction of atenolol.
; DBS; atenolol; LC-MS/MS; extraction.
Cardiovascular diseases are the leading cause of . The main attributable risk factor of death is hypertension. The hypertension is also responsible for 50% of the cases of ischemic and cerebrovascular heart . For hypertension treatment ertensive drugs have been developed: diuretics, calcium channel blockers, etc. [2]. For example, atenolol was among the 200 most prescribed drugs in the United States in 2003
blockers class. The chemical structure of atenolol,
[4-(2-hydroxy-isopropylaminopropoxy) phenyl acetamide], is presented at Fig.1. It is used for the treatment of cardiovascular disease including hypertension,
Fig. 1. Chemical structure of atenolol
The use of dried blood spots (DBSs) can simplify the methods for determining the concentrations . The DBS sampling technique is [5] and is ideal . DBS helps with recruitment of subjects for preclinical or clinical due to simpler storage and easier transfer by mail to the assigned analytical
The DBS technique minimized the risk infection with of infectious pathogens, including HIV [7]. In addition, DBS offer an easier transfer and simpler storage with minimum unnecessary costs [8,9]. The above advantages, coupled with the possibilities of mass spectrometry, allow the use of this methodology for various applications, including preclinical or clinical pharmacokinetic studies [6,10-13] and therapeutic drug monitoring [14,15].
The hematocrit is one of the reasons why incorrect values of drug concentration could be obtained using DBS. Using the DPS can solve this problem. In several works the DBS assay was used for atenolol determination
are no studies for atenolol quantification in DPS. Moreover only in one recent research authors discuss the atenolol extraction from DBS The aim of this study was to find the optimized parameters of atenolol extraction from DPS.
2. MATERIALS AND METHOD
2.1 Reagents
Atenolol, formic acid (FA) and Whatman 903 Protein Saver Card were purchased from Sigma Aldrich (St. Louis, MO, USA). Acet
methanol of LC-MS grade were purchased from Panreac AppliChem (Barcelona, Spain). Water was purified by means of a Milli-Q system from Millipore Corp. (Bedford, USA). Nitrogen gas (ultrapure, >99.9%) was produced by an Agilent 5183-2003 nitrogen generator (Agilent Technologies, USA).
2.2 Equipment and HPLC
Conditions
Mass spectrometry analysis was carried out in the Core Facility of Mass Spectrometric Analysis (ICBFM SB RAS). Chromatographic separation temperature of extraction were investigated to find the best combination for
Results showed that the solvent composition and temperature has main influence on the raction time and volume of solvent have no significant influence on atenolol recovery. Pure acetonitrile is the worst solvent for atenolol extraction from DPS. The O (60:40, v:v), ACN:0.1% FA in H2O (50:50,
. The optimum extraction L.
ed recovery parameter
The DBS technique minimized the risk of infectious pathogens, including . In addition, DBS offer an easier transfer and simpler storage with minimum unnecessary . The above advantages, coupled with the possibilities of mass spectrometry, allow the use of this methodology for various applications, uding preclinical or clinical pharmacokinetic and therapeutic drug monitoring
The hematocrit is one of the reasons why ncentration could be obtained using DBS. Using the DPS can solve this problem. In several works the DBS assay was used for atenolol determination [2], but there are no studies for atenolol quantification in DPS. Moreover only in one recent research authors discuss the atenolol extraction from DBS [16]. The aim of this study was to find the optimized parameters of atenolol extraction from DPS.
HODS
Atenolol, formic acid (FA) and Whatman 903 Protein Saver Card were purchased from Sigma-Aldrich (St. Louis, MO, USA). Acetonitrile and
MS grade were purchased from Panreac AppliChem (Barcelona, Spain). Water Q system from Millipore Corp. (Bedford, USA). Nitrogen gas (ultrapure, >99.9%) was produced by an Agilent en generator (Agilent
ment and HPLC-MS/MS
Chernonosov and Koval; JPRI, 31(6): 1-8, 2019; Article no.JPRI.52943
of the samples was achieved using a Agilent 1200 HPLC (Agilent Technologies, USA) equipped with Zorbax Eclipse XBD-C18 guard column (4.6 × 12.5 mm, 5 m) followed immediately by EcoNova ProntoSil-120-3-C18 (2 × 75 mm, 3 m) analytical column (EcoNova, Russia). The column oven temperature was set to 30°C. Sample injection volume was 10 µl. The flow rate was 0.4 mL/min and the gradient was composed of water containing 0.1% (v/v) formic acid (eluent A) and acetonitrile containing 0.1% (v/v) formic acid (eluent B). The mobile phase was initiated at 50% B and increasing to 90% B by 3.0 min, returning to 50% B by 0.1 min and held until 5.0 for washing. The total run time was 5 min. The autosampler temperature was held at 4°C.
MS/MS detection was performed on an Agilent 6410 QQQ mass spectrometer (Agilent Technologies, USA). Analytes were detected in positive ionization mode using multiple reaction monitoring. The capillary voltage was set to 4000V, and the gas temperature was set to 300°C. The nebulizer gas pressure and flow were 30 psi and 8 L/min, respectively. Dwell time was set to 200 ms. The ion transitions for atenolol were m/z 267.2→145.1 (collision energy 25 V, fragmentor voltage 135 V) as a quantifier; m/z 267.2→190.1 (collision energy 15 V, fragmentor voltage 135 V) and m/z 267.2→225 (collision energy 7 V, fragmentor voltage 135 V) as qualifiers. Signal output was captured and processed with the MassHunter software v.3.0. All LC-MS measurements were performed in duplicate.
2.3 Preparation of Samples
Stock solution and working samples were prepared in same way as described in work [9]. Briefly, atenolol was dissolved in acetonitrile to prepare a 10 mg/mL stock solution. The atenolol stock solution was diluted with acetonitrile to prepare intermediate stock solution that was added to blank rat plasma to create working solution with atenolol concentration of 1,000 ng/mL. All stock and working solutions were freshly made on the day of the analysis and were stored at 4°C before use. The working samples with final plasma concentration of atenolol of 1,000 ng/mL (each consisting of 25 L of rat plasma) was placed on a Whatman 903 Protein
Saver Card (GE Healthcare, USA) to fill the circles on the card and was air dried
completely overnight. After that, 3.2 mm circles of DPS were cut out by means of a DBS
Puncher, and each circle was placed in a 1.5 mL Eppendorf tube.
2.4 Solvents Preparation
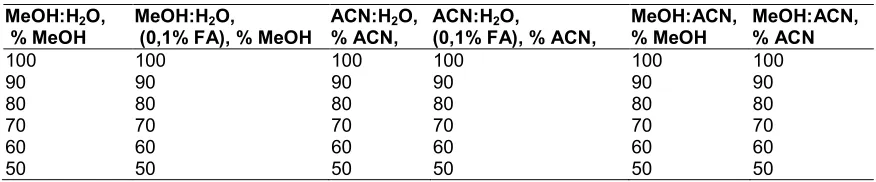
Five different types of solvents were prepared. The first one: MeOH:H2O mixture from 50% to
100% of MeOH (v:v) with 10% step. The second one: MeOH: 0,1% of FA in H2O mixture from
50% to 100% of MeOH (v:v) with 10% step. The third one: ACN:H2O mixture from 50% to 100%
of ACN (v:v) with 10% step. The fourth one: MeOH:0,1% of FA in H2O mixture from 50% to
100% of ACN (v:v) with 10% step. The last one: MeOH:ACN mixture from 0% to 100% of MeOH (v:v) with 10% step.
2.5 Extraction Procedure
The organic extraction method was used to optimize the extraction parameters. In general, organic solvent directly adds to DPS samples and then extraction is carried out under certain conditions. All experiments were conducted with three replicates.
2.5.1 Solvent selection
The 300 L of solvent was added to 3.2 mm circles of DPS placed in 1.5 mL Eppendorf tube. Samples were incubated on a shaker (TS-100C; BioSan, Latvia) at 900 rpm for 1 h at 30 °C. After centrifugation for 10 s at 1000 ×g, 250 L of the solution was transferred to a 300 L vial for further LC-MS analysis.
2.5.2 Extraction time selection
The extraction was carried out as for solvent selection but with different extraction time: 15 min, 30 min, 45 min, 60 min, 75 min and 90 min.
2.5.3 Extraction temperature selection
The extraction was carried out as for solvent selection but with different extraction temperature: 30°C, 40°C, 50°C, 60°C, 70°C and 80°C.
2.5.4 Solvent volume selection
1 h at 30°C. After centrifugation for 10 s at 1000×g, solutions were transferred to a new Eppendorf tubes. The solvent was evaporated to dryness using Labconco SpeedVac systems (Labconco, USA). Samples were reconstituted in 100 L of MeOH and transferred to a 300 L vial for further LC-MS analysis.
3. RESULTS AND DISCUSSION
Among three extraction methods (organic extraction, liquid-liquid extraction and protein precipitation) the organic extraction method is most suitable for extraction from DPS.
Protein precipitation or liquid-liquid extraction are a two-step extraction methods where in first step the blood or plasma spot extracted into the aqueous phase and then proteins from the DBSs precipitated by acetonitrile or target substance extracted in water-immiscible organic solvent, respectively. Organic extraction is a one-step extraction method that simply adds organic solvent directly to DPS samples [16]. In this case, proteins and red blood cells remain inside the stain, and the target substance is extracted into a solvent. Acetonitrile and methanol are most suitable solvents for using in further LC-MS analysis. Therefore for atenolol extraction from DBS researchers used 150 L, MeOH:H2O
(70:30, v/v) [17], 300 L, MeOH [18], 200 L, MeOH:H2O (60:40, v/v) [4], 500 L of
ACN:MeOH (1:2, v/v).
At the first stage of this study, the selection of the solvent providing the greatest recovery was carried out, since there is no data on extraction atenolol from a DPS, and researchers used different solvents with different volumes for extraction from a DBS. Different types of solvents consisting of a mixture of MeOH or ACN with water in the presence or absence of 0,1% of FA as well as different MeOH:ACN mixtures were prepared (Table 1).
To compare the effectivity of atenolol extraction by solvents, all these experiments were carried
out under the same conditions in triplicate. Each sample was analyzed twice by the LS-MS method. The results are shown in Fig. 2. Almost all solvent mixture showed approximately the same efficiency, excluding 100% ACN (Fig. 2b, 2d, 2f).
The adding 0,1% of FA to the solvent leads to a slight increase (by 15–20%) in the recovery of atenolol (Fig 2a,2b). For MeOH:H2O mixture a
tendency for a recovery decrease with an increase in % of MeOH was observed (Fig. 2a,2c).
No significant changes in the MeOH:ACN mixture from 100 to 50% of MeOH were detected (Fig 2e); the greatest efficiency was demonstrated at 60% of ACN with a subsequent decrease in atenolol recovery with a further increase % of ACN (Fig. 2f).
These data do not correlate quite with the work [16] where the ratio ACN:MeOH (1:2, v/v) was selected for atenolol extraction from DBS. From other hand, the difference in recovery is negligible: 1201 ± 40 (signal area) for 60% of ACN and 1112 ± 71 (signal area) for 40% of ACN.
Since solvents showed approximately the same extraction efficiency, excluding 100% ACN, 4 solvents were chosen to optimize other extraction parameters: MeOH:0,1% FA in H2O
(60:40, v/v), MeOH:H2O (60:40, v/v), ACN: 0,1%
FA in H2O (50:50, v/v) and MeOH:ACN (40:60,
v/v).
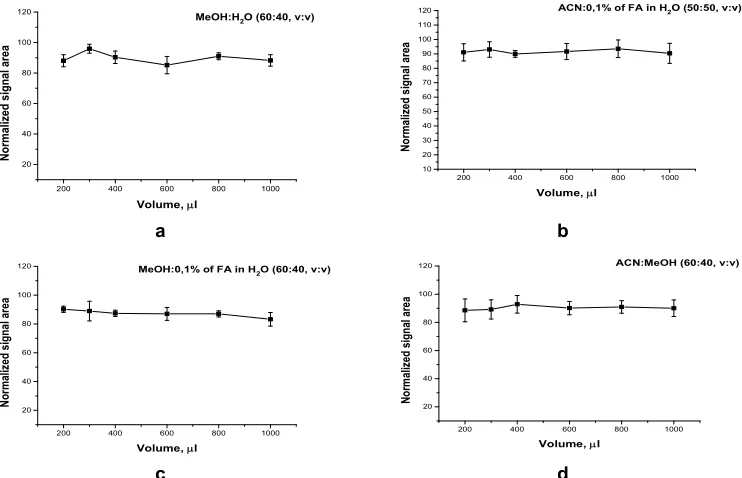
The next step was to determine the optimum extraction time. The extraction was carried out with different times from 15 min to 90 min with 15 min steps for each chosen solvent mixture (Fig. 3).
Significant differences in the efficiency of extraction of atenolol with increasing incubation time were not found (Fig 3), as well as with an increase in the volume of solvent (Fig. 4).
Table 1. Solvent composition
MeOH:H2O, % MeOH
MeOH:H2O,
(0,1% FA), % MeOH
ACN:H2O, % ACN,
ACN:H2O,
(0,1% FA), % ACN,
MeOH:ACN, % MeOH
MeOH:ACN, % ACN
100 100 100 100 100 100
90 90 90 90 90 90
80 80 80 80 80 80
70 70 70 70 70 70
60 60 60 60 60 60
Chernonosov and Koval; JPRI, 31(6): 1-8, 2019; Article no.JPRI.52943
50 60 70 80 90 100
200 400 600 800 1000 1200 1400 1600
MeOH:H2O (0,1 FA)
MeOH, %
Sig
na
l
ar
e
a
50 60 70 80 90 100
200 400 600 800 1000 1200 1400 1600
ACN:H2O (0,1 FA)
ACN, %
S
ign
al
ar
ea
a b
50 60 70 80 90 100
200 400 600 800 1000 1200 1400
1600 MeOH:H2O
MeOH, %
Sign
al
a
re
a
50 60 70 80 90 100
200 400 600 800 1000 1200 1400
1600 ACN:H2O
ACN, %
Sig
nal
area
c d
50 60 70 80 90 100
200 400 600 800 1000 1200 1400 1600
Signal
a
rea
MeOH, %
MeOH:ACN
50 60 70 80 90 100
200 400 600 800 1000 1200 1400 1600
ACN, %
ACN:MeOH
Signal
a
rea
e f
Fig. 2. Atenolol recovery from DPS at the concentration 1000 ng/ml by different solvents: MeOH: 0,1% of FA in H2O mixture (a), ACN: 0,1% of FA in H2O mixture (b), MeOH:H2O mixture
(c), ACN:H2O mixture (d), MeOH:ACN mixture (e and f)
10 20 30 40 50 60 70 80 90 100
20 40 60 80 100 120
Normalized sign
al
a
re
a
Time, min
MeOH:0,1% of FA in H2O (60:40, v:v)
10 20 30 40 50 60 70 80 90 100
20 40 60 80 100 120
ACN:0,1% of FA in H2O (50:50, v:v)
No
rm
alize
d
sig
nal area
a b
10 20 30 40 50 60 70 80 90 100 20
40 60 80 100 120
MeOH:H2O (60:40, v:v)
Time, min
Normaliz
ed s
ignal area
10 20 30 40 50 60 70 80 90 100 20
40 60 80 100 120
ACN:MeOH (60:40, v:v)
Time, min
Normaliz
ed s
ignal area
c d
Fig. 3. Normalized atenolol recovery from DPS at the concentration 1000 ng/ml at different extraction times: MeOH: 0,1% of FA in H2O mixture (a), ACN: 0,1% of FA in H2O mixture (b),
MeOH: H2O mixture (c), MeOH:ACN mixture (d)
200 400 600 800 1000
20 40 60 80 100 120
MeOH:H2O (60:40, v:v)
Normalized signal area
Volume, l
200 400 600 800 1000
10 20 30 40 50 60 70 80 90 100 110
120 ACN:0,1% of FA in H2O (50:50, v:v)
Volume, l
Normalized
s
ign
al
a
re
a
a b
200 400 600 800 1000
20 40 60 80 100
120 MeOH:0,1% of FA in H
2O (60:40, v:v)
Volume, l
N
o
rma
liz
ed
signa
l ar
ea
200 400 600 800 1000
20 40 60 80 100
120 ACN:MeOH (60:40, v:v)
Volume, l
N
orm
ali
zed sign
al
area
c d
Fig. 4. Normalized atenolol recovery from DPS with different solvent volume: MeOH:0,1% of FA in H2O mixture (a), ACN:0,1% of FA in H2O mixture (b), MeOH:H2O mixture (c), MeOH:ACN
mixture (d)
30 40 50 60 70 80
30 40 50 60 70 80 90
100 MeOH:0,1% of FA in H2O (60:40, v:v)
No
rma
lized signal area
Temperature, C
30 40 50 60 70 80
40 50 60 70 80 90 100
ACN:0,1% of FA in H2O (50:50, v:v)
No
rma
lized signal area
Temperature, C
Chernonosov and Koval; JPRI, 31(6): 1-8, 2019; Article no.JPRI.52943
30 40 50 60 70 80
40 50 60 70 80 90
MeOH:H2O (60:40, v:v)
Temperature, C
Nor
ma
lized s
ignal a
rea
30 40 50 60 70 80
40 50 60 70 80 90 100
ACN:MeOH (60:40, v:v)
Normalized signal area
Temperature, C
c d
Fig. 5. Normalized atenolol recovery from DPS at different temperature: MeOH:0,1% of FA in H2O mixture (a), ACN:0,1% of FA in H2O mixture (b), MeOH:H2O mixture (c), MeOH:ACN mixture
(d)
In this work, to compare different volumes of solvent, the samples were evaporated to dryness and reconstructed in the same volume. For a one-step extraction method without this procedure, an increase in solvent volume will lower the signal level. This in turn will adversely affect the lower detection limit of the substance. The volume 200-300 L will be enough for the extraction of atenolol from a 3 mm disk of DPS.
Temperature rise from 30°C to 40°C increased recovery by about 2 times. Whereas further temperature raises leads to the evaporation of solvents from closed tubes, to loss of solvent volume and as a results the increase of measurement error. It was most appreciable for the MeOH:ACN solvent, since such mixture has a high fluidity.
Therefore, extraction at high temperature cannot be carried out using the MeOH:ACN mixture as a solvent. As seen in Fig. 5, an extraction temperature of 40°C is sufficient for the effective extraction of atenolol from DPS. This is consistent with data from work [18] where the authors sonicated samples of DBS for 30 mins at 40°C.
4. CONCLUSION
In this study, extraction method was optimized for the determination of atenolol in DPS samples. The method was tested in terms of extraction dependence on temperature, time, as well as type and volume of solvent. It was shown that the optimal extraction parameters are temperature of 40°C, incubation time up to 30 minutes, 200-300 L of solvent. Subject to further LS-MS analysis, mixtures of MeOH with H2O or ACN can be used
as solvents. Pure ACN is not a suitable solvent for the extraction of atenolol. Add of 0,1% of FA to solvents mixtures slightly increase the
recovery of atenolol from DPS, but without reliable confirmation. For better optimization, it is necessary to carry out additional experiments with detailed parameterization in the range established in this work.
CONSENT AND ETHICAL APPROVAL
It is not applicable.
ACKNOWLEDGEMENTS
This work except for mass spectrometric analysis was supported by a Program of RAS “Basic research for biomedical technology” 2018–2020 (AAAA-A17-117112320053-6) and mass spectrometric analysis was supported by Russian State funded budget project of ICBFM SB RAS (АААА-А17-117020210025-5).
COMPETING INTERESTS
Authors have declared that no competing interests exist.
REFERENCES
1. World Health Organization, Cardiovascular Diseases (Cvds); 2017.
2. Chernonosov A. The Use of dried blood spots for the quantification of antihypertensive drugs. Int J Anal Chem. 2018;2018:3235072.
DOI: 10.1155/2018/3235072.
3. Campbell DJ, Mcgrady M, Prior DL, Coller JM, Boffa U, Shiel L, et al. Most individuals with treated blood pressures above target receive only one or two antihypertensive drug classes. Intern Med J. 2013;43:137– 43.
DOI: 10.1111/J.1445-5994.2012.02927.X 4. Lawson G, Cocks E, Tanna S. Quantitative
spot samples by Lc-Hrms: A potential method for assessing medication adherence. J Chromatogr B Analyt Technol Biomed Life Sci. 2012;897:72–9. DOI:10.1016/J.Jchromb.2012.04.013. 5. Pandya HC, Spooner N, Mulla H. Dried
Blood Spots, Pharmacokinetic Studies And Better Medicines For Children. Bioanalysis. 2011;3:779–86.
DOI:10.4155/Bio.11.19.
6. Li W, Tse FLS. Dried blood spot sampling in combination with LC-MS/MS for quantitative analysis of small molecules. Biomed Chromatogr. 2010;24:49–65. DOI:10.1002/Bmc.1367.
7. Parker SP, Cubitt WD. The use of the dried blood spot sample in epidemiological studies. J Clin Pathol. 1999;52:633– 9.
8. 8. La Marca G, Malvagia S, Filippi L, Luceri F, Moneti G, Guerrini R. A new rapid micromethod for the assay of phenobarbital from dried blood spots by Lc-tandem mass spectrometry. Epilepsia. 2009;50:2658–62.
DOI:10.1111/J.1528-1167.2009.02204.X. 9. Chernonosov A. Quantification of warfarin
in dried rat plasma spots by high-performance liquid chromatography with tandem mass spectrometry. Journal of Pharmaceutics. 2016;2016:1–6.
DOI:10.1155/2016/6053295.
10. Spooner N, Lad R, Barfield M. Dried blood spots as a sample collection technique for the determination of pharmacokinetics in clinical studies: Considerations for the validation of a quantitative bioanalytical method. Anal Chem. 2009;81:1557–63. DOI:10.1021/Ac8022839.
11. Patel P, Tanna S, Mulla H, Kairamkonda V, Pandya H, Lawson G. Dexamethasone quantification in dried blood spot samples using LC-MS: The potential for application to neonatal pharmacokinetic studies. J Chromatogr B Analyt Technol Biomed Life Sci. 2010;878:3277–82.
DOI:10.1016/J.Jchromb.2010.10.009.
12. Suyagh MF, Iheagwaram G, Kole PL, Millership J, Collier P, Halliday H, Mcelnay JC. Development and validation of a dried blood spot-HPLC assay for the determination of metronidazole in neonatal whole blood samples. Anal Bioanal Chem. 2010;397:687–93.
DOI:10.1007/S00216-010-3571-5.
13. Wong P, Pham R, Bruenner BA, James CA. Increasing Efficiency for dried blood spot analysis: Prospects For automation and simplified sample analysis. Bioanalysis. 2010;2:1787–9.
DOI:10.4155/Bio.10.157.
14. Van Der Heijden J, Beer Y De, Hoogtanders K, Christiaans M, Jong GJ De, Neef C, Stolk L. Therapeutic drug monitoring of everolimus using the dried blood spot method in combination with liquid chromatography-mass spectrometry. J Pharm Biomed Anal. 2009;50:664–70. DOI:10.1016/J.Jpba.2008.11.021.
15. Edelbroek PM, Van Der Heijden J, Stolk LML. Dried blood spot methods in therapeutic drug monitoring: Methods, assays, and pitfalls. Ther Drug Monit. 2009;31:327–36. DOI: 10.1097/FTD.0b013e31819e91ce
16. Kim HM, Park J-H, Long NP, Kim DD, Kwon SW. Simultaneous determination of cardiovascular drugs in dried blood spot by liquid chromatography-tandem mass spectrometry. Journal of Food and Drug Analysis. 2019;27:906–14.
DOI:10.1016/J.Jfda.2019.06.001.
17. Dennis Bernieh ST. LC-HRMS analysis of dried blood spot samples for assessing adherence to cardiovascular medications. J Bioanal Biomed; 2015.
DOI:10.4172/1948-593X.1000115.
18. Bernieh D, Lawson G, Tanna S. Quantitative LC-HRMS determination of selected cardiovascular drugs, in dried blood spots, as an indicator of adherence to medication. J Pharm Biomed Anal. 2017;142:232–43.
DOI:10.1016/J.Jpba.2017.04.045.'
© 2019 Chernonosov and Koval; This is an Open Access article distributed under the terms of the Creative Commons Attribution License (http://creativecommons.org/licenses/by/4.0), which permits unrestricted use, distribution, and reproduction in any medium, provided the original work is properly cited.
Peer-review history: