Published by the
Iranian Chemical Society
Anal. Bioanal. Chem. Res., Vol. 7, No. 1, 17-31, January 2020.
Development and Validation of an Ion Chromatography Method for Quantification
of Ammonium Ions in STEALTH
®Liposomes
M. Arvand
a,b,*, A. Nickdoust Masouleh
band S.M. Jalilzadeh Moghimi
ca
Analytical Chemistry Laboratory, Faculty of Chemistry, University of Guilan, Namjoo Street, P. O. Box: 1914, Rasht, Iran
b
Department of Chemistry, Pardis Campus, University of Guilan, Park-e-Shahr, P. O. Box: 4199613776, Rasht, Iran
c
Sobhan Oncology Co. No. 11, 5th Alley, Bucharest Ave., Argentina Sq, Tehran, Iran (Received 10 December 2018 Accepted 16 June 2019)
Ammonium sulfate is one of the subsidiary components in the stealth liposome structure. The ratio of ammonium ion bound to liposome sphere to ammonium ions outside the liposome plays an important role in drug delivery formulation; accordingly, in order to
quantify the ammonium ion in the liposome structure, a rapid and sensitive method was validated using a conductivity detector. Through this method, the amount of ammonium enclosed in the liposomal spheres is determined by subtracting the amount of extra-liposomal
ammonium content from the total amount of ammonium present in the liposome structure. Destruction of the liposome structure with the
aid of 1% w/w Triton-X-100 solution allows for the analysis of the total ammonium ion present in the liposome structure. In the present research, ultrafiltration made it possible to isolate and analyze the extra-liposomal ammonium ions. This measurement was performed using an ion exchange chromatography column, isocratic elution flow and a linearity of 0.9998. Based on this signal-to-noise method, LOD was
determined as 0.0003 mM ammonium ion, with a signal-to-noise ratio of 3:1 and RSD of 1.4%. With a signal-to-noise ratio of 10:1, LOQ was determined as 0.001 mM ammonium ion with RSD 1.2%. In the determination of the total ammonium ion, the individual percentage recovery ranged from 100.00 to 100.93% and for the external ammonium ion analysis, the individual percentage recovery varied from
95.87 to 98.12% for all three levels and RSDs were 0.27, 0.71 and 0.71% for these concentrations.
Keywords: Stealth liposome, Drug delivery, Lysing agent, Ultrafiltration
INTRODUCTION
Since its advent in the early 1970s, controlled drug delivery systems, aimed at delivering drugs at predetermined rates and predefined periods of time, have attracted increasing attention [1,2]. Furthermore, drug delivery is an emerging field focused on targeting drugs or genes at a desirable group of cells. The objective of such targeted delivery is to transport proper amounts of drugs to desirable sites (such as tumors, diseased tissue, and so forth) while minimizing the unwanted side effects of the drugs on other tissues. Use of smart drug delivery systems has proven to be promising in developing intelligent therapeutic
*Corresponding author. E-mail: [email protected]
functionality due to their nanoscale size.
aqueous solvent. Other methods include reverse-phase evaporation, freeze-drying and ethanol injection. Techniques such as membrane extrusion, sonication, homogenization and/or freeze-thawing are currently being employed to control the size and size distribution [4]. Liposomes can be formulated and processed to differ in size, composition, charge and lamellarity. As a result of the extensive developments in liposome technology, a number of liposome-based drug formulations are available for human use and many products are under different clinical trials. The encapsulation of drugs in liposomes enhances the therapeutic indices of various agents, mainly through inducing alterations in their pharmacokinetics and pharmacodynamics. Drugs with different solubilities can be encapsulated in liposomes; hydrophobic drugs have affinity to the phospholipid bilayer and hydrophilic drugs are entrapped in the aqueous cavity [5]. For the first time, Bangham successfully observed that the phospholipids in aqueous medium form closed bilayer structures [6], termed liposomes by Sessa later on [7].
Liposome is comprised of an aqueous compartment surrounded by one, or more lipid bilayer. Initially, liposomes were used to study lipids orientation in bilayer and their physiochemical characterization as well as ion transport across biomembranes. Currently, however, liposomes are extensively being used for drug delivery as they meet all the requirements of a good delivery conduit. Liposomes are biodegradable, biocompatible, and stable in colloidal solutions. They can also prevent drug degradation, reduce drug-related nonspecific toxicity and be easily produced and formulated for a target specific delivery [8]. Liposomes are classified on the basis of their size and number of phospholipid membrane layers. Multilamellar Vesicles (MLV): These liposomes are large in size (up to 5 μm) and are composed of a number of concentric phospholipid bilayer membranes separated by aqueous phase. Small Unilamellar Vesicles (SUV), which their sizes range from 20-100 nm, is comprised of aqueous compartment enclosed by a single lipid bilayer. Large Unilamellar Vesicles (LUV): These liposomes also consist of a single lipid bilayer surrounding aqueous compartment. The size of these liposomes varies from 100 to 250 nm [9].
The major components of liposomes are phospholipids and cholesterol, both of which are major constituents of
natural biomembranes. The chemical properties of these lipids control the behavior of liposomes. The most common phospholipid used for the preparation of liposomes is natural (egg or soy) phosphatidylcholine, or synthetic phosphatidylcholine. Natural phospholipids such as egg, or soybean phospholipids contain substantial levels of polyunsaturated fatty acids which make them less stable than their synthetic equivalents. The molar percentage of phospholipids varies from 55 to 100% of the total liposomal components [10-12]. The rotational freedom of phospholipids (flip-flop movements) generates liposomes of leaky properties. In this regard, cholesterol is the main component added in the liposomal formulations to stabilize the bilayer of liposomes.
Certain weakly acidic or alkaline drug molecules are loaded into the preformed liposomes by active loading, or remote loading method, a process driven by an electrochemical potential created by the pH, or ion gradients established across the lipid bilayer of the liposomes. Active loading methods are dependent on an established and/or a created transmembrane pH gradient [13]. There are two principal ways to achieve a pH gradient across the liposome bilayer, direct and indirect. To directly establish the trans-bilayer pH gradient, liposomes are prepared in the presence of an acidic buffer. The indirect method is capable of forming a pH gradient through encapsulating the ammonium sulfate. Liposomes are prepared at the desired concentration of ammonium sulphate. The gradient is formed by removing the ammonium sulphate from the external liposome medium. Intraliposomal NH4+ dissociates
into NH3 and H+, NH3 escapes from the liposome and H+ is
retained in the liposome water phase. The drug is then added to the liposome dispersion at a temperature above the phase transition of the liposomal lipids. The desired drug such as doxorubicin (DOX), as a cationic amphiphile, is present in equilibrium between an ionized and a non-ionized form. The latter form commutes across the liposome bilayer and becomes ionized once exposed to the internal H+ environment, and forms a salt with the SO42- anions
(Scheme 1) [14].
19 the prior systemic chemotherapy [15]. Gabizon and Barenholz commenced the development of Doxil in liposome-based products. It was the first nano-sized liposomal product to obtain regulatory approval [16].
Stealth technology has been explored in developing a drug delivery system that is difficult to be detected by the mononuclear phagocyte system. In this technology, strands of polymer (s) are attached to drug molecules or a system that can ameliorate the safety and efficacy of therapeutic agents. Generally, polyethylene glycol (PEG) is used as a polymer, a process called PEGylation, where a reactive derivative of PEG is incubated with the target moiety. The covalent linkage of liposome to a PEG protects the active moiety from the recipient’s immune system, resulting in reduced immunogenicity and antigenicity. Such linkage also produces alterations in the physiochemical properties of the active moiety, including changes in the hydrodynamic size [5,17], which further reduces its renal clearance, thereby prolonging its circulatory time. Moreover, it provides hydrophilicity to hydrophobic drugs and reduces dosage frequency. It should be noted that these changes do not
diminish efficacy; on the contrary, they reduce the toxicity. In addition, due to the leaky nature of the tumor vasculature, nano-sized formulations with prolonged circulatory time show enhanced permeation and retention and slowly accumulate in the tumor bed. This technology, conducive to achieving a customized dosage profile, provided a very successful liposome-based product, namely Doxil, as an intravenous injection for the management of advanced ovarian cancer, multiple myeloma and HIV-associated Kaposi’s sarcoma [18].
Since ammonium ion plays an essential role in trapping the drug inside the liposomal spheres, measuring its exact amount can substantially affect the quality and stability of the drug [19-22]. Given that a direct measurement of ammonium ion inside liposome is not possible with conventional techniques, through the use of ultrafiltration and liquid chromatography with conductivity detector, the total amount of ammonium is measured and compared with the external ammonium ion; the difference between these two values is the amount of enclosed ammonium.
EXPERIMENTAL
Reagents
Deionized water (>18 MΩ), employed throughout the experiment, was prepared using a Milli-Q water purification system (Millipore Inc., USA). EDTA (ethylenediaminetetr-aacetic acid, 99.995% trace metals basis), ammonium chloride (NH4Cl) and nitric acid (ACS reagent, 70%) were
bought from Sigma-Aldrich (St. Louis, MO, USA). Triton-X-100 (electrophoresis grade) was purchased from Fischer Chemicals (Springfield, NJ, USA). Sina Doxosome® (STEALTH® liposomal doxorubicin·HCl; Sobhan Oncology Pharmaceutical, Rasht, IRAN) was used in the method development and validation as an example of a STEALTH® liposome drug-delivery system.
Materials and Equipment
Polyethersulfone (PES) membrane filters (0.02 µm), cellulose acetate membrane syringe filters (0.02 µm), Whatman® Anodisc inorganic filter membrane (0.02 µm and 0.45 µm) and Amicon ultra centrifugal filter units (Ultra-15, MWCO 10 kDa) were purchased from Sigma-Aldrich (St. Louis, MO, USA). Syringes (1 ml) were obtained from SOHA pharmaceutical Co. (Tehran, IRAN).
Instrumentation and Experimental Conditions
The instrumentation was performed through the use of Waters liquid chromatographic system (Alliance, 2695 Separations Module, with column heater, seal wash, and degasser, Waters Corporation, Milford, MA, USA) and a 432 conductivity detector, Bus SAT/IN module, and Empower/Breeze data processing. The analytical column was a Waters IC-PakTM Cation M/D (3.9 mm × 150 mm). The detector was operated in the conductivity mode and the temperature was 30 °C for the column heater and 35 °C for the detector. The injection volume, flow rate, base range, attenuation and back conductivity were set at 100 µl, 1 m l min-1, 2000, 100 µs V-1 unattenuated and 1250 ± 50 µs, respectively.
Solutions
Preparing eluent. In order to prepare a non-ionic buffer
to prevent the creation of undesirable peaks in the conductivity detector, the EDTA acid form was used instead
of sodium and potassium salts of EDTA. Thus, 0.029 g of EDTA as the acid form in a 1-liter plastic volumetric flask was dissolved in 500 ml of DI water with a stirring bar for 30 min. 30 ml of 100 mM HNO3 was added and diluted
to volume with DI water, and vacuum degas through a 0.45 µm aqueous-compatible membrane in order to remove excess EDTA crystals and stored in a plastic container at ambient temperature. A 9.4% w/w solution of sucrose was prepared in water. The lysing agent was a 1.0% w/w Triton-X-100 solution.
Standard stock solution. A standard ammonium ion
solution was prepared by weighing a proper amount of ammonium chloride in a polymer container and altering the volume to reach optimal concentrations. All standards were obtained from a standard 1000 ppm solution.
Sample preparation. To measure the total ammonium ion in the liposome structure, a solution with a concentration of approximately one thousandth of the Stealth sample was used. In order to measure the external ion, a volume of Stealth liposome was prepared using Amicon tubes and a centrifuge machine at 4000 rpm for 5 minutes; the filtered solution was further collected and used for analysis.
RESULTS AND DISCUSSION
Lysing Agent Selection
Liposomes stealth is a bilayer phospholipid with ammonium ions enclosed within. In order to measure the ammonium ion, the liposome structure has to be primarily destroyed so as to allow the release of ammonium in an aqueous medium [23]. As far as selecting suitable materials for the destruction of a liposome structure, one might make use of a very slight amount of lysing agent, along with the non-interference of the components of the lysing agent in measuring the desired ion, which ultimately delivers sufficient potency to destroy the liposomal structure. Several lysing agents such as Triton-X-100, Tween-20 (1%
w/w) and pure methanol were employed in this research, and evaluating the results, it became clear that 1% w/w
21 ultimately demolishing the integrity of the lipid membrane at the critical micelle concentration.
Experimental Procedure for Method Validation
Methods should be validated to include consideration
of characteristics included in the International Conference on Harmonization (ICH) guidelines [25]. Analytical methods outside the scope of the ICH guidance must always be validated. The most widely applied validation criteria for different tests are accuracy, precision (repeatability and
intermediate precision), specificity, detection limit, quantitation limit, linearity, stability of analytical solutions and system suitability [26].
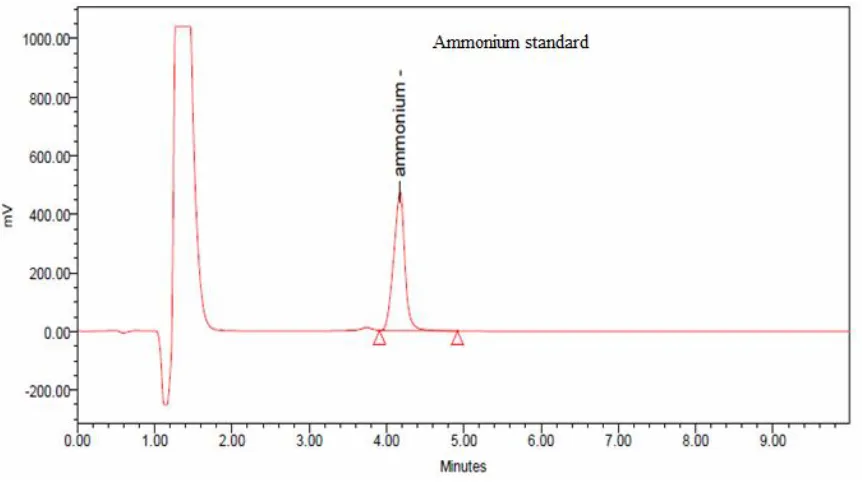
Specificity
This feature refers to the ability to unequivocally assess the analyte in the presence of components such as impurities, degradants, matrix, and so forth. Analytical techniques that can measure the analyte response in the presence of all potential sample components must be employed in the validation of specificity. Specificity is demonstrated by analyzing mobile phases, excipients, diluent and standards to show the absence of peaks, or those no more than 1% detectable, within 4 ± 1 min of the retention time for the ammonium ion. Figure 1 demonstrates the chromatograms of 9.4% sucrose (diluent), 1% Triton-X-100 and ammonium standard solution. Fortunately, in the sucrose and Triton-X-100 solutions, there are no peaks of ammonium ion. As can be seen, the presence of disturbing ions such as sulfate or chloride in sucrose and Triton-X-100, respectively, did not interfere with the ammonium measurement as seen in the work reported by Wang et al. [27].
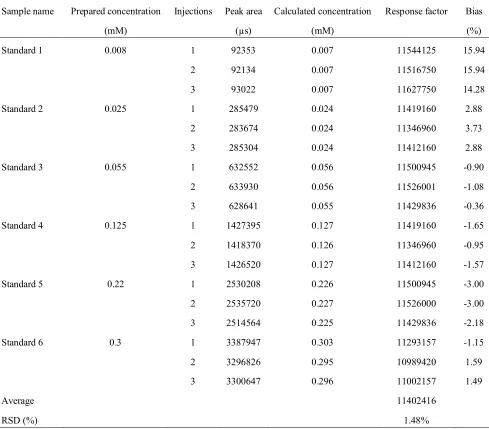
Linearity
Linearity of an analytical procedure is its ability
(within a given range) to obtain test results that are
directly proportional to the concentration (amount) of the
analyte in the sample. Linearity may be demonstrated
directly on the test substance (by dilution of a standard
stock solution) or by separately weighing the synthetic
mixtures of the test product components. The linearity of
the method was checked using a series of freshly prepared
calibration standard samples. A stock solution of
ammonium (1000 µg ml-1) was prepared in water and used
as internal standard (IS). Six concentrations of ammonium
were prepared in triplicate (0.008 to 0.3 mM), and as
described in the standard solution preparation section, linear
equation was extrapolated by plotting the peak area (S) of
the ammonium ion versus the standard concentration (mM
ammonium) using the least square method; further specified
parameters for the curve were the correlation coefficient,
slope, intercept, response factor and bias (Table 1). A
correlation of more than 0.999 was sought for the
calibration plot ranging from 0.008-0.3 mM ammonium ion.
23 A regression line was obtained with a correlation coefficient
of 0.9996 (inset of Fig. 2). The slope and intercept of the
regression line were 1.12 (±0.03) × 107 and 15371 ± 43,
respectively, while the standard error (Sy/x) was 23717. Figure 2 illustrates the overlay ammonium peaks.
Accuracy
Accuracy refers to the closeness of agreement between
the value accepted either as a conventional true value or an accepted reference value; when measuring accuracy, it is important to spike placebo preparations with varying amounts of active ingredient(s). Following the extraction of the analyte from the matrix and its injection into the analytical instrument, its recovery can be determined through comparing the response of the extract with that of the reference material dissolved in a pure solvent. Since such assessment of accuracy measures the effectiveness of
Table 1. Linearity of Ammonium ion in the Presence of 9.4% Sucrose
Sample name Prepared concentration
(mM)
Injections Peak area
(µs)
Calculated concentration
(mM)
Response factor Bias
(%)
Standard 1 0.008 1 92353 0.007 11544125 15.94
2 92134 0.007 11516750 15.94
3 93022 0.007 11627750 14.28
Standard 2 0.025 1 285479 0.024 11419160 2.88
2 283674 0.024 11346960 3.73
3 285304 0.024 11412160 2.88
Standard 3 0.055 1 632552 0.056 11500945 -0.90
2 633930 0.056 11526001 -1.08
3 628641 0.055 11429836 -0.36
Standard 4 0.125 1 1427395 0.127 11419160 -1.65
2 1418370 0.126 11346960 -0.95
3 1426520 0.127 11412160 -1.57
Standard 5 0.22 1 2530208 0.226 11500945 -3.00
2 2535720 0.227 11526000 -3.00
3 2514564 0.225 11429836 -2.18
Standard 6 0.3 1 3387947 0.303 11293157 -1.15
2 3296826 0.295 10989420 1.59
3 3300647 0.296 11002157 1.49
Average 11402416
25 sample preparation, care should be taken to mimic the actual sample preparation as closely as possible. If validated correctly, the recovery factor determined for different concentrations can be used to correct the final results. Six concentrations, between 0.426 and 0.0276% ammonium ions, were used to determine total and external ammonium recovery, respectively. It is important because external ammonium concentration was assumed to be less than 15% of total ammonium in the stealth. The results of the study are shown in Table 2. In the determination of the total ammonium ion, the individual percentage recovery ranged from 100.00-100.93% and the mean percentage recovery was 100.93% for level 1, 100.00% for level 2, and 100.58% for level 3. Regarding the external ammonium ion analysis, the individual percentage recovery varied from 95.87 to 98.12% for all three levels, and the mean percentage recovery was 98.12% for level 1, 96.71% for level 2, and 95.87% for level 3. Mean percentage recoveries within 10% were considered as satisfactory.
Precision
Repeatability. Precision of an analytical procedure is the closeness of agreement (degree of scatter) among a series of measurements obtained from multiple sampling of the same homogeneous sample under prescribed conditions. The precision of an analytical procedure is usually expressed as the variance, standard deviation or coefficient of variation of a series of measurements. Data generated from both the total and external ammonium ion analysis (all levels) in the study of accuracy were used to calculate the RSD. The data shown in Table 2 specify the total ammonium concentration. RSDs are 0.27, 0.71 and0.71% for concentrations 1 (0.423 mM ammonium), 2 (0.394 mM ammonium), and 3 (0.34 mM ammonium), respectively. Based on the recovery percentage of the nine spiked samples, the precision of the total ammonium assay is 0.66%. For external ammonium concentrations, the RSDs are 0.41, 0.84 and 1.44% for concentrations 1 (0.0375 mM ammonium), 2 (0.032 mM ammonium), and 3 (0.0276 mM ammonium), respectively. The precision of the external ammonium assay is 2.33%. A repeatability of less than 1% for the total ammonium assay is generally acceptable for an IC method. Regarding the inherent changes observed with the use of membrane filter, repeatability for external
ammonium assay less than 10% is desirable.
Intermediate precision: Day-to-day. Intermediate
precision conditions allow factors such as operators and apparatus, longer periods of time within a single laboratory, whereas repeatability conditions keep these factors constant. Specific intermediate conditions have come to be defined by varying some, but not all, of the potential factors causing variability. In our study, this approach was evaluated by analyzing six preparations (triplicate injections) of one indicative batch of STEALTH® liposomes over a period of three days for total and external ammonium ions. The precision was specified via the RSD of each day and the RSD of day-to-day mutation. In analyzing the total ammonia ion, RSDs pertaining to each single day ranged from 0.0151-0.0644% (Table 3). Day-to-day precision associated with the total ammonium was 0.0471%. Because of the intrinsic method variation for external ammonium ion analysis, RSDs ranged from 0.2416-0.3590% for each individual day. Day-to-day precision of the external ammonium ion analysis was 0.3020%. Day-to-day precisions of less than or equal to 5 and 10% for the total and external ammonium ion analysis are satisfactory.
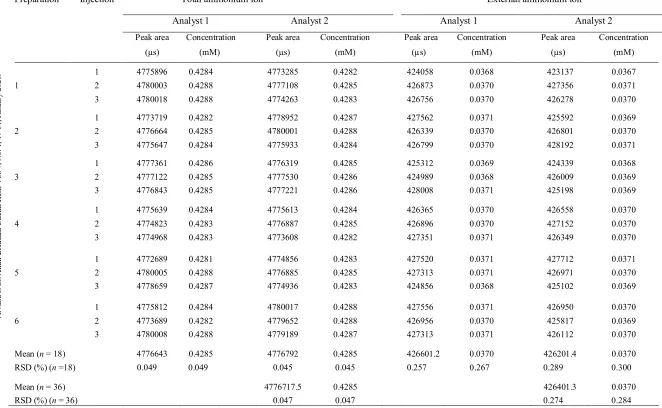
Intermediate precision: Analyst-to-analyst.
Analyst-to-analyst precision was determined by two various analysts via analyzing six preparations (triplicate injections) of STEALTH® liposomes over two days. The RSDs (analyst-to-analyst) of the results acquired from the two analysts were specified for both the total and the external ammonium ion. Concerning the total ammonium ion analysis, the RSDs obtained from analyst 1 and analyst 2 were 0.045 and 0.049%, respectively (Table 4); analyst-to-analyst variation was 0.047%. Regarding the external ammonium ion analysis, the RSDs were 0.257 and 0.3%, respectively, with the analyst-to-analyst variation being 0.284%.The results of this study are acceptable.
Method of Detection Limit
0.0003 mM ammonium ion, with a signal-to-noise ratio of 3:1 and RSD for this measurement was 1.4%.
Limit of Quantitation
Limit of quantitation (LOQ) of an individual analytical procedure is the lowest amount of analyte in a sample which can be quantitatively determined with a suitable precision and accuracy. The quantitation limit is a parameter of quantitative assays for low levels of compounds in sample matrices; LOQ can also be specified through comparing signals measured from samples with low concentrations of analyte and those of blank samples establishing the
minimum concentration at which the analyte can be reliably quantified. With a typical signal-to-noise ratio of 10:1, LOQ was determined as 0.001 mM and RSD for this measurement was 1.2%.
Stability of Stock Solutions
Stability plays an important role in estimating the allowed time span between sample collection and sample analysis. This property was evaluated through preparing stock solutions of the analyte in an appropriate solvent at specified concentrations. The stability of the standard stock solutions was evaluated at room temperature for at least
Table 2. Accuracy/Recovery of Ammonium from STEALTH® Liposome Product
Level Prepared
concentration
Calculate concentration
Individual recovery
(mM) (mM) (%)
Total ammonium
0.426 100.70
1 0.423 0.428 101.23
0.427 100.86
0.395 100.35
2 0.394 0.399 100.46
0.391 99.19
0.341 100.18
3 0.34 0.341 100.16
0.345 101.41
Mean recovery (%) (n = 9) 100.50
RSD (%) (n = 9) 0.66
External ammonium
0.037 98.59
1 0.0375 0.037 97.95
0.037 97.84
0.031 95.75
2 0.032 0.031 97.31
0.031 97.06
0.027 96.59
3 0.0276 0.026 94.28
0.027 96.74
Mean recovery (%) (n = 9) 96.90
RESEARCH Published by the
Iranian Chemical Society
Injection Total ammonium ion
concentration (mM)
External ammonium ion concentration (mM)
Day 1 Day 2 Day 3 Day 1
1 0.4284 0.4282 0.4279 0.0368
2 0.4286 0.4287 0.4282 0.0369
3 0.4280 0.4288 0.4284
1 0.4288 0.4286 0.4283 0.0370
2 0.4285 0.4282 0.4282 0.0370
3 0.4282 0.4280 0.4282 0.0371
1 0.4281 0.4279 0.4288 0.0369
2 0.4283 0.4287 0.4293 0.0370
3 0.4283 0.4285 0.4286 0.0370
1 0.4282 0.4284 0.4283 0.0371
2 0.4282 0.4282 0.4287 0.0371
3 0.4288 0.4287 0.4286 0.0371
1 0.4287 0.4285 0.4286 0.0370
2 0.4281 0.4288 0.4281 0.0370
3 0.4287 0.4284 0.4280 0.0369
1 0.4279 0.4282 0.4286 0.0371
2 0.4282 0.4287 0.4287 0.0370
3 0.4283 0.4286 0.4286 0.0369
Mean (n = 18) 0.4283 0.4284 0.4284 0.0370
RSD (%) (n = 18) 0.0644 0.0619 0.0151 0.2416
Mean (n = 54) 0.4284
RSD (%) (n = 54) 0.0471
Iranian Chemical Society
Preparation Injection Total ammonium ion External ammonium ion
Analyst 1 Analyst 2 Analyst 1 Analyst 2
Peak area
(µs)
Concentration
(mM)
Peak area
(µs)
Concentration
(mM)
Peak area
(µs)
Concentration
(mM)
Peak area
(µs)
Concentration
(mM)
1 4775896 0.4284 4773285 0.4282 424058 0.0368 423137 0.0367
1 2 4780003 0.4288 4777108 0.4285 426873 0.0370 427356 0.0371
3 4780018 0.4288 4774263 0.4283 426756 0.0370 426278 0.0370
1 4773719 0.4282 4778952 0.4287 427562 0.0371 425592 0.0369
2 2 4776664 0.4285 4780001 0.4288 426339 0.0370 426801 0.0370
3 4775647 0.4284 4775933 0.4284 426799 0.0370 428192 0.0371
1 4777361 0.4286 4776319 0.4285 425312 0.0369 424339 0.0368
3 2 4777122 0.4285 4777530 0.4286 424989 0.0368 426009 0.0369
3 4776843 0.4285 4777221 0.4286 428008 0.0371 425198 0.0369
1 4775639 0.4284 4775613 0.4284 426365 0.0370 426558 0.0370
4 2 4774823 0.4283 4776887 0.4285 426896 0.0370 427152 0.0370
3 4774968 0.4283 4773608 0.4282 427351 0.0371 426349 0.0370
1 4772689 0.4281 4774856 0.4283 427520 0.0371 427712 0.0371
5 2 4780005 0.4288 4776885 0.4285 427313 0.0371 426971 0.0370
3 4778659 0.4287 4774936 0.4283 424856 0.0368 425102 0.0369
1 4775812 0.4284 4780017 0.4288 427556 0.0371 426950 0.0370
6 2 4773689 0.4282 4779652 0.4288 426956 0.0370 425817 0.0369
3 4780008 0.4288 4779189 0.4287 427313 0.0371 426112 0.0370
Mean (n = 18) 4776643 0.4285 4776792 0.4285 426601.2 0.0370 426201.4 0.0370
RSD (%) (n =18) 0.049 0.049 0.045 0.045 0.257 0.267 0.289 0.300
Mean (n = 36) 4776717.5 0.4285 426401.3 0.0370
RSD (%) (n = 36) 0.047 0.047 0.274 0.284
2
8
A
rv
an
d
e
t a
l.
/A
n
a
l.
B
io
a
n
a
l.
C
h
em
. R
es
.
,
V
o
l.
7
, N
o
.
1
,
1
7
-3
1
,
Ja
n
u
ar
y
2
0
2
0
Published by the
Iranian Chemical Society
Table 5. Recovery of Ammonium Ion Filtered through Amicon Tube Filters
Filter Prepared
concentration (mM) Calculated concentration (mM) Mean concentration (mM) RSD (%) Individual recovery (%) Mean recovery
(n = 3, %)
0.429 99.45
pvdf 0.423 0.428 0.429 0.060 99.71 99.60
0.429 99.63
0.429 99.54
Cellulose
acetate 0.423 0.429 0.429 0.014 99.54 99.61
0.429 99.75
0.428 99.94
pes 0.423 0.428 0.428 0.047 100.01 99.95
0.429 99.91
Iranian Chemical Society
72 h. After the completion of the desired storage time, the percentage of ratio of ammonium ion at individual times over the initial value (t0) varied during a 3-day evaluation at
2% variation.
Stability of Sample Solutions at 2-8 °C
To determine the sustainability of the sample solutions at 2-8 °C, 18 solutions (nine for total ammonium samples and nine for external ammonium samples) were made, stored at 2-8 °C, and analyzed at various time points. Following a 7-day period, the percentage ratio of ammonium ion concentration at later time points was 99.87 to 100.04% for the total ammonium and 99.21 to 100.26% for external ammonium. The results indicated that the samples for external ammonium ion analysis and the total ammonium ion assay could be stored at 2-8 °C for up to 7 days.
Effect of Filtration on Ammonium Recovery
It is important to evaluate the impact of filters employed to clarify the samples, because first, it demonstrates whether or not the use of filter causes any interference in the determinative step. Second, it specifies if there exists a loss of active drug during the filtration process. The samples were filtered by Amicon tube and analyzed for external ammonium ion assay. The results showed that the solo percentage recovery of ammonium ion ranged from 99.45-100.01% (Table 5). The mean solo recovery of all three filter types varied from 99.60 to 99.95%. No remarkable variation was observed in the recovery of ammonium ion from the filters. Percentage of recovery within the 3% range is desired.
System Suitability
System suitability tests are an integral part of liquid chromatographic methods. They are used to indicate whether the resolution and repeatability of the chromatographic system are adequate for the analysis. System suitability is expressed in replicate injections of a single standard solution. The RSD was calculated for both response and retention time peaks. The RSD of peak areas and retention time from the six replicate injections of a single ammonium ion standard (~0.423 mM of ammonium
ion) were 0.3 and 0.2%, respectively. Theoretical plates (N Tangential) and capacity factor (k') were also evaluated. The theoretical plate ranged from 3600-4100, and the capacity factor varied between 2.05 and 2.07. The RSD of peak areas was less than 2% which is satisfactory for a chromatographic assay per USP 39.
CONCLUSIONS
It is concluded that the quantification of ammonium ions leads to more accurate and valid results and its detection limit is more favorable compared to measuring sulfate ion. Regarding the validation based on the ICH guideline, it was found that ammonium ions can be measured in lower concentration ranges (ppb) than sulfate ions (ppm). Additionally, the presence of sulfate impurities in the structure of sucrose and chloride impurities in the structure of Triton-X-100 are among the intrusive factors that interfere with the measurement of sulfate ion in the work reported by Wang et al. [27]. While these materials do not have positive charge ions leading to an interference with ammonium ions measurement.
ACKNOWLEDGMENTS
This study was supported by the University of Guilan (No. GU/FC13952) and Sobhan Oncology Co (Tehran, Iran).
REFERENCES
[1] S. Deepu, M. Mathew, M.S. Shamna, Int. J. Pharm. Chem. Sci. 3 (2014) 636.
[2] B. Jeong, S.W. Kim, Y.H. Bae, Adv. Drug Deliv. Rev. 54 (2002) 37.
[3] A.D. Bangham, M.M. Standish, J.C. Watkins, J. Mol. Biol. 13 (1965) 238.
[4] V. Torchilin, V. Weissig (Eds.), Liposomes: a practical approach, Oxford University Press, 2003. [5] F.M. Veronese, M. Harris, Adv. Drug Deliv. Rev. 54
(2002) 453.
31 [8] A. Akbarzadeh, R. Rezaei-Sadabady, S. Davaran,
S.W. Joo, N. Zarghami, Y. Hanifehpour, M. Samiei, M. Kouhi, K. Nejati-Koshki, Nanoscale Res. Lett. 8 (2013) 102.
[9] H. Pandey, R. Rani, V. Agarwal, Braz. Arch. Biol. Technol. 59 (2016) 1.
[10] J. Li, X. Wang, T. Zhang, C. Wang, Z. Huang, X. Luo, Y. Deng, Asian J. Pharm. Sci. 10 (2015) 81.
[11] A. Laouini, C. Jaafar-Maalej, I. Limayem-Blouza, S. Sfar, C. Charcosset, H. Fessi, J. Colloid Sci. Biotechnol. 1 (2012) 147.
[12] N. Tyagi, S.S. Rathore, P.C. Ghosh, Drug Deliv. 18 (2011) 394.
[13] D.D. Lasic, P.M. Frederik, M.C. Stuart, Y. Barenholz, T.J. McIntosh, FEBS Lett. 312 (1992) 255.
[14] U. Bulbake, S. Doppalapudi, N. Kommineni, W. Khan, Pharmaceutics 9 (2017) 1.
[15] C. Allen, N. Dos Santos, R. Gallagher, G.N. Chiu, Y. Shu, W.M. Li, S.A. Johnstone, A.S. Janoff, L.D. Mayer, M.S. Webb, M.B. Bally, Biosci. Rep. 22 (2002) 225.
[16] A. Gabizon, R. Catane, B. Uziely, B. Kaufman, T. Safra, R. Cohen, F. Martin, A. Huang, Y. Barenholz,
Cancer Res. 54 (1994) 987.
[17] R.C. Leonard, S. Williams, A. Tulpule, A.M. Levine, S. Oliveros, The Breast18 (2009) 218.
[18] P.K. Working, A.D. Dayan, Hum. Exp. Toxicol. 15 (1996) 751.
[19] M.L. Immordino, F. Dosio, L. Cattel, J. Nanomedicine 1 (2006) 297.
[20] D.D. Lasic, N. Needham, Chem. Rev. 95 (1995) 2601. [21] P. Tardi, N. Boman, P. Cullis, J. Drug Target. 4 (1996)
129.
[22] W.C. Zamboni, Clin. Cancer Res. 11 (2005) 8230. [23] D.D. Lasic, F.J. Martin, Stealth Liposomes, CRC
Press, 1995.
[24] T. Ishida, M.J. Kirchmeier, E.H. Moase, S. Zalipsky, T.M. Allen, Biochim. Biophys. Acta 1515 (2001) 144. [25] ICH Harmonized Tripartite Guideline Q2B: Validation of Analytical Procedures: Methodology, 1996.
[26] United State Pharmacopeia 39, United State Pharmacopeial Convention, 2015.