Product Recommended Using System Item-Based
Collaborative Filtering With Slope One Algorithm
Case Study: Omahgeulis.com
Deni Aditiya, Nur Nawaningtyas Pusparini, Rudi Setiyanto, Ahmad Syauki,
Sofian Lusa
Master Program in Computer Science, Information System Technology, Budi Luhur University Jl. Raya Ciledug, North Petukangan, Kebayoran Lama, South Jakarta 12260
---************************---Abstract:
Sales of products online or e-commerce is currently becoming a trend in Indonesia. This is supported with the increasing number of internet users in Indonesia, making business opportunities in e-commerce more attractive to business people. PT.Victoria Care Indonesia is a company engaged in manufacturing for cosmetic and toiletris products, some brands of products are Victoria, Herborist, Miranda, Iria, Nuface, and Sixsence. In 2017 the company released Omahgeulis.com website to market its products online. But the number of products offered to make customers difficult to find products relevant to his interests so that sales at Omahgeulis.com less than the maximum. For that required a system that can facilitate customers in finding product information, one of them by recommending the product. Item-based collaborative filtering is a method for generating recommendations based on similarities between items. Slope One is an algorithm for rating predictions of products that have not been rated by users, this algorithm has advantages that are easy to implement, fast query time, and able to compete in accuracy with other approaches. The working principle of the Slope One algorithm is to calculate the average value of the deviation between items, the advantage is that when there is a new rating the system does not need to calculate from the beginning, but simply adds a new rating with the average deviation value then divides it by the amount of data so as to produce an average value for new deviation. To test the accuracy of the rating prediction value by the research system using Root Mean Squared Error (RMSE) by comparing the rating prediction value with the original rating value. From the test results obtained RMSE error value 0.87.
Keywords
—item-Based Collaborative Filtering, Slope One, Root Mean Squared Error
(RMSE), Product Recommendations.
---************************---1.
INTRODUCTION
Selling products through internet media or known as e-commerce is becoming a trend in Indonesia. This is supported with the increasing number of internet users in Indonesia to make business opportunities more attractive to business actors both at home and abroad. PT Victoria Care Indonesia is a company engaged in manufacturing for cosmetics and toiletries products. The company's branded brands are Herborist, Miranda, Iria, Nuface, Victoria, and Sixsence. In addition to selling products through retail stores, PT.Victoria Care
method that can provide predictions or recommendations based on user opinions that have similarities. This opinion can be either explicit or implicit [1]. The idea is that the product is in demand by users who are similar to the target users, then the product is potentially in demand by the target users.
Opinions collected in the form of user ratings for items, this rating data set (dataset) then becomes the basis of the CF method to generate personal recommendations by calculating the value of similarity. The CF method has two types of approaches: user-based and item-user-based. As the name implies user-user-based basing the calculation of similarity with the user object or user, while item-based calculation of similarity is done between items. In e-commerce, the number of users will continue to increase compared to the number of relatively stable products, on the basis of this study using an item-based approach.
Slope One is an algorithm introduced in 2005 that can calculate similarities between items [1]. This algorithm performs calculations based on the difference of the rating that the user gives to the item. The idea is that users have rated product A is two-point higher than product B, then another user has the potential to rank A more than two points higher than product B. Slope one has advantages that are easy to implement, shorter query times, if there is a new user the system does not need to calculate from the beginning and is able to provide good recommendations for new users to rate some items.
1.1.
Problem Definition
After identifying the problem, it can be formulated as follows:
1. How is the method in recommending the product based on visit and order data?
2. How the rating process uses customer visit and order data?
3. How to measure the accuracy and how much error rate is generated in predicting the recommendation product?
1.2.
Scope and Constrain
In order for this research to be directed, the authors need the scope of research as follows:
1. The object used in the study is the ordering data and customer visits on OmahGeulis.com site 2. Using Rating Scale with a scale of 1-10, 1-5 for
assessment visits and 6-10 for appraisal order. 3. Using Item-based Collaborative Filtering Method
with Slope One algorithm in selecting product recommendation.
4. Using the Root Mean Squared Error (RMSE) method to calculate the error value in predicting the recommendation product.
2.
THEORY
2.1.
Collaborative Filtering
The working principle of collaborative filtering algorithm is to provide recommendations on the opinions of users who have similarities. Recommendations can be either explicit or implicit. The main purpose of collaborative filtering is to encourage new items or predict the evaluation of items to users personally based on similarity of interest. This opinion can be given explicitly with the customer rating scale. It is also implicit from customer order history data [2]. To implement collaborative filtering there are two approaches that are user-based (user-based collaborative filtering) and item-based collaborative filtering (item-based collaborative filtering).
Figure1.Difference betweenuser-based and item-based collaborative filtering[3]
User-based collaborative filtering begins by finding a similar user who buys or ranks the same item with the target user's purchase or rating. Users who are similar to this user target are found with what is called a user similarity value. The similarities between the two users can be calculated using several ways in which the optimal approach may vary. [4]
Item-based collaborative filtering is another alternative that can be used to recommend items. On user-based does not work well when used for millions of users and millions of items due to computing compatability to find the user resemblance. It is therefore proposed an item-based method in which matching items that have been user-rated with other items that have similarities to the item, rather than matching similarities with other users. [5]
2.2.
Slope One Algorithm
the target user rating and target items to be predicted. Therefore, if the user does not give one, then the prediction can not be done.
Suppose there are 2 users A and B, and 2 items are I and J. As shown in Figure 2, user A assigns a rating of 1 for items I and 1.5 for item J, whereas user B gives a rating of 2 for item I only. From this it can be seen that the difference in the rating between items I and J of 1.5-1 = 0.5. With this difference, it can be predicted that user B will assign a rating to item J of 2 + 0.5 = 2.5
Figure2. Slope One Algorithm Scheme
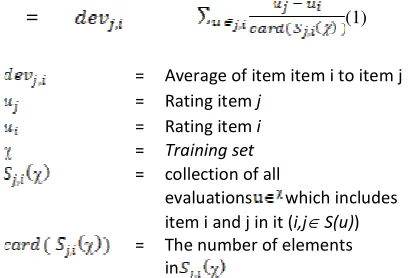
Mathematically, the Slope One algorithm approach is described as follows: given the rating of a user denoted as u, where is the rating given by user u to item i. Set or set of evaluation in the training set. The number of elements in S is notated with card (S). The average rating in an evaluation u is notified by u, whereas is the set or set of all evaluations which includes item i in it (i∈S(u)). Thus, the calculation of correlation between items to find out how close the relationship between 2 items based on the difference in rating and the number of ratings formulated as follows:
(1) =
= Average of item item i to item j = Rating item j
= Rating item i
= Training set
= collection of all
evaluations which includes
item i and j in it (i,j∈ S(u)) = The number of elements
in
If it is known that the average of the item's gap difference to item j, then we can calculate the rating prediction for item j formulated with using the weighted slope one equation as follows:
(2)
= prediction Slope One for item j
= number of users who merat item i and j
Where =
2.3.
Root Mean Squared Error (RMSE)
Root Mean Squared Error (RMSE) is a method that can be used to measure the error rating prediction rate generated by recommendation system.
(3)
where if forecasting value, is the true value, dan n is amount of data. Based on above equation, where f_i is the forecasting value, y_i is the true value, and n is the amount of data. Based on the above equation, RMSE gives greater weight compared to Mean Squared Error (MSE), ie the quadratic root value of error. For example, twice the RMSE value means the model has an error twice as big as before. While the value of MSE does not mean so. If the MSE can be analogized as a variant, then RMSE can be analogized as a standard deviation. (Survyana, 2017)
2.4.
Hipotesis
Based on the conceptual framework that has been elaborated, it can be formulated hypothesis as follows: 1. It is assumed that the application of Item-based
Collaborative Filtering method with slope one algorithm can be used to predict recommendation product based on visit and order data.
2. Allegedly the use of scale rating with a scale of 1-10 can be used to rate data visits and product order 3. Alleged Root Mean Squared Error (RMSE) can be
used to calculate error value in predicting product recommendation.
3.
METHODOLOGY AND RESEARCH
DESIGN
This section describes the steps undertaken in the study. The research consists of 4 steps: data collection, preprocessing data, building recommendation system, and evaluation of recommendation result.
4.
RESULT
4.1.
Collection Data
At this stage the authors collect data and information needed in building a product recommendation system.
4.1.1.
Related Work
At this stage the authors look for research related to product recommendation system. The purpose of the literature study of the authors is to study the methods that can be used to recommend products.
1. Research by Survyana (2017) entitled "film recommendation engines using genre-based collaborative filtering methods" combines model-based or item-model-based collaborative filtering methods with content-based or content-based recommendations. From this study the authors studied how to build a hybrid recommendation system by combining two approaches and the use of other algorithms to improve the accuracy of recommendations..
2. Research by Handrico (2012) entitled "library recommendation system of science and technology faculty faculty with collaborative filtering method". From this study researchers were inspired to use visit data and order data with a rating scale of 1-5 for visits and 6-10 for product ordering.
3. Research by Sarwar et al [2] in his research entitled "Item-Based Collaborative Filtering Recomendation Algorithms" discusses the recommended techniques with other approaches that are item-based that have better performance on user data that continues to grow as in e-commerce. From this study the authors were inspired to use the item-based collaborative filtering approach at omahgeulis.com ecommerce site so that the performance of the recommendations is relatively stable with the ever-growing data.
4. Research by Wahyudi [7] entitled "Personalization of Web E-Commerce Using the Recommender System with Item-Based Collaborative Filtering Method". From this study the authors were inspired to use slope one algorithm which has computation time fast enough and easy to apply and also level of accuracy which can compete with other algorithm.
4.1.2.
Observation
To generating product recommendations we need to know the interaction data between the target users and the product. In this study the authors use two data sources of visits and product reservations. To the authors make direct observations of visits and product reservations by customers for 4 months starting from August 2017 to november 2017.
1. Purchase data. The purpose of the observation of booking data, the author wants to know how the total number of reservations, the number of orders
that continue until the stage of payment, and who made reservations and what products are ordered. To collect the ordering data the author performs a query on the omahgeulis.com database.
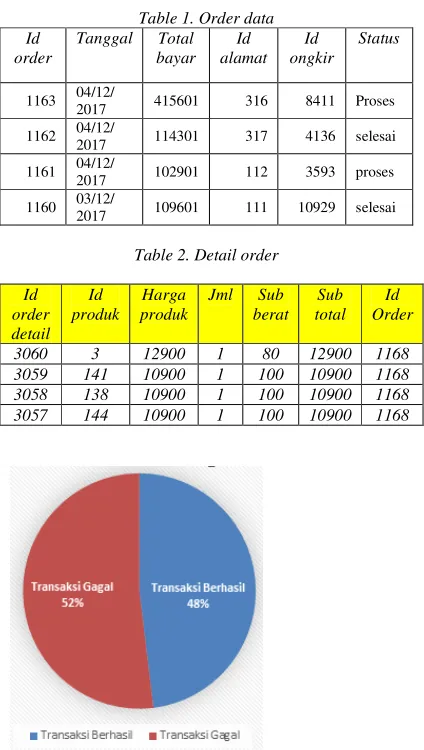
Table 1. Order data Id
order
Tanggal Total bayar
Id alamat
Id ongkir
Status
1163 04/12/
2017 415601 316 8411 Proses
1162 04/12/
2017 114301 317 4136 selesai
1161 04/12/
2017 102901 112 3593 proses
1160 03/12/
2017 109601 111 10929 selesai
Table 2. Detail order
Id order detail
Id produk
Harga produk
Jml Sub
berat Sub total
Id Order
3060 3 12900 1 80 12900 1168
3059 141 10900 1 100 10900 1168
3058 138 10900 1 100 10900 1168
3057 144 10900 1 100 10900 1168
Figure 4. Graph order for 4 months
From the observation of the booking data, the number of incoming reservations is 443, from 443 orders of 213 continues until the payment stage and the remaining 230 do not proceed to the payment stage which means only 48.08% of successful transactions. While the product data ordered and anyone who ordered will be used as a dataset author to make product recommendations.
2. Visit data. The purpose of this observation the author wanted to know the number of visits, who visited and what products visited. To collect writer visit data mamanamkan program that will record every time a user visits omahgeulis.com site.
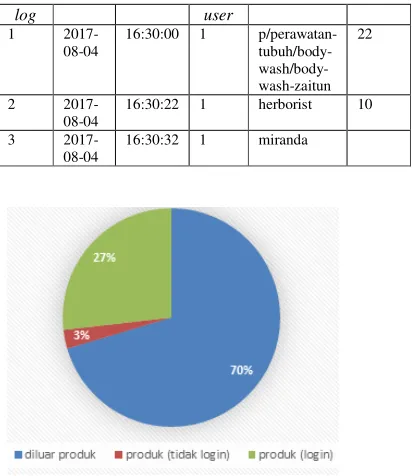
Table 3.Web visiting data
log user 1
2017-08-04
16:30:00 1 p/perawatan- tubuh/body- wash/body-wash-zaitun
22
2 2017-08-04
16:30:22 1 herborist 10
3 2017-08-04
16:30:32 1 miranda
Figure 5. Visit graph for 4 months
From the observation is known there are 50,110 visits, of the total of 14,823 is a visit to the product, from the visit of the product 13,432 visits made by users who have logged. The data to be used as a dataset is a visit to the product and the user is logged in.
4.2.
Preprocessing Data
At this stage the data that has been collected is processed first. Preprocessing consists of data cleansing and grouping data.
1. Ordering data. From the observation of the order data is known there are reservations that continue until the payment and some are not. Order data is then done by sorting using only the data ordering is successful only. Then the data is grouped based on time and user into multi dimensional table. The purpose of adding the time dimension so that the system can recognize changes in customer interest.
Figure 6.Multi dimensional order data
2. Visit data. From the observation is known not all user visits are products, to do the sorting of data visits used are visits to the product and the user has logged. The data are then grouped by time and users into multi dimensional tables.
Figure 7. Multi dimensional visiting data
4.3.
Building Recommendation System
At this stage the previously processed data will be used to produce the recommendation product. The development process of the recommendation system is divided into three stages: peratingan, calculating deviation and prediction
1. Rating.
the rating scale that has been specified purchase 4 will have a rating of 9.
Table 4. User rating data
user_id item_id Rating
100 186 1
101 187 2
102 187 3
103 6 2
104 187 1
105 187 1
106 3 1
107 187 1
108 3 1
Figure 8.Multi dimensional user rating data
2. Calculate the deviation. A deviation is the difference in the rating data of a comparable item, the deviation used to calculate a predicted user rating rating against an item that has not been rated. The deviation value between the items of the calculation results is then entered into Table oso_slope_one consisting of item_id1, item_id2, times and rating attributes. Item_id1 and item_id2 contain the product id_products are compared, the times contained the number of users who reviewed the two comparable products and the ratings contained the difference in rating (deviation) values of the two products compared.
Table 5.Deviation data between items
To obtain the value of deviation between items used equation (1). Suppose there is a rating of 3 users and 3 products as in Table 6
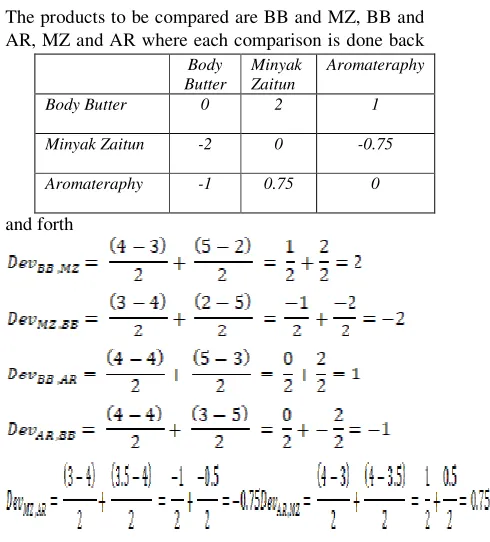
Table 6. User dataset rating
Body Butter BB
Minyak Zaitun MZ
Aromateraphy AR
Deni 4 3 4
Sheilla 5 2 ?
Pram ? 3.5 4
Rudi 5 ? 3
The products to be compared are BB and MZ, BB and AR, MZ and AR where each comparison is done back
and forth
Table 7.Data of deviation calculation result between items
3. Calculating predictions. Once the deviation data between the products is obtained, the next step is to predict the value of the user rating against items that have not been rated. To calculate rating prediction value using Weighted Slope One equation (2). Suppose the target user has a rating of body butter 5 products and olive oil 2, based on the data how the prediction of the target user rating of aromateraphy products.
Table 8.User target product rating
Target Pengguna
Body Butter BB
Minyak Zaitun MZ
Aromateraphy AR
Sheilla 5 2 ?
In Table 7 it is known that the aromatherapy product deviation of the body butter product is (-1) then is 4 which is the result of the calculation of 5 + (- 1). Then see Table 6 shows the
item_id1 item_id2 times rating
2 1 60 0.2667
3 1 56 0.2143
11 1 28 0.1429
74 1 48 -0.2500
207 1 48 0.6667
210 1 28 -0.1429
Body Butter
Minyak Zaitun
Aromateraphy
Body Butter 0 2 1
Minyak Zaitun -2 0 -0.75
number of users who merating body butter and aromateraphy as much as 2 users namely Rudi and Deni then the value is 2, so = 4x2 = 8.
Switch to olive oil product where the user targets give an assessment of 2. The deviation value of aromatherapy products to olive oil in Table 7 is known at 0.75, hence = 0.75+2 =2.75. Table 6 shows the number of users who merik aromateraphy products and olive oil as much as 2 users ie Pram and Deni then the value of is 2, so = 2.75x2 = 5.5. The next step is to sum up the deviation values as follows
From the calculation is known prediction of the rating value that will be given the target users of aromateraphy products of 3.375. Do the same all products that have not been rated by the target users then the products are sorted based on the highest rating.
4.4.
Evaluation of Recommendation
At this stage the results of the recommendations will be tested for their accuracy. Accuracy testing is done by clearing certain product rating data provided by the user and then comparing it with the predicted rating given by the system. In the calculation of accuracy using Root Mean Squared Error (3).
Suppose the data is tested on the target users of the 5 products where the first product obtained the predicted 5.5 rating rating and the original rating value 6, the second product obtained the predicted value rating of 5.42 and the original rating value 6, the third product obtained the predictive rating value 5 and the value of the original rating 6, the product the fourth obtained a prediction rating of 5.4 and the value of the original rating of 6, the fifth product obtained the value of predictive value 6 and the original rating of 6 so it can be calculated RMSE value as follows.
= 0.622334
In this study the test data is taken randomly consisting of 10 users where on each user will see the
rating value to 5 products so that there are 30 total data rating, then the value is hidden to compare with the predicted results system. Here are the results of product recommendation testing system.
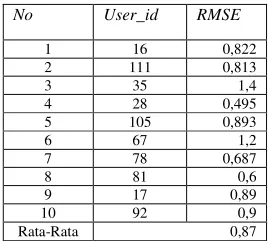
Table 9. RMSE test result data
No User_id RMSE
1 16 0,822 2 111 0,813 3 35 1,4 4 28 0,495 5 105 0,893 6 67 1,2 7 78 0,687 8 81 0,6 9 17 0,89 10 92 0,9 Rata-Rata 0,87
Based on the test results obtained an average value of RMSE of 0.87. This means that in making a rating prediction, the system just missed 0.87 from the original rating value.
5.
CONCLUSION
Based on the discussion that has been described previously it can be concluded as follows:
1. The method of item-based collaborative filtering can be used to recommend products on the omahgeulis.com site
2. The use of scale rating on a scale of 1-10 can be used to process the rating of ordering data and product visits
3. The use of slope one algorithm can yield reasonably accurate product recommendations. This can be seen from the test using Root Mean Squared Error (RMSE) resulted in an error value of 0.87. 4. User visit and product order data can be used as a
rating for prediction calculations of products that have not been rated by users.
6.
FUTURE WORK
To produce a better recommendation, the authors have some suggestions as follows:
1. Using a combination of explicit and implicit data, explicit data such as product rating data provided directly by the user when reviewing the product. 2. Using a combination of different algorithms eg
using naive bayes to calculate the probability of similarity of the product.
3. Using other testing methods, such as User Acceptance Test (UAT) to measure the level of user acceptance of product recommendation results.
REFFERENCES
[2] A. Kusniarto, Berkreasi membuat album foto dengan power point 2007, Jakarta: Elex Media komputindo, 2008.
[3] Ariyus, Keamanan Multimedia, Yogyakarta: Andi, 2009.
[4] B. Sarwar, G. Karypis, J. Konstan and J. Riedl, "Item-Based Collaborative Filtering Recommendation Algorithms," Proceeding of 10th International World Wide Web Conference, 2001.
[5] H. Bossenbroek and H. Gringhuis, "recommendation in e-commerce," 2016.
[6] L. Daniel and M. Anna, Slope One Predictor for Online Rating-Based Collaborative Filtering, California: Universite du Quebee, 2005.
[7] M. Hiralall, "Recommender System for e-shops,"
Bussiness Mathematics and Informatics Paper,
2011.Kursor, vol. 3, p. 1, 2007.
[8] S. K. J. D. Neeta D, Implementation of LSB steganography and Its Evaluation for Various Bits, Bangalore: IEEE, 2006.
[9] Sibero and F. Alexander, Kitab Suci Web Programming, Yogyakarta: MediaKom, 2011. [10] W. I. Survyana, Mesin rekomendasi film
menggunakan metode kemiripan genre berbasis collaborative filtering, Surabaya, 2017.