Physics and Astronomy Publications
Physics and Astronomy
2013
Atomistic modeling of the directed-assembly of
bimetallic Pt-Ru nanoclusters on
Ru(0001)-supported monolayer graphene
Yong Han
Iowa State University, [email protected]
Albert K. Engstfeld
Ulm UniversityR. Juergen Behm
Universität UlmJames W. Evans
Iowa State University, [email protected]
Follow this and additional works at:
http://lib.dr.iastate.edu/physastro_pubs
Part of the
Biological and Chemical Physics Commons
The complete bibliographic information for this item can be found athttp://lib.dr.iastate.edu/physastro_pubs/189. For information on how to cite this item, please visithttp://lib.dr.iastate.edu/howtocite.html.
Atomistic modeling of the directed-assembly of bimetallic Pt-Ru
nanoclusters on Ru(0001)-supported monolayer graphene
Abstract
The formation of Pt-Ru nanoclusters (NCs) by sequential deposition of Pt and Ru on a periodically rumpled
graphene sheet supported on Ru(0001) is analyzed by atomistic-level modeling and kinetic Monte Carlo
simulations. The “coarse-scale” periodic variation of the adsorption energy of metal adatoms across the
graphene sheet directs the assembly of NCs to a periodic array of thermodynamically preferred locations. The
modeling describes not only just the NC densities and size distributions, but also the composition
distribution for mixed NCs. A strong dependence of these quantities on the deposition order is primarily
related to different effective mobilities of Pt and Ru on the supported graphene.
Disciplines
Biological and Chemical Physics
Comments
The following article appeared in
Journal of Chemical Physics
138,13 (2013): 134703 and may be found at
doi:
10.1063/1.4798348
.
Rights
Copyright 2013 American Institute of Physics. This article may be downloaded for personal use only. Any
other use requires prior permission of the author and the American Institute of Physics.
Atomistic modeling of the directed-assembly of bimetallic Pt-Ru nanoclusters on
Ru(0001)-supported monolayer graphene
Yong Han, Albert K. Engstfeld, R. Juergen Behm, and James W. Evans
Citation: The Journal of Chemical Physics 138, 134703 (2013); doi: 10.1063/1.4798348 View online: http://dx.doi.org/10.1063/1.4798348
View Table of Contents: http://scitation.aip.org/content/aip/journal/jcp/138/13?ver=pdfcov
Published by the AIP Publishing
Articles you may be interested in
Investigation of nano Pt and Pt-based alloys electrocatalysts for direct methanol fuel cells and their properties
AIP Advances 4, 031340 (2014); 10.1063/1.4869617
Self-assembly of C60 monolayer on epitaxially grown, nanostructured graphene on Ru(0001) surface
Appl. Phys. Lett. 100, 013304 (2012); 10.1063/1.3673830
Schottky barrier height behavior of Pt–Ru alloy contacts on single-crystal n-ZnO
J. Appl. Phys. 107, 103714 (2010); 10.1063/1.3427562
Structural and magnetic properties of X 12 Y (X, Y = Fe , Co, Ni, Ru, Rh, Pd, and Pt) nanoalloys
J. Chem. Phys. 132, 184507 (2010); 10.1063/1.3427292
On the phase identification of dc magnetron sputtered Pt–Ru alloy thin films
THE JOURNAL OF CHEMICAL PHYSICS138, 134703 (2013)
Atomistic modeling of the directed-assembly of bimetallic Pt-Ru
nanoclusters on Ru(0001)-supported monolayer graphene
Yong Han,1Albert K. Engstfeld,2R. Juergen Behm,2and James W. Evans1,3 1Department of Physics and Astronomy, Iowa State University, Ames, Iowa 50011, USA 2Institute of Surface Chemistry and Catalysis, Ulm University, D-89069 Ulm, Germany 3Ames Laboratory - USDOE, Iowa State University, Ames, Iowa 50011, USA
(Received 19 December 2012; accepted 13 March 2013; published online 1 April 2013)
The formation of Pt-Ru nanoclusters (NCs) by sequential deposition of Pt and Ru on a periodically rumpled graphene sheet supported on Ru(0001) is analyzed by atomistic-level modeling and kinetic Monte Carlo simulations. The “coarse-scale” periodic variation of the adsorption energy of metal adatoms across the graphene sheet directs the assembly of NCs to a periodic array of thermodynam-ically preferred locations. The modeling describes not only just the NC densities and size distribu-tions, but also the composition distribution for mixed NCs. A strong dependence of these quantities on the deposition order is primarily related to different effective mobilities of Pt and Ru on the sup-ported graphene.© 2013 American Institute of Physics. [http://dx.doi.org/10.1063/1.4798348]
I. INTRODUCTION
Bimetallic nanoclusters (NCs) can exhibit enhanced functionality compared to single-component NCs for applica-tions such as catalysis.1–3 Specifically, bimetallic Pt-Ru
nan-oclusters and nanoparticles are of interest due to their high activity for the oxidation of methanol and other small organic molecules, e.g., in polymer electrolyte fuel cells.4,5However, in these real catalysts, it is hard to assess the origin of the catalytic activity, thus prompting analysis of model catalyst systems of the type considered here. Our focus is on the for-mation of bimetallic NCs by deposition on well-characterized surfaces at lower temperatures (T). This choice of forma-tion pathway has the appealing feature that one can access a large phase space of far-from-equilibrium structures,6–8
po-tentially allowing greater tuning of properties. In part moti-vated by these possibilities, a few studies have explored core-ring structures of two-dimensional (2D) epitaxial bimetallic NCs,9–11 systems for which predictive atomistic-level
mod-eling of NC structure formation is becoming viable.11 A greater number of studies have examined the formation of 3D bimetallic NCs by deposition on a variety of substrates includ-ing Al2O3,12–14 TiO2,15,16 Ni3Al(111),17 and NaCl,18
some-times finding core-shell structures. In all these cases, there is little control over the NC location which is determined by ei-ther stochastic homogeneous nucleation or by heterogeneous nucleation at generally randomly located defects or traps.
However, one strategy for control of the NC spatial loca-tion (which in turn impacts the NC size distribuloca-tion), and also for stabilization of smaller NC sizes, is directed-assembly of NCs by metal deposition on templated substrates. In a num-ber of recent studies, the template has been provided by a pe-riodically rumpled monolayer of graphene (MLG) supported on a metal surface. Typically, a single type of metal is de-posited to create single-component NCs.19–26 However, lim-ited studies of sequential deposition of two metals have also been performed. N’Diayeet al.20 deposited first a high cohe-sive energy metal on MLG/Ir(111) which forms a perfect
pe-riodic array of NCs. This pepe-riodic array seeded the formation of perfect arrays of mixed NCs by subsequent deposition of a low cohesive energy metal (which in the absence of the seeds would form imperfect arrays or 2D layers). Engstfeldet al.27
explored the role of the deposition order on the NC structure for mixed Pt-Ru NCs on MLG/Ru(0001). There has been little atomistic-level modeling of the formation of 3D NCs, partic-ularly for directed-assembly. Our goal is to develop and apply such modeling for the Pt-Ru on MLG/Ru(0001) system, fo-cusing on the kinetics and spatial aspects of NC formation and the bimetallic NC size, height, and composition distribu-tions. Our modeling is not designed to capture the details of NC structure.
In Sec.II, we provide some brief background on the ex-perimental setup, on the structure of supported monolayers of graphene on Ru(0001), and on experimental results for depo-sition of Pt and Ru on MLG/Ru(0001). SectionIIIprovides a review of density functional theory (DFT) results for the energetics of these adsorption systems, and a description of our atomistic-level modeling of NC formation. In Sec. IV, we present “benchmark” modeling of single-component de-position of just Pt and of just Ru on MLG/Ru(0001). Then, detailed modeling of sequential deposition of Pt then Ru (Ru@Pt) is presented in Sec.V. The corresponding analysis of sequential deposition of Ru then Pt (Pt@Ru) is presented in Sec.VI. Conclusions are provided in Sec.VII.
II. BACKGROUND: EXPERIMENT FOR NC FORMATION ON MLG/Ru(0001)
A. Experimental setup
A detailed description of the experimental setup and pro-cedure for sample preparation have been provided in previous publications26,27for pure Ru as well as bimetallic PtRu cluster growth on MLG supported on Ru(0001). In brief, the experi-ments were performed in an ultrahigh vacuum chamber with a base pressure of 1×10⁻¹⁰mbar. The Ru(0001) surface was
134703-2 Hanet al. J. Chem. Phys.138, 134703 (2013)
sputtered with Ar+ions and cleaned with cycles of heating to 1600 K. Remaining carbon impurities were removed by cy-cles of oxygen adsorption and subsequent heating to 1500 K. The supported graphene layer was prepared by decomposi-tion of ethylene at 1000 K. Subsequently, the metals were deposited using an electron beam evaporator. The arrays of metal NCs which self-assemble on the supported MLG sur-faces were investigated at room temperature with a home-built pocket-size scanning tunneling microscopy (STM), using tun-neling currents of 40 pA–100 pA and voltages of 1 V–2 V. For analysis of NC distributions for each choice of deposition condition, several STM images were recorded and evaluated using in-house software for statistical analysis of, e.g., the lat-eral and height distribution of the NCs. A more detailed de-scription of the analysis of NC height distributions is provided in AppendixA.
B. Structure of MLG on Ru(0001) and directed-assembly of metal NCs
A MLG supported on Ru(0001) exhibits a periodically rumpled moiré structure due to lattice mismatch (with a moiré cell area of∼7.7 nm2).28,29 This MLG is often described by
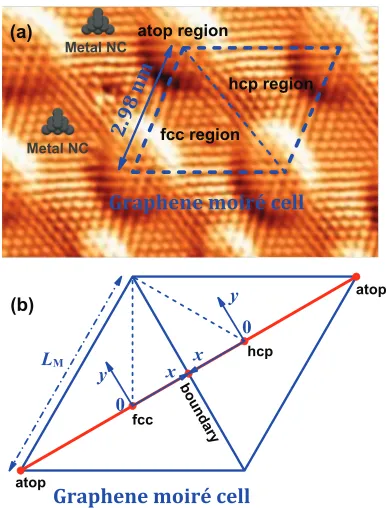
a (12×12)C/(11×11)Ru structure model. It is useful to de-fine the fcc, hcp, and atop regions of the moiré cell for which the center of the C-rings in the graphene layer is above the fcc, hcp, and atop sites of the underlying Ru(0001) substrate, respectively. As a result of this moiré structure, the adsorption and diffusion properties of deposited metals are correspond-ingly modulated which can result in directed-assembly. Most often, preferential nucleation and growth of metal NCs oc-curs in the so-called fcc region of the moiré cell,19–26see Fig.
1. This scenario applies in this study, and is believed to reflect preferred adatom binding or adsorption in those regions.
In systems where there is negligible transport of adatoms between moiré cells during deposition, a NC is quickly formed in the fcc region of every cell.19 However, active
transport between cells allows for fractional population, FF
<100%, of moiré cells even for significant coverages,θ, of deposited materials. Here, FF is termed the “filling factor” and is given as a fraction or percentage of moiré cells pop-ulated by NCs. Also, a coverage of θ =1 monolayer (ML) is defined to correspond to one adatom for every Ru(0001) surface atom. Analysis of the FF can provide insight into sur-face transport and also into the NC formation process.26 In
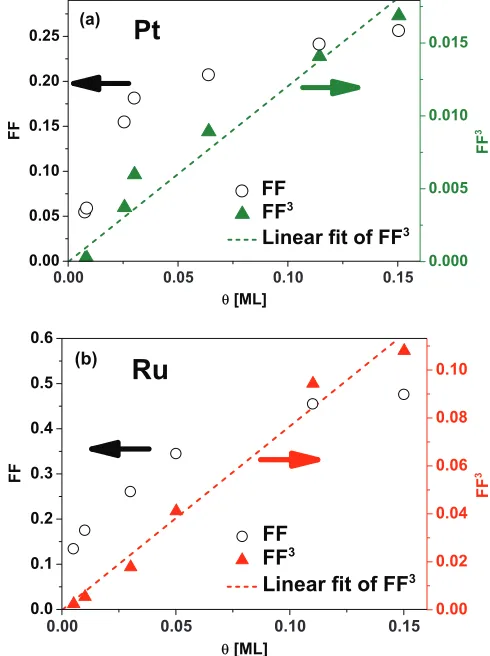
Fig.2, the behavior of FF versusθis compared for deposition of Pt and Ru on MLG/Ru(0001) just above room tempera-ture. We make three key observations: (i) the FF values are well below the maximum implying facile transport between moiré cells and across the surface for tens of nm; (ii) the FF for Pt is significantly below that for Ru for roughly the same amount of deposited material, corresponding to a higher ef-fective mobility as clarified in Sec. IV A; (iii) one finds an approximate proportionality FF3∝θ, so that FF∝θ1/3.
[image:5.612.340.533.48.302.2]Typ-ically, for nucleation and growth of NCs on flat surfaces, one does not have such simple scaling of the NC density. How-ever, below we discuss why simple scaling is enhanced for directed-assembly, and explain why observed behavior is the signature of irreversible nucleation and growth of NCs.7,30
FIG. 1. Schematics showing various regions within the MLG/Ru(0001) moiré cell: (a) superimposed on an STM image of MLG. Reprinted with per-mission from A. L. V. de Parga, F. Calleja, B. Borca, M. C. G. Passeggi, Jr., J. J. Hinarejos, F. Guinea, and R. Miranda, Phys. Rev. Lett.100, 056807 (2008). Copyright 2008 American Physical Society; (b) Indicating the coor-dinate system used to describe the adsorption energy below.
III. BACKGROUND: THEORY, MODELING FOR NC FORMATION ON MLG/Ru(0001)
A. DFT analysis of energetics
Next, we briefly discuss available DFT results for the interaction of Pt and Ru adatoms with freestanding MLG and with supported MLG/Ru(0001). The adsorption energy of a Pt (Ru) adatom on freestanding MLG has the value
∼ −1.6 eV (−2.0 eV) and the diffusion barrier has the value
∼0.17 eV (0.62 eV).26,31 Thus, the interaction of Pt with
graphene is somewhat weaker than that of Ru. There also ex-ist DFT results for the adsorption energy (Eads) in preferred
fcc region for these metals on supported MLG/Ru(0001):
∼ −2.8 eV for Pt versus −2.6 eV for Ru.32 No DFT
134703-3 Hanet al. J. Chem. Phys.138, 134703 (2013)
FIG. 2. Experimental data for the filling factor (FF) versus coverage θ: (a) Pt deposition on MLG/Ru(0001) atT=309 K; (b) Ru deposition on MLG/Ru(0001) atT=305 K. Plots show that FF3is roughly proportional to θ. Deposition fluxesFare in the range 0.01–0.1 ML/min.
B. Potential energy surface for adsorption of metals on MLG/Ru(0001)
Atomistic modeling requires specification of the potential energy surface describing the lateral variation of the adsorp-tion energy,Eads, for an isolated adatom. One has well-defined
local adsorption sites in each carbon ring with separation a∼0.25 nm. Consequently, this potential energy surface in-cludes a short-range highly oscillatory variation on a length scale ∼a, and also a coarse-scale modulation on the length scale of the moiré cell LM = 2.98 nm. A schematic of the
behavior of this surface is shown in Fig. 3, where it should be noted that adsorption is strongest at the center of the fcc region. Adsorption in the center of the hcp region, the fcc-hcp boundary, and the atop regions are weaker by,δ, and
δ +δ*, respectively. The explicit form used for the poten-tial energy surface consistent with this behavior is provided in Ref.26. Motivated by DFT analysis of Sutter et al.25 for Ru/MLG/Ru(0001), we will set=δ andδ* =0 for both Ru and Pt, thereby imposing a uniform adsorption energy over the entire hcp half of the moiré cell which is weaker than that in the fcc region. The local activation barrier,Ed(i→ f), for
biased diffusion (i.e., hopping) from an initial siteito a neigh-boring final site f is chosen asEd(i→ f) ≈Ed0 + [Eads(f) − Eads(i)]/2, where Ed0 is an upward shift of the
tran-sitional state energy (red dashed curve) from the
adsorp-FIG. 3. 1D schematic of the form of the variation of the adsorption en-ergy,Eads, across the MLG/Ru(0001) moiré cell (shown in Fig.1(b)) which
was incorporated into our model. The fine-scale variation is shown by a highly oscillatory thin curve. The 2D coarse variation of the adsorp-tion energy at adsorpadsorp-tion sites (green dashed curve) is described byEads
=δsin2(π√3x/LM)+δ∗sin2(πy/LM) in the small triangle corresponding
to 1/6 of the fcc half moiré cell withx- andy-axes shown in Fig.1(b), and by Eads=+(δ−) sin2(π
√
3x/LM)+δ∗sin2(πy/LM) in 1/6 of the hcp
half moiré cell. The adsorption energy at the transition state for hopping be-tween adsorption sites,ETS(red dashed curve), is assumed to be elevated
above these values by a fixed amount,Ed0.
tion site energy (green dashed curve), see Fig. 3. Hop rates, r, are selected to have the Arrhenius form r(i→f)
=νe−Ed(i→f)/(kBT) where the common prefactor ν =1013/s
andkBis the Boltzmann constant. This form is consistent with
detailed-balance.
C. Atomistic lattice-gas modeling
Our atomistic lattice-gas model includes: (i) random de-position at adsorption sites on the substrate; (ii) biased hop-ping between adjacent adsorption sites with activation barri-ers,Ed(i→ f), and Arrhenius hop rates,r, controlled by the
modulated potential energy surface as specified above; and (iii) irreversible nucleation and growth of NCs. The model is readily adapted to treat deposition of a single type of atom or sequential (or simultaneous) deposition. In addition, a “point island” model33,34 is utilized which tracks only NC size and composition, but not structure. Specifically, in this model, each NC occupies a single adsorption site, but carries size la-bels to indicate the number of atoms of various types within the NCs. These point models have proved particularly effi-cient and effective in elucidating the behavior in various de-position systems of NC densities (corresponding here to fill-ing fraction, FF), and NC size distributions. Here, we utilize kinetic Monte Carlo (KMC) simulation to assess model pre-dictions for these quantities, and also for the composition dis-tribution of mixed islands. In this work, the simulation cell size is always taken to be 100×100 moiré cells with periodic boundary conditions. In certain cases, we have compared re-sults for multiple simulations in order to check that we have sufficiently accurate statistics for quantities of interest.
Point island model behavior is not impacted by lateral growth and coalescence of NCs. As a result, such models produce clear and simple scaling of NC density or FF with coverage of the formθ1/(i+2)whereidenotes the critical size
(in atoms) above which NCs are stable.7,30 Thus, point
[image:6.612.317.557.54.164.2]134703-4 Hanet al. J. Chem. Phys.138, 134703 (2013)
FIG. 4. Dependence of FF on basic model parameters,Ed0and=δ. A
contour is shown for constant FF=0.21 in theEd0-plane evaluated for
T=307 K, fluxF=0.034 ML/min, andθ =0.05 ML. The direction of greatest increase of FF is also shown.
the simple scaling of the type mentioned above should be manifested, and experimental observations thus correspond to i=1, i.e., irreversible NC formation.
For irreversible NC formation of uniform substrates, the FF scales like the inverse third power of the surface diffusiv-ity. Thus, even for the systems of interest here with a tem-plated substrate, lower values of the FF should correspond to a longer range or higher effective mobility. This effective mobility is some nontrivial combination of our model param-eters, Ed0 and, but it must clearly increase with both
de-creasingEd0 and decreasing. Figure4illustrates this
fun-damental dependence on model parameters.
IV. BENCHMARK MODELING: Pt ON MLG/Ru(0001) VERSUS Ru ON MLG/Ru(0001)
A. FF analysis
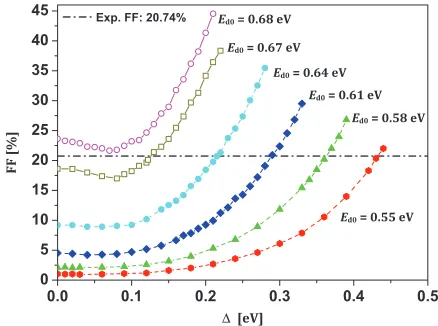
We select model parameters to match experimental val-ues reported in TableIfor FF=20.7% (30.5%) for deposi-tion on MLG/Ru(0001) of 0.05 ML of Pt (Ru) atT=307 K (305 K) with a flux F = 0.034 ML/min (0.042 ML/min). (These experiments correspond to the first stage of the se-quential deposition studies described in Secs.VandVI.) We can match the behavior for Pt by choosing the model pa-rameters (Ed0, ) as (0.55, 0.43) or (0.58, 0.36) or (0.61,
0.29) or . . . with values in eV. This is illustrated in Fig.
5, which gives also a more comprehensive picture of the dependence of FF on for various Ed0, and of parameter
[image:7.612.66.284.49.214.2]choices which are consistent with the experimental value for Pt (also see Fig. 4). Similarly, we can match the FF value
FIG. 5. Dependence of FF on =δ for variousEd0. Other parameters:
F=0.034 ML/s,T=307 K,θ=0.05 ML. The horizontal line denotes the experimental FF value for Pt. The non-monotonic increase of FF for small values of decreasing(evident for largerEd0) corresponds to the onset of
NC nucleation in hcp regions (as well as in fcc regions).
for Ru by choosing (Ed0,) as (0.55, 0.46) or (0.58, 0.38)
or (0.61, 0.31) or . . . with values in eV. Thus, we cannot determine a unique choice of parameters to match the ex-periment without extra information, such as that provided by our DFT estimate of Ed0 for Ru. However, it is clear
that the effective mobility of Pt exceeds that of Ru (corre-sponding to a lower FF for deposition with similar T and F). In subsequent modeling, we will select (Ed0 =0.55 eV, = δ = 0.43 eV) for Pt, and (Ed0 = 0.58 eV, = δ =0.38 eV) for Ru.
B. NC size and height distribution
The average NC size is determined fromsav≈121θ/FF
(withsav in atoms, θ in ML, and FF as a fraction), given a
negligible fraction of isolated diffusing adatoms. Thus, in the deposition studies described above, Pt NCs are on average roughly 50% larger than the Ru NCs due to the smaller FF for Pt. Our KMC simulations also determine the NC size dis-tributions, which have the classic mono- or unimodal form ex-pected for irreversible island formation by homogeneous nu-cleation on ideal (non-templated) surfaces,7 see Secs.Vand
VI. Thus, the periodic modulation of the PES on a length scale LMdoes not much affect the size distribution for the current
experimental conditions.
The NC height distribution was also determined from the experimental data, as described in Appendix A. Re-sults are reported in Table I, which gives the filling frac-tion, FF(h), for NCs with specific heights h = 1, 2, 3, . . . (in unit of atomic layers), so that FF = h ≥1 FF(h). To
TABLE I. Experimental data for FF and FF(h) for pure Pt, pure Ru, and mixed Pt-Ru NCs. The NC heighth=1, 2, 3, . . . (in unit of layers).
Metal F(ML/min) T(K) θ(ML) FF (%) FF(1) (%) FF(2) (%) FF(3) (%) FF(4) (%) FF(5) (%) FF(6) (%)
Pt 0.0340 307 0.050 20.74 1.85 11.94 6.93 0.00 0.00 0.00
Ru@Pt 0.0420 300 0.110 41.67 6.39 14.41 9.15 10.70 0.99 0.00
Ru 0.0420 305 0.050 30.51 3.48 15.25 11.55 0.21 0.00 0.00
134703-5 Hanet al. J. Chem. Phys.138, 134703 (2013)
elucidate the observed behavior, we suppose that there exist fairly well-defined threshold sizes (measured in number of atoms),Sh→h+1, at which the NC makes a transition fromhto
h+1 in height. Thus, a NC withSh→h+1atoms is the
small-est NC of height h +1. We adjust the Sh→h+1, subject to
reasonable physical constraints, to fit experimental observa-tions. We expect that NCs have a hcp arrangement of atoms in each layer with 3-fold hollow adsorption sites. Note that for fcc stacking, the minimum possible thresholds for a sta-ble NC which requires a nearest-neighbor pair of adatoms (a triangle of adatoms) in the top layer areSh→h+1=7, 16, 30,
50, 77, . . . (Sh→h+1 =9, 19, 34, 55, 83, . . . ) forh=1, 2, 3,
. . . . For hcp stacking,S1→2 is unchanged, and otherSh→h+1
are slightly higher:Sh→h+1=7, 17, 33, . . . (Sh→h+1=9, 20,
36, . . . ) if a stable NC requires a nearest-neighbor pair (a tri-angle) in the top layer. To fit the experimental data, we can setSh→h+1 =9, 38, 70, . . . forh =1, 2, 3, . . . for Pt, and
Sh→h+1 =7, 25, 60, . . . for Ru (cf. Ref.26). Our
compari-son with experimental results for FF(h) will be presented in Secs.VandVI. From these thresholds, the transition toh=3 and higher layer clusters requires a larger than minimum pos-sible number of atoms (corresponding to larger, wider clusters than the minimal pyramid). Still, the transition to 3D island growth is still more facile than for Ir on MLG/Ir(111).35
V. SEQUENTIAL DEPOSITION: Pt THEN Ru (Ru@Pt) ON MLG/Ru(0001)
A. FF analysis
Pt has a higher effective mobility than Ru, and thus a lower FF for deposition under similar conditions. Thus, one expects that for sequential deposition of 0.06 ML Ru follow-ing that of 0.05 ML Pt, the NC density should significantly increase in the second stage of deposition due to nucleation of new smaller pure Ru NCs. This feature is also clear in the chemically resolved size and height distributions presented in Sec. V B. These second stage pure Ru NCs should form at locations which according to nucleation theory7,30tend to be
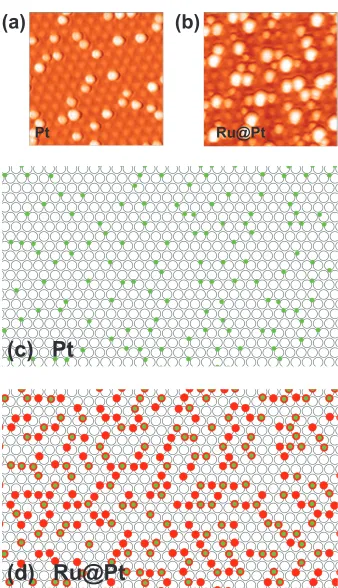
further separated from existing Pt NCs. Indeed, experimental results in Figs.6(a) and6(b) and TableI reveal that the FF doubles from 20.7% to 41.7%. Thus, roughly half the final NCs are pure Ru NCs and half are mixed Ru@Pt NCs formed by aggregation of Ru with the Pt NCs formed in the first stage. Since extended Pt(111) surfaces are susceptible to Ru inter-mixing above 370 K, it is plausible that these mixed Ru@Pt NCs do not have a perfect “Pt core +Ru shell” structure.27
Our model with energetic parameters unchanged from Sec.III
is quite successful in recovering observed behavior. This is clear from comparing Figs.6(a)and6(b)with Figs.6(c)and
6(d)and from comparing TableIwith TableII.
B. NC size, composition, and height distributions
Since our modeling allows complete chemical resolution of mixed NCs formed during deposition, it can provide addi-tional insight relative to experimental observations which lack such resolution. Figure7(a)shows various size distributions for NCs predicted by the model where the NC size is given by
FIG. 6. (a) and (b) STM images of NC distributions for Pt deposition fol-lowed by Ru deposition (Ru@Pt) under conditions described in the text. Im-age size: 35×35 nm2. (c) and (d) KMC simulation of NC distributions for Pt deposition followed by Ru deposition (Ru@Pt) under conditions described in the text. Image size: 89×53 nm2. Pure Pt (Ru) NCs are green (red), and
mixed NCs have a green core and red ring.
the total number of atoms: the size distributions for Pt NCs formed during the first Pt deposition (cf. Sec. IV A) which has the classic shape for irreversible island formation;7
sepa-rate size distributions for the mixed NCs and the pure Ru NCs formed in the second stage of deposition. Since many small pure Ru NCs are formed in the second stage and the existing Pt NCs grow significantly by addition of Ru, the final overall size distribution is bimodal.
[image:8.612.352.521.45.339.2]In Fig.7(b), we show the joint probability distribution for mixed NCs, i.e., NC population as a function of the number of constituent Pt and Ru atoms. The reduced distribution of Ru atoms in these mixed NCs is obtained by summing the joint distribution over the number of Pt atoms (for various
TABLE II. Results from KMC simulations for FF mimicking the experi-mental deposition procedure. The top two rows describe the deposition first of Pt followed by that of Ru (Ru@Pt). The bottom five rows describe the deposition first of Ru followed by that of Pt (Pt@Ru). Actually for Pt@Ru, in both experiment and KMC simulation, the initial deposition of Ru was performed in increments: the first 0.030 ML deposited at a lower flux of 0.0085 ML/min, and the last 0.012 ML at the higher flux given in the table.
Metal F(ML/min) T(K) θ(ML) FF (%)
Pt 0.0340 307 0.050 20.36
Ru@Pt 0.0420 300 0.110 40.83
Ru 0.0420 305 0.050 28.59
[image:8.612.315.558.674.749.2]134703-6 Hanet al. J. Chem. Phys.138, 134703 (2013)
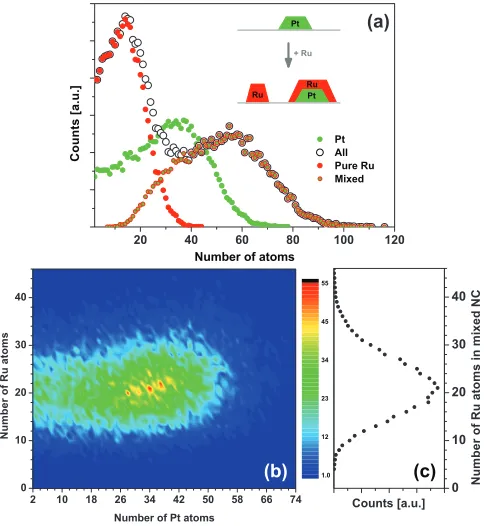
FIG. 7. Ru@Pt deposition process. (a) Size distributions for the Pt NCs after Pt deposition, and both pure Ru and mixed NCs after Ru deposition. Inset: schematic of NC formation. (b) Joint probability distribution for mixed NCs with various numbers of Pt and Ru atoms. Red (blue) denotes higher (lower) population as indicated in the scale. (c) Distribution of Ru atoms in mixed NCs.
fixed numbers of Ru atoms). This reduced distribution is fairly sharply peaked about the average, see Fig. 7(c). This might be expected since this distribution of the number of Ru atoms should reflect the “capture zone” area distribution for the Pt NCs.7,36 Such area distributions are expected to have a gen-eralized Gamma form,37which is narrow compared to classic size distributions for irreversible island formation.7One com-plication is that the capture zones for Pt and mixed NCs are modified by the nucleation of new Ru NCs.
The experimental NC height distribution is reasonably re-covered from the above NC size distribution by choosing for mixed Ru@Pt NCs the height cutoffsSh→h+1 =7 or 9, 34,
46, 74, . . . forh =1, 2, 3, 4, . . . . Actually, since there are no mixed NCs forh=1, the results are insensitive toS1→2.
Here, we have consistently chosen the same cutoffs as in Sec.IIIfor pure Ru NCs, see Fig.8. Note that the mixed NC cutoffs are smaller than those for pure Pt NCs, i.e., it is eas-ier to form taller mixed NCs. This may indicate a stronger thermodynamic preference for Ru to climb to higher layers relative to Pt, perhaps due to the higher cohesive energy of Ru. Potentially, the feature thatS3→4is not far aboveS2→3is
due to the possibility to form small bilayer Ru NCs on top of the large number of previously formed bilayer Pt NCs.
Significantly, this proposal for the facile formation of bi-layer Ru islands on the top (111)-facetted surface of Pt NCs is entirely consistent with previous experimental observations for Ru deposition on Pt(111): bilayer Ru islands were found to form readily during deposition at room temperature of Ru
FIG. 8. NC height distributions FF(h): (a) Experimental distribution after Pt and after Ru@Pt deposition. (b) Corresponding KMC results where in bars for Ru@Pt indicate separate contributions from mixed and pure Ru NCs.
on extended Pt(111) single-crystal surfaces,38 and on Pt(111) monolayers supported on Ru(0001).39
VI. SEQUENTIAL DEPOSITION: Ru THEN Pt (Pt@Ru) ON MLG/Ru(0001)
A. FF analysis
Deposition of Ru produces a high FF compared to Pt, so one expects that sequential deposition of 0.05 ML Ru and then 0.06 ML Pt should not significantly increase the NC density above that from the Ru deposition. Such an increase would require nucleation of a significant number of new pure Pt NCs. Indeed, experimental results in Figs.9(a)and9(b)and TableIreveal that the FF increases only slightly from 30.5% to 35.0%. Thus, most of the final NCs are mixed Pt@Ru NCs formed by aggregation of Pt with the smaller Ru NCs formed in the first stage. This feature is also clear in the chemically-resolved size and height distributions presented in Sec.VI B. Since extended Ru(0001) surfaces are resistant to Pt inter-mixing, these NCs likely have a perfect “Ru core+Pt shell” structure.27 Our model with energetic parameters unchanged
from Sec.IIIis quite successful in recovering the observed be-havior. Compare Figs.9(c)and9(d)with Figs.9(a)and9(b), and compare TableIwith TableII.
B. NC size, composition, and height distributions
[image:9.612.55.298.50.313.2]134703-7 Hanet al. J. Chem. Phys.138, 134703 (2013)
FIG. 9. (a) and (b) STM images of NC distributions Ru deposition followed by Pt deposition (Pt@Ru) under conditions described in the text. Image size: 35×35 nm2. (c) and (d) KMC simulation of NC distributions Ru deposition followed by Pt deposition (Pt@Ru) under conditions described in the text. Image size: 89×53 nm2. Pure Ru (Pt) NCs are red (green), and mixed NCs
[image:10.612.91.260.47.325.2]have a red core and green ring.
[image:10.612.325.547.48.217.2]FIG. 10. Pt@Ru deposition process. (a) Size distributions for Ru NCs after Ru deposition; and both pure Pt and mixed NCs after Pt deposition. Inset: schematic of NC formation. (b) Joint probability distribution for mixed NCs with various numbers of Pt and Ru atoms. Red (blue) denotes higher (lower) population as indicated in the scale. (c) Distribution of Pt atoms just in mixed NCs.
FIG. 11. NC height distributions, FF(h): (a) Experimental distribution after Ru and after Pt@Ru deposition. (b) Corresponding KMC results where in bars for Pt@Ru indicate separate contributions from mixed and pure Pt NCs.
is fairly sharply peaked about the average, see Fig. 10(c), and should almost exactly correspond to the “capture zone” area distribution for the Ru NCs formed in the first stage of deposition.7,36Again, this area distribution should have a gen-eralized Gamma form.37
The experimental height distribution is reasonably recov-ered from the above size distributions by choosing for mixed Pt@Ru NCs the height cutoffsSh→h+1 =7 or 9, 20, 42, 56,
77, . . . forh=1, 2, 3, 4, 5, . . . (where again no mixed NCs forh=1 implies insensitivity toS1→2). Here, we have
consis-tently chosen the same cutoffs as in Sec.IIIfor pure Pt NCs. This is illustrated in Fig.11, which shows that essentially all NCs withh=1 and 2 are pure Pt, and essentially all mixed NCs haveh≥3. Note that the mixed NC cutoffs are smaller than those for pure Pt or pure Ru NCs or for mixed “Pt core
+Ru shell” NCs. Presumably, this reflects a stronger driving force for 3D cluster growth than for pure Pt or Ru NCs (or for mixed quasi “Ru core+Pt shell” NCs). This, in turn, reflects the large cohesive energy for Pt and a large adsorption energy for Pt on hcp Ru surfaces, see AppendixB.
VII. CONCLUSIONS
Our atomistic-level modeling of directed-assembly of bimetallic Pt-Ru NCs by sequential deposition on MLG/Ru(0001) is effective at describing not only just the NC densities (or filling fractions), and the size and height distributions, but also the composition distribution for mixed NCs. The latter quantities cannot be readily obtained from experiment. Our analysis also provides a quantitative assess-ment of the different effective mobilities of Pt and Ru on MLG/Ru(0001), and also the ease for formation of various 3D NCs.
ACKNOWLEDGMENTS
[image:10.612.55.297.425.683.2]DE-AC02-134703-8 Hanet al. J. Chem. Phys.138, 134703 (2013)
07CH11358. A.E. and R.J.B. were supported for related ex-perimental studies by the Baden-Württemburg-Stiftung via the competence network “Functional Nanostructures” and the DFG via Research Group 1376 (Be 1201/18-1). A.E. is grate-ful for a fellowship from the Fonds National de la Recherche Luxembourg (PHD09-13). A.E. and R.J.B. thank Christoph D. Lorenz for help with the experimental studies.
APPENDIX A: EXPERIMENTAL ANALYSIS OF NC HEIGHT DISTRIBUTIONS
Discrete atomic-layer NC height distributions were de-termined from the experimental STM data using the follow-ing procedure. First we planarize the STM images and col-lect (quasi-continuous) height-distribution data over a single terrace which does not include any step edges. The typical image size is 150 ×150 nm2. The height distribution
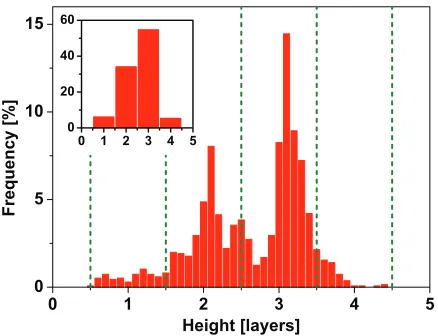
[image:11.612.66.285.547.715.2]usu-ally shows a multi-peak structure indicating preferences for specific discrete atomic layer heights. To obtain better statis-tics (particularly for lower coverages, and thus lower num-bers of NCs), we combine data from a few images after suit-ably aligning the peaks. Next, the quasi-continuous height, h, is transformed into units of atomic layers, where each layer corresponds to the step height for hcp Ru on Ru(0001) of 2.14 nm. For convenience, we use this single value of the step height when analyzing height distributions for pure Ru NCs, for mixed Ru-Pt NCs, and for pure Pt NCs. (Note that the step height for fcc Pt on Pt(111) is 2.26 nm, close to the above value.) Integer values of h are then suitably as-signed to the peaks in the distribution. An example of a quasi-continuous height distribution for pure Ru NCs with a Ru cov-erage of 0.12 ML and a FF of 47%, which is obtained from this procedure, is shown in Fig. 12. Finally, we sum up the population of the quasi-continuous height distribution for all heightshin a range ofn±0.5, with integerncorresponding to a specific atomic layer height. (These ranges are shown in Fig.12delineated with dashed green vertical lines). The re-sulting discrete height distribution in atomic layers is shown in the insert.
FIG. 12. Quasi-continuous and corresponding discrete atomic-layer height distributions for pure Ru NCs with a Ru coverage of 0.12 ML and a FF of 47%.
The appearance in the STM data of a quasi-continuous height distribution (versus sharp discrete peaks) is not surpris-ing. This feature was found for size-selected Pd clusters de-posited on MLG/Ru(0001).40It is even found for “mounded” morphologies for rough multilayer growth in simple ho-moepitaxial metal systems.41Origins of the quasi-continuous
distribution include: (i) slow response of the laterally scan-ning tip to the local morphology; (ii) convolution of a broad tip profile with the local height distribution; (iii) differing lo-cal density of states for clusters with the same height but dif-ferent shapes, etc. One caveat is that there is no simple unique way to reliably extract a discrete height distribution from the observed continuous distribution.
APPENDIX B: THERMODYNAMICS FOR PURE AND MIXED 3D NC GROWTH
For the growth of pure single-component metal NCs, 3D growth is favored if the pure metal surface energy exceeds the adhesion energy for slabs of that metal on MLG/Ru(0001). We cannot readily calculate this adhesion energy, so in-stead we explore two simpler approximate assessments or analyses. First, although the surface energy of the metal should be compared to the above adhesion energy, one might also note that it is significantly higher than the low sur-face energy of graphene.42 This inequality is consistent with
3D growth. Second, we compare the adsorption energy of an isolated metal adatom on the relevant metal surfaces (see Table III) with the adsorption energy of that metal on MLG/Ru(0001): −4.44 eV for Pt/Pt(111) versus −2.8 eV for Pt/MLG/Ru(0001);32 −5.49 eV for Ru/Ru(0001) versus
−2.6 eV for Ru/MLG/Ru(0001).32 The much greater magni-tude of the metal-on-metal energies is also consistent with 3D growth.
[image:11.612.316.557.678.750.2]Of particular interest and relevance here is the corre-sponding analysis for mixed NCs. Here, one also needs to calculate the adsorption energy of isolated Pt on Ru(0001) and of isolated Ru on Pt(111), see TableIII. One finds−4.14 eV for Ru/Pt(111) versus−2.6 eV for Ru/MLG/Ru(0001) in-dicating a strong driving force for 3D quasi “Pt core +Ru shell” NCs. One finds−5.61 eV for Pt/Ru(0001) versus−2.8 eV for Pt/MLG/Ru(0001) indicating an even stronger driving force for 3D “Ru core+Pt shell” NCs, which are the tallest of all the observed 3D NCs. As an aside, the experimental surface lattice constant for Pt(111) is 0.277 nm (cf. our DFT
TABLE III. DFT values of adsorption energiesEads(fcc) andEads(hcp) (in
eV) at fcc and hcp sites and their differences for an isolated Pt or Ru adatom on Pt(111) or Ru(0001) surface. Parameters for the DFT analysis using the VASP code:43–452×2 supercell, 10 ML substrate, 19×19k-mesh, updated PAW-PBE potentials.46For more computational details about DFT calcula-tions of adsorption energy, see our previous work.47
System Eads(fcc) Eads(hcp) Eads(hcp)−Eads(fcc)
Pt/Pt(111) −4.437 −4.264 0.173
Ru/Pt(111) −4.138 −4.023 0.115
Ru/Ru(0001) −5.030 −5.486 −0.457
134703-9 Hanet al. J. Chem. Phys.138, 134703 (2013)
value of 0.2807 nm), and for Ru(0001) it is 0.271 nm (cf. our DFT value of 0.2714 nm), so there should be little strain due to metal lattice mismatch in these 3D mixed NCs.
1J. H. Sinfelt,Bimetallic Catalysts: Discoveries, Concepts, and Applications
(Wiley, New York, 1983).
2A. Gross,Top. Catal.37, 29 (2006).
3X. Liu, D. Wang, and Y. Li,Nanotoday7, 448 (2012).
4M. Watanabe and S. Motoo,J. Electroanal. Chem.60, 267 (1975). 5O. A. Petrii,J. Solid State Electrochem.12, 609 (2008).
6T. Michely and J. Krug,Islands, Mounds, and Atoms(Springer, Berlin,
2004).
7J. W. Evans, P. A. Thiel, and M. C. Bartelt,Surf. Sci. Rep.61, 1 (2006). 8R. Q. Hwang and M. C. Bartelt,Chem. Rev.97, 1063 (1997).
9M. C. Bartelt, A. K. Schmid, J. W. Evans, and R. Q. Hwang,Phys. Rev.
Lett.81, 1901 (1998).
10H. Brune, inHandbook of Surface Science, edited by E. Hasselbrink and
B. I. Lundqvist (Elsevier, Amsterdam, 2008), Vol. 3, Chap. 15.
11T. Duguet, Y. Han, C. Yuen, D. Jing, B. Ünal, J. W. Evans, and P. A. Thiel,
Proc. Natl. Acad. Sci.108, 989 (2011).
12M. Heemeier, A. F. Carlsson, M. Naschitzki, M. Schmal, M. Baümer, and
H.-J. Freund,Angew. Chem., Int. Ed.41, 4073 (2002).
13W. Benten, N. Nilius, N. Ernst, and H.-J. Freund,Phys. Rev. B72, 045403
(2005).
14E. Napetschnig, M. Schmid, and P. Varga,Surf. Sci.601, 3233 (2007). 15J. B. Park, J. S. Ratliff, S. Ma, and D. A. Chen,Surf. Sci.600, 2913 (2006). 16S. A. Tenney, W. He, J. S. Ratliff, D. R. Mullins, and D. A. Chen,Top.
Catal.54, 42 (2011).
17M. Marsault, G. Hamm, A. Wörz, G. Sitja, C. Barth, and C. R. Henry,
Faraday Discuss.138, 407 (2008).
18F. Giminez, C. Chapon, and C. R. Henry,New J. Chem.22, 1289 (1998). 19A. T. N’Diaye, S. Bleikamp, P. J. Feibelman, and T. Michely,Phys. Rev.
Lett.97, 215501 (2006).
20A. T. N’Diaye, T. Gerber, C. Busse, J. Mysliveˇcek, J. Coraux, and T.
Michely,New J. Phys.11, 103045 (2009).
21Y. Pan, M. Gao, L. Huang, F. Liu, and H.-J. Gao,Appl. Phys. Lett.95,
093106 (2009).
22K. Donner and P. Jakob,J. Chem. Phys.131, 164701 (2009).
23H. Zhang, Q. Fu, Y. Cui, D.-L. Tan, and X.-H. Bao,Chin. Sci. Bull.54,
2446 (2009).
24Z. Zhou, F. Gao, and D. W. Goodman,Surf. Sci.604, L31 (2010). 25E. Sutter, P. Albrecht, B. Wang, M.-L. Bocquet, L. Wu, Y. Zhu, and P.
Sutter,Surf. Sci.605, 1676 (2011).
26A. K. Engstfeld, H. E. Hoster, R. J. Behm, L. D. Roelofs, X. Liu, C.-Z.
Wang, Y. Han, and J. W. Evans,Phys. Rev. B86, 085442 (2012).
27A. K. Engstfeld, S. Beckord, C. D. Lorenz, and R. J. Behm,
ChemPhysChem13, 3313 (2012).
28B. Wang, S. Günther, J. Wintterlin, and M.-L. Bocquet,New J. Phys.12,
043041 (2010).
29A. L. V. de Parga, F. Calleja, B. Borca, M. C. G. Passeggi, Jr., J. J.
Hinare-jos, F. Guinea, and R. Miranda,Phys. Rev. Lett.100, 056807 (2008).
30J. A. Venables,Philos. Mag.27, 697 (1973).
31X. Liu, C. Z. Wang, M. Hupalo, W. C. Lu, M. C. Tringides, Y. X. Yao, and
K. M. Ho,Phys. Chem. Chem. Phys.14, 9157 (2012).
32B. Wang and M.-L. Bocquet,J. Phys. Chem. Lett.2, 2341 (2011). 33M. C. Bartelt and J. W. Evans,Phys. Rev. B46, 12675 (1992). 34M. C. Bartelt and J. W. Evans,Surf. Sci. Lett.284, L437 (1993). 35P. J. Feibelman,Phys. Rev. B80, 085412 (2009).
36P. A. Mulheran and J. A. Blackman,Philos. Mag. Lett.72, 55 (1995). 37M. Li, Y. Han, and J. W. Evans,Phys. Rev. Lett.104, 149601 (2010). 38A. Berkó, A. Bergbreiter, H. E. Hoster, and R. J. Behm,Surf. Sci.603,
2556 (2009).
39A. Bergbreiter, A. Berkó, P. M. Erne, H. E. Hoster, and R. J. Behm,Vacuum
84, 13 (2009).
40B. Wang, B. Yoon, M. Koönig, Y. Fukamori, F. Esch, U. Heiz, and U.
Land-man,Nano Lett.12, 5907 (2012).
41K. J. Caspersen, C. R. Stoldt, A. R. Layson, M. C. Bartelt, P. A. Thiel, and
J. W. Evans,Phys. Rev. B63, 085401 (2001).
42S. Wang, Y. Zhang, N. Abidi, and L. Cabrales,Langmuir25, 11078 (2009). 43G. Kresse and J. Furthmüller,Comput. Mater. Sci.6, 15 (1996).
44G. Kresse and J. Hafner,Phys. Rev. B47, 558 (1993). 45G. Kresse and J. Furthmüller,Phys. Rev. B54, 11169 (1996). 46G. Kresse and D. Joubert,Phys. Rev. B59, 1758 (1999).
47Y. Han, B. Ünal, D. Jing, F. Qin, C. J. Jenks, D.-J. Liu, P. A. Thiel, and