R E S E A R C H A R T I C L E
Open Access
Integrated genome-wide association, coexpression
network, and expression single nucleotide
polymorphism analysis identifies novel pathway in
allergic rhinitis
Supinda Bunyavanich
1,2*, Eric E Schadt
1, Blanca E Himes
3, Jessica Lasky-Su
3, Weiliang Qiu
3, Ross Lazarus
3,17,
John P Ziniti
3, Ariella Cohain
1, Michael Linderman
1, Dara G Torgerson
4, Celeste S Eng
4, Maria Pino-Yanes
4,5,
Badri Padhukasahasram
6, James J Yang
7, Rasika A Mathias
8, Terri H Beaty
8, Xingnan Li
9, Penelope Graves
10,
Isabelle Romieu
11, Blanca del Rio Navarro
12, M Towhid Salam
13, Hita Vora
13, Dan L Nicolae
14, Carole Ober
14,
Fernando D Martinez
10, Eugene R Bleecker
9, Deborah A Meyers
9, W James Gauderman
13, Frank Gilliland
13,
Esteban G Burchard
4, Kathleen C Barnes
8, L Keoki Williams
6,15, Stephanie J London
16, Bin Zhang
1,
Benjamin A Raby
3and Scott T Weiss
3Abstract
Background:Allergic rhinitis is a common disease whose genetic basis is incompletely explained. We report an integrated genomic analysis of allergic rhinitis.
Methods:We performed genome wide association studies (GWAS) of allergic rhinitis in 5633 ethnically diverse North American subjects. Next, we profiled gene expression in disease-relevant tissue (peripheral blood CD4+ lymphocytes) collected from subjects who had been genotyped. We then integrated the GWAS and gene expression data using expression single nucleotide (eSNP), coexpression network, and pathway approaches to identify the biologic relevance of our GWAS.
Results:GWAS revealed ethnicity-specific findings, with 4 genome-wide significant loci among Latinos and 1 genome-wide significant locus in the GWAS meta-analysis across ethnic groups. To identify biologic context for these results, we constructed a coexpression network to define modules of genes with similar patterns of CD4+ gene expression (coexpression modules) that could serve as constructs of broader gene expression. 6 of the 22 GWAS loci with P-value≤1x10⁻⁶tagged one particular coexpression module (4.0-fold enrichment, P-value 0.0029), and this module also had the greatest enrichment (3.4-fold enrichment, P-value 2.6 × 10⁻²⁴) for allergic rhinitis-associated eSNPs (genetic variants associated with both gene expression and allergic rhinitis). The integrated GWAS, coexpression network, and eSNP results therefore supported this coexpression module as an allergic rhinitis module. Pathway analysis revealed that the module was enriched for mitochondrial pathways (8.6-fold enrichment, P-value 4.5 × 10−72).
(Continued on next page)
* Correspondence:[email protected] 1
Department of Genetics and Genomic Sciences and Icahn Institute for Genomics and Multiscale Biology, Icahn School of Medicine at Mount Sinai, 10029 New York, NY, USA
2Division of Pediatric Allergy and Immunology, Department of Pediatrics, and Mindich Child Health and Development Institute, Icahn School of Medicine at Mount Sinai, New York, NY, USA
Full list of author information is available at the end of the article
(Continued from previous page)
Conclusions:Our results highlight mitochondrial pathways as a target for further investigation of allergic rhinitis mechanism and treatment. Our integrated approach can be applied to provide biologic context for GWAS of other diseases.
Keywords:Genome-wide association study, Allergic rhinitis, Coexpression network, Expression single-nucleotide polymorphism, Coexpression module, Pathway, Mitochondria, Hay fever, Allergy
Background
Allergic rhinitis is an IgE-mediated inflammation of the upper airway that causes naso-ocular congestion, pruri-tis, rhinorrhea, and sneezing [1]. Colloquially referred to as hay fever, seasonal allergies, and allergies, allergic rhinitis is one of the most common chronic diseases, af-fecting up to 30% of adults and 40% of children [1].
A genetic contribution to allergic rhinitis is evident, based on an increased incidence and prevalence of aller-gic rhinitis among twins and within atopic families [2,3]. Despite the high population prevalence of allergic rhin-itis, there have been relatively few studies of its genetic basis. The National Human Genome Research Institute catalogs just one genome wide association study (GWAS) of allergic rhinitis [4], for example, compared to 33 for asthma and 61 for diabetes [5]. Candidate gene studies have been performed with variable effect sizes and levels of significance reported [3,6,7]. We are aware of three prior GWAS of allergic rhinitis. Andiappan et al. found no genome-wide significant loci in a GWAS of allergic rhin-itis in 942 Chinese subjects [8]. Ramasamy et al. reported one genome-wide significant locus in a GWAS meta-analysis of 12,898 Europeans [4]. Hinds et al. reported 16 genome-wide significant loci for self-reported allergy in a GWAS meta-analysis of subjects of European ancestry [9]. The functional implications of the identified loci were not directly examined in these studies. In a GWAS of allergen-specific IgE level (i.e. not allergic rhinitis), Bonnelykke et al. estimated that ten loci associated with allergen-specific IgE level accounted for 25% population-attributable risk for allergic rhinitis [10], but this was not from a direct study of allergic rhinitis. Of note, loci associ-ated with allergen-specific IgE level have not been consist-ently associated with allergic rhinitis [4,9]. Given that the genetic loci identified to date do not fully explain the esti-mated heritability of allergic rhinitis, it is likely that as yet unidentified genes and pathways contribute to allergic rhinitis pathogenesis.
GWAS results on their own, while helping to elucidate the etiology of disease, do not provide a rich context within which to interpret any finding [11,12]. For ex-ample, for disease-associated SNPs in intergenic regions, the gene is not necessarily immediately known [13]. Typically the closest gene is identified as the gene of interest, but that is not a foolproof algorithm, and the
pathways affected by the genetic locus are also not ne-cessarily immediately apparent [13]. In addition, given the stringent P value thresholds that must be adopted in a GWAS to declare genome-wide significance, much of the data in a GWAS that may inform on disease is ig-nored because the association P values (and effect sizes) that reflect true associations cannot be distinguished from the noise [14].
Various methods have been tried to identify biologic context for loci identified by GWAS, including (1) pression quantitative trait loci (eQTL) mapping and ex-pression single nucleotide polymorphism (eSNP) analysis [10,15-18], (2) network analysis [19,20], and (3) pathway analysis [18,21-23]. eQTL mapping and eSNP analysis are frequently used [15-18]. The motivation for eQTL map-ping and eSNP analysis is that genetic variation is more likely to impact a disease trait if it alters gene transcrip-tion. Linkage or association methods can be used to identify genetic loci influencing gene expression. The linkage-based identification of loci for gene expression is called eQTL mapping, and the association-based iden-tification of SNPs affecting gene expression is called eSNP analysis [15]. Because complex traits such as allergic rhin-itis are unlikely to be governed by single genes or loci, however, eQTL and eSNP analyses alone may provide insufficient context. Network approaches can model vast networks of gene interactions that modulate dis-ease [19,20,24]. Networks are formed by considering pairwise relationships between genes, including protein interaction relationships and coexpression relation-ships [14,24]. Considering GWAS results in the con-text of whole-gene networks may thus provide the necessary context within which to interpret the disease role for a given gene or variant identified by GWAS. Finally, pathway analysis can help decipher the func-tional implications of coherent groups of genes with re-spect to gene ontology functional categories [18,21-23]. Pathways representing specific biologic mechanisms may be overrepresented in genes identified by GWAS, thereby providing relevant biologic context for GWAS results.
for downstream effect [15-17,19,21,23]. Integrative ap-proaches have elucidated biologic mechanisms and treat-ment targets in a number of disease areas including inflammatory bowel disease, Alzheimer’s disease, dia-betes, heart disease, and obesity [15,24,26-29], but simi-lar strategies have not been widely applied to allergy. Further, the gene expression data used to support many GWAS are drawn from individuals distinct from those who were genotyped [16,18,19,21,23], rendering the ana-lysis of any effects of genotype on gene expression indir-ect and potentially biased due to differences in subjindir-ects who were genotyped versus subjects with mRNA data. For example, while Hinds et al. performed GWAS to identify allergy-related loci in a sample of personal gen-etics company customers and birth cohort participants [9], they then identified expression quantitative trait loci (eQTL) among these loci using monocyte gene expres-sion data from a distinct study cohort of heart disease.
We hypothesized that a genome-wide approach to al-lergic rhinitis integrating GWAS with eSNP, coexpres-sion, and pathway analyses using gene expression data generated from disease-relevant tissue collected from the same individuals who were genotyped could enhance the power over standard GWAS to identify disease-relevant loci. Such an approach could not only provide more robust biological context, but also leverage data from cohorts that may not be large enough to yield high numbers of genome-wide significant GWAS results for complex traits such as allergic rhinitis. Here we present our integrated genomic analysis of allergic rhinitis, where we not only identified genome-wide significant genetic variants associated with allergic rhinitis, but also explored the biologic context for these results by profiling gene expression from CD4+ lymphocytes col-lected from genotyped subjects and performing expres-sion single nucleotide polymorphism (eSNP), network, and pathway analyses. Our integrated approach identi-fied a novel pathway in allergic rhinitis.
Results
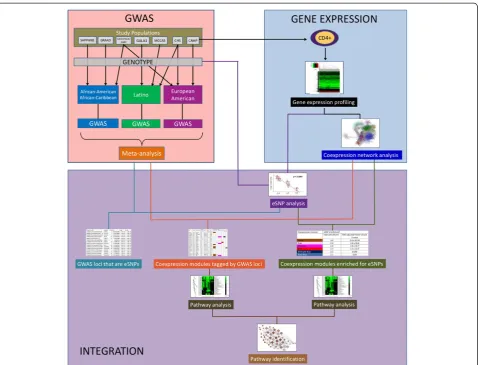
Our integrated genomic analysis of allergic rhinitis yielded results from GWAS, gene expression profiling, and their integrated analysis (Figure 1). We first describe the results of our GWAS of allergic rhinitis in 5633 ethnically diverse North American subjects, where we identified genome-wide significant loci that were specific to ethnicity (Figure 1, pink box). We then describe the results of our gene expression profiling of immune cells key to allergy (CD4+ lymphocytes [30]), collected from the peripheral blood of selected subjects who had under-gone GWAS (Figure 1, blue box). We share the results for the weighted gene coexpression network [31] we constructed to identify modules of genes expressed to-gether. Finally, we describe the integration of our
GWAS and gene expression analyses (Figure 1, purple box), where we performed eSNP analysis to assess for the association between genetic variation and gene ex-pression (Figure 1, purple path), assessed GWAS loci for eSNPs (Figure 1, turquoise path), identified coexpres-sion modules tagged by GWAS loci (Figure 1, orange path), and analyzed coexpression modules for enrichment of allergic-rhinitis associated eSNPs (Figure 1, green path) [15]. We then used pathway analysis to further inform on the biological context for our integrated findings.
GWAS
Subject characteristics
The baseline characteristics of the participating subjects are shown in Table 1. In total, there were 5633 subjects from 7 EVE Consortium study centers [25] in the United States, Mexico, and Barbados who were assessed for al-lergic rhinitis. 2756 (49%) were female. Participants were diverse, with 2034 (36%) European American, 2326 (41%) Latino, and 1273 (23%) African American/African Caribbean. The overall prevalence of allergic rhinitis cases was 48% (2712 subjects).
GWAS and meta-analysis
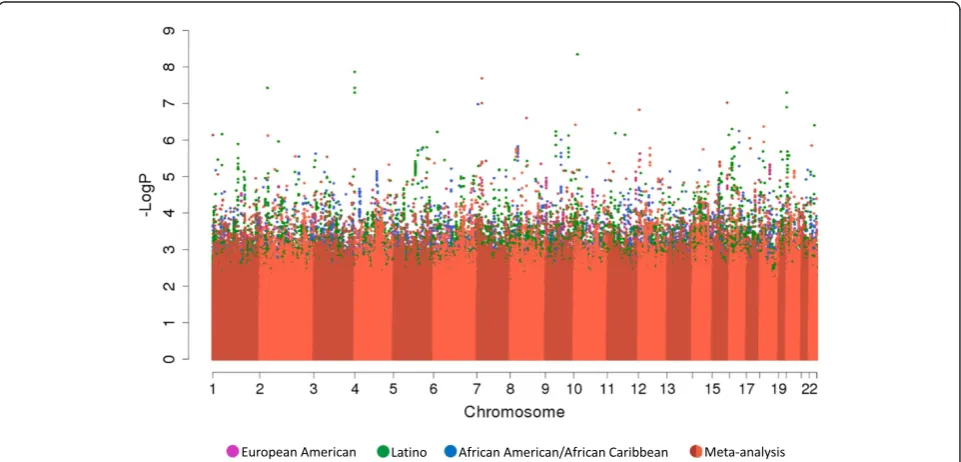
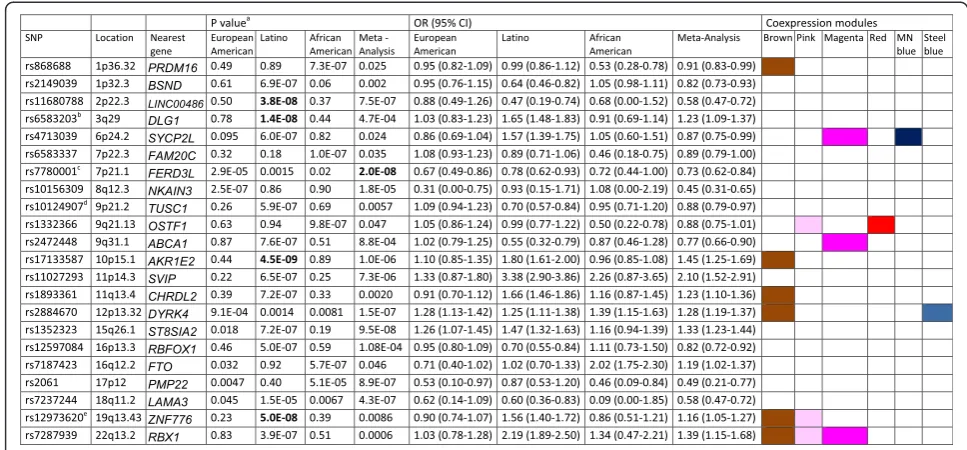
Because subjects were ethnically diverse, we pooled genotype data from the 7 study centers into three ethnic groups for GWAS: European American, Latino, and African-American/African Caribbean (Figure 1, pink box) and controlled for population stratification within each ethnic group using principal components. Figure 2 shows the results of genome-wide association studies for allergic rhinitis among European Americans, Latinos, and African-American/African-Caribbeans, in addition to the results of the meta-analysis across these ethnic groups. For additional views, Additional file 1: Figure S1 shows the Manhattan plots separately for each ethnic group and for the meta-analysis. There were distinct findings for each ethnic group. Figure 3 summarizes the results for the 22 loci with P value for associ-ation≤1 × 10⁻⁶in at least one of the ethnic groups or in the meta-analysis. We show loci meeting this threshold to include loci with suggestive associations (P value≤1 × 10⁻⁶) in addition to those genome-wide significant (defined as P value≤5 × 10⁻⁸), as loci not meeting strict definitions of genome-wide significance can have biologic relevance [11,12]. Allele frequencies are shown in Additional file 2: Table S1, and a QQ plot for the GWAS meta-analysis is shown in Additional file 3: Figure S2. The genomic inflation factor was 1.06, supporting adequate control for population stratification.
Four loci on chromosomes 2p22.3 near LINC0048, 3q29 near DLG1, 10p15.1 near AKR1E2, and 19q13.43
nearZNF776were genome-wide significant among
loci are shown in Additional file 4: Figure S3. For con-text, each of these SNPs was directly genotyped in 2 of the 7 populations, imputation was performed using very conservative metrics [25], and the imputation scores for these SNPs demonstrated good confidence (Additional file 5: Table S2). The regional LD plots for these loci (Additional file 6: Figure S4) show that there were lim-ited SNPs in LD with these genome-wide significant loci. The locus marked by rs7780001 on chromosome 7p21.1
nearFERD3L was genome-wide significant in the
meta-analysis across ethnic groups (P value 2.0 × 10⁻⁸; Figure 3 and Additional file 7: Figure S5) and had nominally signifi-cant associations in all three ethnic groups. The loci marked by rs2884670 on chromosome 12p13.32 near DYRK4 and rs7237244 on chromosome 18q11.2 nearLAMA3 also had nominally significant associations in all three ethnic groups.
Among the 17 loci previously identified by GWAS as asso-ciated with allergic rhinitis [4,9], four were assoasso-ciated with allergic rhinitis with P value≤0.05 in our study (Additional file 8: Table S3).
Individuals with allergic rhinitis frequently have co-morbid asthma [1,32]. Indeed, we observed that 2051 (76%) of those with allergic rhinitis had asthma, and 1195 (41%) of those without allergic rhinitis had asthma. As subphenotypes of AR based on asthma status are possible, we also performed secondary GWAS stratified by asthma status. These results are shown in the sup-plementary file (Additional file 9: Supsup-plementary Re-sults 1, Additional file 10: Table S4,and Additional file 11: Figure S6) and similarly showed ethnicity-specific findings. In Additional file 12: Table S5, we show the sample compos-ition of the stratified analyses according to asthma status.
Genome-wide CD4+ gene expression and coexpression network to enhance GWAS
To assess the potential biological impact of the loci identified in our GWAS analyses, we collected and measured genome-wide gene expression in disease-relevant tissue (peripheral blood CD4+ lymphocytes) from 200 subjects who had undergone GWAS and constructed a gene coexpression net-work based on the gene expression data (Figure 1,blue box). We built the coexpression network to identify coexpressed gene modules (i.e. groups of genes with similar patterns of expression profiles and interconnectivity across the
experimental samples), as these could serve as broader constructs of gene expression and provide a path to discover broader biologic context [31].
We achieved CD4+ lymphocyte yields of ~4x10⁶cells at≥95% purity per collection. Bioanalyzer (Agilent Tech-nologies, Santa Clara, CA) analysis confirmed average total RNA yields of 2 μg per collection, with minimal evidence of RNA degradation and 28S:18S ratios ap-proaching 2.0.
Figure 4A shows the coexpression network we con-structed using weighted gene coexpression network analysis Table 1 Baseline characteristics of North American subjects included in the study
Studya
CHS CAMP CAG/CSGA/SARP GALA1 MCCAS GRAAD SAPPHIRE
Number 2881 384 283 521 476 809 279
Age (years) 8.3 (5.2-14.3) 8.8 (5.2-13.2) 27.3 (6.0-81.0) 14.8 (8.0-40.0) 9.0 (5.0-17.0) 40.0 (14.0-84.0) 30.3 (12.0-56.0)
Female 1344 (47%) 142 (37%) 150 (53%) 230 (44%) 198 (42%) 474 (59%) 219 (78%)
Race
European American 1552 (54%) 384 (100%) 98 (35%)
Latino 1329 (46%) 521 (100%) 476 (100%)
African American/African Caribbean 185 (65%) 809 (100%) 279 (100%)
Allergic Rhinitis 1096 (38%) 199 (52%) 245 (87%) 434 (83%) 250 (53%) 377 (47%) 111 (40%)
Asthma 1206 (42%) 384 (100%) 283 (100%) 521 (100%) 476 (100%) 228 (28%) 148 (53%)
Genotyping platformb 550 K, 610 K 550 K 1Mv1 6.0 550 K 650 K 6.0
Values are mean (range) or number (percent).
aCHS = Children’s Health Study, CAMP = Childhood Asthma Management Program, CAG = Chicago Asthma Genetics Study, CSGA = Collaborative Studies on the
Genetics of Asthma, SARP = Severe Asthma Research Program, GALA1 = Genetics of Asthma in Latinos, MCCAS = Mexico City Childhood Asthma Study, GRAAD = Genomic Research on Asthma in the African Diaspora and Barbados, SAPPHIRE = Study of Asthma Phenotypes and Pharmacogenomic Interactions by Race-Ethnicity. Detailed descriptions of the individual studies have been previously described [25].
b
The Illumina arrays used were the 1Mv1, 550 k, 610 k and 650 k. The Affymetrix arrays used were the 500 k and 6.0.
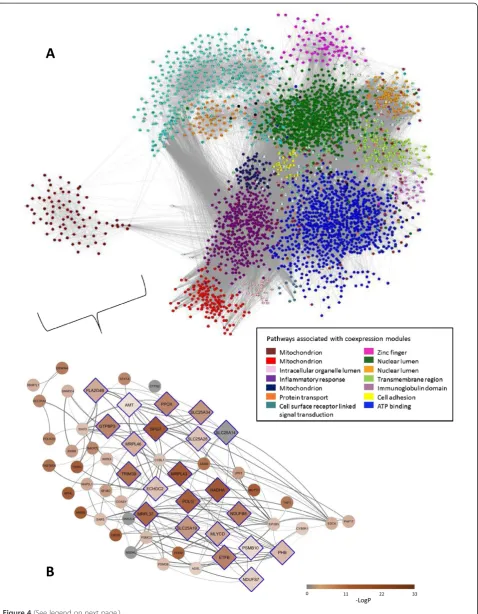
of the CD4+ lymphocyte gene expression data. In total, there were 41 coexpressed gene modules identified by the coex-pression network, and their interconnectivities are shown. For ease of visualization, modules are identified by color.
Using pathway analysis, we found that the modules were enriched for a variety of gene ontology (GO) path-ways reflecting the functions being carried out by each module. Pathways associated with the largest coexpres-sion modules are shown in the legend of Figure 4A. For example, the brown module highlighted in Figure 4B was enriched for mitochondrial function. Zinc finger, in-flammatory response, and immunoglobulin domain were other pathways highlighted by examining the coexpres-sion modules for functional enrichment (Figure 4A).
Integration of GWAS and CD4+ gene expression to explore biologic context for GWAS
To explore the biologic context for our GWAS results, we analyzed our GWAS and gene expression findings together (Figure 1, purple box).
GWAS loci that are eSNPs
We first performed eSNP analysis to assess for the asso-ciation between genetic variation and gene expression (Figure 1, purple path). We then examined the GWAS and eSNP results together to identify GWAS loci that were eSNPs (Figure 1, turquoise path), as genetic vari-ation that is associated with both the trait and gene
expression is more likely to be biologically relevant than variants that are associated with the trait only with no effect on gene expression. We found that the 19q13.43 locus near ZNF776 was associated with allergic rhinitis (GWAS P value 5.0 × 10⁻⁸) as well as CD4+ gene ex-pression (χ2= 19.55, FDR-adjusted P value 0.00078). The other loci identified by GWAS were not associated with CD4+ gene expression.
Given the relatively modest size of our sample and the fact that we were examining a complex trait, we had an-ticipated that traditional GWAS would uncover only a small number of biologically relevant loci, even with the aid of eSNP analysis, as such an approach would rely upon detection of single variant associations with trait and expression. We therefore sought to leverage the CD4+ expression data more broadly through coexpres-sion network and pathway analysis.
Coexpression modules tagged by GWAS loci
Compared to individual genes, coexpression modules identified through coexpression network analysis (Figure 4) can serve as more general constructs of gene expression, providing a path to discover broader context and related loci [14,28,31,33-40]. Motivated by the same rationale that genetic variation that is associated with both the trait and gene expression is more likely to be biologically relevant than variants associated with the trait only, we mapped GWAS loci to CD4+ coexpression modules and examined
the modules that were tagged by GWAS loci (Figure 1, or-ange path). Specifically, we defined a GWAS locus as tag-ging a coexpression module if a coexpression module contained a gene within 250 kb of the locus. We found that 9 of the 22 GWAS loci tagged at least one coex-pression module and 6 coexcoex-pression modules in total (Figure 3). These 6 modules (the brown, pink, magenta, red, midnight blue, and steel blue coexpression modules) tagged by GWAS loci were therefore considered candidate allergic rhinitis associated modules that could inform on allergic rhinitis biology. The 19q13.43 locus nearZNF776 was among the GWAS loci tagging coexpression modules, corroborating our eSNP results and illustrating the in-creased power of detection gained by using the coex-pression module as a more general construct of gene expression. Of note, some of candidate allergic rhinitis associated modules were tagged by GWAS loci that would not have been considered remarkable by trad-itional criteria for genome-wide significance of individ-ual loci (P value≤5.0 × 10⁻⁸). Our approach of using GWAS loci to tag coexpression modules therefore allowed us to gain additional utility from our GWAS results.
Among the 6 candidate allergic rhinitis associated mod-ules tagged by GWAS loci, the brown module (represent-ing mitochondrial pathways accord(represent-ing to pathway analysis (Figure 4)) was tagged by 6 of the 22 GWAS loci (Figure 3). This proportion represented a significant enrichment (4.0-fold enrichment, P-value 0.0029) over chance, sup-porting a connection between these GWAS loci and mito-chondrial pathway functions.
Coexpression module enrichment for allergic rhinitis-associated eSNPs
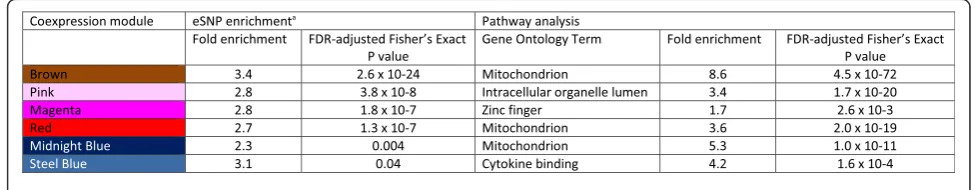
To further ascertain whether any of the 6 candidate allergic rhinitis associated modules were underlying allergic rhinitis susceptibility, we tested whether these modules were enriched for eSNPs that were also associ-ated with allergic rhinitis (Figure 1, green path). eSNPs (i.e. SNPs associated with gene expression) represent functionally validated SNPs of interest in that they are associated with expression levels of genes in a cell type relevant to the disease under study [15]. While such individual associations may not be meaningful, the pattern of associations enriched within a given coex-pression module can provide strong statistical support for module involvement at the genetic level in the disease [14,28,31,33-40]. The additional association of eSNPs within a coexpression module with the disease of interest provides further statistical support that the coexpression module is involved in the disease, as the module is then not only enriched for eSNPs (e.g. SNPs associated with CD4+ gene expression), but more specifically, enriched for disease-associated eSNPs (e.g. SNPs associated with both CD4+ gene expression and allergic rhinitis).
In this instance, we identified the brown module as giv-ing rise to the greatest enrichments of allergic-rhinitis-associated eSNPs (3.4-fold enrichment; FDR-adjusted Fisher’s Exact Test P value 2.6 × 10⁻²⁴) (Figure 5), thus providing statistical support for involvement of the brown module in allergic rhinitis. Pathway analysis revealed that the brown module was enriched for mitochondrial path-ways (8.6-fold enrichment, FDR-adjusted Fisher Exact (See figure on previous page.)
Figure 4CD4+ lymphocyte coexpression network with detail of the brown coexpression module. A. Each circle represents a gene. Weighted gene coexpression analysis identified groups of genes with similar patterns of gene expression and interconnectivity (coexpression modules). The 41 coexpression modules identified are labeled by color. Pathways associated with the largest coexpression modules are denoted in the legend.B. Interconnectivity of the brown coexpression module is shown in detail. Tagged by 6 allergic rhinitis GWAS loci, this
coexpression module was highly enriched for allergic rhinitis-associated eSNPs (3.4-fold enrichment, FDR-adjusted P value = 2.6 × 10⁻²⁴) and also highly enriched for pathways related to mitochondrial function (8.6-fold enrichment, FDR-adjusted P value = 4.5 × 10−72). Genes containing allergic rhinitis-associated eSNPs are marked in brown, with those containing eSNPs with lowest P-value for association between genotype and gene expression marked with greatest brown saturation. Genes in pathways related to mitochondrial function are marked by diamonds with blue outline. Higher correlation between gene expression is shown with thicker and darker edges.
Test P value = 4.5 × 10−72) (Figure 5 and Figure 4B). The red and midnight blue modules were also enriched for allergic rhinitis–associated eSNPs, and both these mod-ules were enriched for mitochondrial pathways as well (Figure 5). The pink module, enriched for the GO term intracellular organelle lumen, functionally overlaps with mitochondrial pathway. Thus, the candidate allergic rhinitis-associated modules were all significantly enriched for allergic rhinitis-associated eSNPs, and pathway ana-lysis results for at least half of these modules highlighted mitochondrial pathways as linked to allergic rhinitis. Re-sults from randomized networks did not yield meaningful results (Additional file 13: Supplementary Results 2, Additional file 14: Figure S7).
In summary, pathway analysis of our results from the integration of GWAS and coexpression network analysis (showing a significantly high number of GWAS loci tag-ging the brown module), as well as from the integration of eSNP analysis and coexpression network results (showing greatest enrichment of the brown module for allergic rhinitis-associated eSNPs), both pointed to mito-chondrial pathways as playing an important role in aller-gic rhinitis (Figure 1). Key to these results was that the coexpression network helped organize the expression traits into coherent, highly interconnected modules reflect-ing the biological processes at play in the tissue. By usreflect-ing GWAS loci to tag coexpression modules and then requir-ing these tagged coexpression modules to be enriched for eSNPs that were also associated with allergic rhinitis, we were able to place candidate GWAS associations in a more informed context that not only provided a biological con-text for GWAS interpretation, but enhanced confidence in the suggestive hits given an enrichment of multiple func-tional SNPs associating with the disease phenotype [15]. Through this approach, we found consistent evidence that mitochondrial pathways likely play a role in the genetics and pathophysiology of allergic rhinitis.
Discussion
A motivation for genome-wide studies is the desire to identify novel pathways and mechanisms in disease pathogenesis. A limitation of traditional genome-wide association studies is that statistically significant loci may be identified [4,9], but the biological relevance of the individual or aggregate variants are often not evident [11,12]. This is not overcome by replication of genotype associations, which has been the usual path taken to fol-low up GWAS findings, and one which has led to limited success [7,9,41]. Our study demonstrates the advantages of integrating network approaches with GWAS to identify and prioritize pathways and gene targets of biologic rele-vance. By integrating our GWAS findings with eSNP, coexpression, and pathway analyses using gene expression data from disease-relevant tissue generated from
subjects who had undergone GWAS, we tested the po-tential biologic context of our GWAS findings through integrative methods and identified a novel pathway in allergic rhinitis—mitochondrial pathways. Our method allowed us to leverage data from multiple GWAS loci to identify biologic context for the aggregate findings. This is in contrast to traditional GWAS, where the im-plications of individual SNP associations are often challenging to define [11,12]. Because complex traits such as allergic rhinitis are unlikely to be governed by single variants, strategies that capitalize on broader constructs of GWAS and gene expression results are more likely to yield informative disease context. We adopted such a strategy and were able to identify novel biologic context for allergic rhinitis. Further, our ap-proach of integrating genotype and gene expression data generated from the same sample has not been widely applied to the study of allergic diseases. Our methods can be used to provide a richer biologic con-text for GWAS findings in other disease areas.
human airway epithelial cells, triggers reactive oxygen species production from mitochondrial respiratory chain complex III, and induces mitochondrial dysfunction in complex III [47].
Mitochondrial changes induced by pollen can serve as the second hit leading to allergic inflammation if there is preex-isting mitochondrial dysfunction. Indeed, when treated in-tranasally with pollen extract, mice with mitochondrial dysfunction (induced deficiency in UQCRC2) demonstrated evidence of allergic airway inflammation, in contrast to UQCRC2-sufficient control mice challenged with the same pollen extract [47]. Specifically, these mice with mitochondrial dysfunction exhibited a 4.4 fold increase in bronchoalveolar lavage eosinophil counts, increased accumulation of peribronchial inflammatory cells, en-hanced mucous cell metaplasia in airway epithelium, and increased airway hyperresponsiveness [47]. Although these studies characterized changes in the lower airway, the strong link between upper and lower airway disease patho-genesis [42] suggests that analogous changes in the upper airway could cause individuals with preexisting mitochon-drial dysfunction to develop allergic inflammation leading to allergic rhinitis with pollen exposure. Our results high-light this as a potential mechanistic area, as 27% (6/22) of the genetic loci for allergic rhinitis that we identified by genome-wide association analysis tagged a gene coexpres-sion module that was not only markedly enriched for eSNPs associated with allergic rhinitis (3.4-fold, FDR-adjusted P-value 2.6 × 10⁻²⁴), but also significantly enriched for mitochondrial pathways by pathway analysis (8.6-fold enrichment, FDR-adjusted P value 4.5 × 10−72).
Population-based studies additionally support a role for mitochondrial pathways in allergic rhinitis pathogenesis. Mitochondria are the primary sites of oxidative reactions. Levels of malondialdehyde (a marker of oxidative stress) are higher, and levels of reduced glutathione (an antioxi-dant) are lower in the exhaled nasal condensates of aller-gic rhinitis subjects compared to healthy controls [48]. The epidemiological link between maternal history of atopy (as opposed to paternal history of atopy) and greater risk for allergic rhinitis in offspring [49,50] may be ex-plained by the fact that mitochondria are maternally trans-mitted. Consistent with this, mitochondrial haplotypes are associated with intermediate phenotypes of allergic rhin-itis, including total serum IgE levels and skin prick test re-activity [51].
Our results suggest that reducing mitochondrial dys-function could improve allergic rhinitis. In murine models of allergic airway inflammation, intratracheal administra-tion of an antioxidant known to enter mitochondria and protect the electron chain from oxidative damage [52] de-creased allergen-induced airway hyperreactivity and air-way inflammation severity, as shown by reduced numbers of inflammatory cells in bronchoalveolar fluid [53]. Again,
these studies focused on lower airway disease, but the strong link between upper and lower airway disease pathogenesis [42] suggests that it may be possible to achieve similar results if the upper airway were targeted in allergic rhinitis treatment.
Our GWAS of allergic rhinitis was the first to examine ethnically diverse subjects for this complex trait, and our study revealed susceptibility loci that were specific to ethni-city. This is consistent with genome-wide association stud-ies of other complex diseases–such as asthma [25,54] and obesity [55,56]– that have also demonstrated ethnicity-specific effects. Given the possibility that allergic rhinitis with comorbid asthma vs. allergic rhinitis without comor-bid asthma may be distinct disease subphenotypes [32], we also performed secondary GWAS analyses stratified by asthma status. These results similarly showed ethnicity specific findings. Our findings support the utility of studying ancestrally-diverse populations in genome-wide studies.
We recognize the limitations of our study. We defined allergic rhinitis using criteria commonly employed in population-based and genetic studies of allergic rhinitis, which are based on questionnaire without objective markers [1,4,9]. For our eSNP and coexpression network analyses, it would have been ideal to have profiled gene ex-pression for all 5633 subjects who participated in the GWAS, but CD4+ lymphocytes were not available from all subjects. We had CD4+ lymphocytes from European-American CAMP subjects only, and it is possible that coex-pression results would have differed had we additionally had expression profiles from subjects of other ethnic back-grounds, as gene expression can vary by ethnicity. While expression differences can change with ethnicity, the connectivity structure is expected to be much more highly conserved, however, and is even seen across species [57]. Additionally, we recognize that our coexpression network may have yielded distinct results had we chosen a different tissue for gene expression profiling; we had chosen to study peripheral blood CD4+ lymphocytes given their central role in allergic disease [30]. Despite these limitations, we were able to implement an integrative analysis of our GWAS, coexpression network, and eSNP results, leading to the identification of a novel biologic pathway in allergic rhinitis. Our strategy created an informed biological context for our GWAS that may be used to better understand allergic rhin-itis. Further, our methods may be implemented to provide biologic context for GWAS of other diseases.
Conclusions
using gene expression data generated from subjects who had undergone GWAS. Our integrated approach identified mitochondrial pathways as important in allergic rhinitis, and our strategy may prove useful to studying other diseases.
Methods
Ethics statement
Each study was approved by the Institutional Review Board of the corresponding institution. Informed con-sent was obtained for all study participants, and where appropriate, informed assent from minors and informed consent from their parent were obtained.
Subjects, genotyping, and phenotyping
Subjects were recruited from EVE Consortium centers in the United States, Mexico, and Barbados. Detailed de-scriptions of the individual studies, genotyping platforms, and quality control protocols have been previously de-scribed [25]. Of note, SNPs with imputation quality scores below a threshold (Rsq < 0.3) were removed from the ana-lysis. We included subjects who were specifically assessed for allergic rhinitis, and these came from 7 study centers (Figure 1). Allergic rhinitis status was considered positive if a subject reported a history of allergic rhinitis ever, de-fined as hay fever or runny/stuffy nose with sneezing or itching when the subject did not also have a cold or flu.
GWAS and meta-analysis
Summary files on a common set of SNPs were shared among the EVE Consortium investigators. Genotype im-putation using HapMap reference panels and Markov Chain Haplotyping software (MaCH) [58] were per-formed in each sample as previously described [25]. We pooled the imputed genotype data for each ethnic group (European American, Latino, African American/African Caribbean) (Figure 1). To adjust for potential population stratification, we used Eigenstrat [59] to create principal components for each ethnic group. Within each ethnic group, we tested for the association of SNPs with allergic rhinitis by constructing a test statistic that had a stand-ard normal distribution under the null hypothesis of no association and captured the direction of the effect. Models were implemented in PLINK [60] and controlled for age, sex, and principal components. To allow for com-parability with previous GWAS of allergic rhinitis [4,8,9], we did not include asthma status as a covariate. To assess for the effects of SNPs across ethnic groups, we then cal-culated a meta-analysis statistic as a combination of the individual ethnic study scores using METAL [61].
Recognizing the potential subphenotypes of isolated allergic rhinitis vs. allergic rhinitis with comorbid asthma [1,32], we additionally performed secondary GWAS and meta-analyses in subjects stratified by asthma status using methods analogous to the above.
Genome-wide CD4+ gene expression
We collected peripheral blood CD4+ lymphocytes from 200 subjects who had undergone GWAS. These 200 subjects were from Childhood Asthma Management Co-hort (CAMP) coCo-hort [62], one of the member centers of the EVE Consortium (Figure 1). We focused on this sample subset because of biospecimen availability. Per-ipheral blood was collected into BD Vacutainer CPT tubes (BD Diagnostics, Franklin Lakes, New Jersey) and placed on ice. Samples were centrifuged within 1 hour of collection for 20 minutes at 1700RCF, followed by mononuclear cell layer isolation and suspension in 10 ml of PBS. We isolated CD4+ lymphocytes using anti-CD4+ microbeads by column separation (Miltenyi Biotec, Auburn, CA) using 20μl anti-CD4+ Micro beads per 106 total cells. To extract total RNA, we used the RNeasy Mini Protocol (QIAGEN, Valencia, CA) and stored at −80°C. We generated expression profiles with the Illumina HumanRef8 v2 BeadChip arrays (Illumina, San Diego CA). Expression data were log2 transformed and quan-tile normalized.
Coexpression network analysis
We performed weighted gene coexpression network ana-lysis to identify coexpressed gene modules [31]. We used a previously applied, well-established, well-recognized, and validated method to construct the coexpression net-work [14,28,31,33-40]. For module detection, we used average linkage hierarchical clustering of a topological overlap matrix based on an adjacency matrix that is comprised of power-transformed correlations between gene expression profiles [31]. To cut branches of the tree into gene modules, we used the dynamic tree cutting al-gorithm, which iteratively searches for stable branch sizes and chooses clusters based on the shape of each dendrogram branch [63]. This algorithm allows manipu-lation of several parameters controlling the resultant cluster size and cohesiveness. The modules identified from the coexpression network were then carried for-ward into the integrative analysis.
To provide support for the specificity of our sion network, we generated multiple random coexpres-sion networks where gene assignments were randomized (Random Networks 1–3), as well as random networks where the gene expression levels were randomized (Random Networks 4–6). We carried these random networks forward into the integrated analysis as well.
Integration of GWAS and CD4+ gene expression
associated modules, and then assessed for enrichment of eSNPs that were also nominally associated with al-lergic rhinitis. A SNP was considered an eSNP if the SNP was located within 1 megabase of the corre-sponding gene, and the association between genotype and gene expression was significant at a 10% false discovery rate (FDR) (P value≤1 × 10⁻⁴). For modules tagged by at least 1 GWAS locus, we used the Fisher’s exact test to assess whether a module was enriched for eSNPs that were also nominally associ-ated (P value≤0.01) with allergic rhinitis. The com-position of modules was then assessed by pathway analysis using defined gene ontologies (GO) via the DAVID analysis tool [64,65]. Overrepresentation of canonical pathways and biological processes in modules was measured via the Fisher’s exact test. P values from this test were FDR-adjusted given the number of modules and functional categories tested. Networks were visualized using the Cytoscape network visualization tool [66].
Additional files
Additional file 1: Figure S1.Manhattan plots for the European American, Latino, and African-American genome-wide association and meta-analysis results for allergic rhinitis.
Additional file 2: Table S1.Allele frequencies for loci identified in the GWAS of allergic rhinitis.
Additional file 3: Figure S2.QQ plot for the GWAS meta-analysis of allergic rhinitis across ethnic groups.
Additional file 4: Figure S3.Regional associations for genome-wide significant loci (P value≤5 × 10⁻⁸) in the GWAS of allergic rhinitis among Latinos.
Additional file 5: Table S2.Mean Rsq values for genome-wide significant loci in the GWAS of allergic rhinitis among Latinos.
Additional file 6: Figure S4.Regional LD plots for genome-wide significant loci (P value≤5 × 10⁻⁸) in the GWAS of allergic rhinitis among Latinos.
Additional file 7: Figure S5.Regional associations for the genome-wide significant locus (P value 1.0 × 10⁻⁸) in the GWAS meta-analysis across ethnic groups.
Additional file 8: Table S3.P values for association with allergic rhinitis for 17 loci identified in previous GWAS of allergic rhinitis.
Additional file 9: Supplementary Results 1.Results for the GWAS of allergic rhinitis stratified by asthma status.
Additional file 10: Table S4.Results of the genome-wide association studies of allergic rhinitis among subjects without asthma.
Additional file 11: Figure S6.Regional associations for the locus with suggestive associations in the GWAS of allergic rhinitis among African Americans/African Caribbeans with asthma.
Additional file 12: Table S5.Sample composition of the stratified analysis according to asthma status.
Additional file 13: Supplementary Results 2.Random coexpression networks.
Additional file 14: Figure S7.Plots of scale free topology for coexpression networks constructed from randomized CD4+ gene expression data. Gene names were randomized in Random Networks 1–3. Gene expression values were randomized in Random Networks 4–6.
Abbreviations
FDR:False discovery rate; GWAS: Genome-wide association study; eQTL: Expression quantitative trait loci; eSNP: Expression single nucleotide polymorphism; GO: Gene ontology; IgE: Immunoglobulin E; LD: Linkage disequilibrium; QQ: Quantile quantile.
Competing interests
The authors declare that they have no competing interests.
Authors’contributions
Conception and design of study: SB, EES, BEH, BAR, STW, Acquisition of data: SB, BEH, RL, JPZ, DGT, CSE, MPY, BP, JJY, RAM, THB, XL, PG, IR, BRN, MTS, HV, DLN, CO, FDM, ERB, DAM, WJG, FG, EGB, KCB, LKW, SJL, BAR, STW, Analysis and interpretation of data: SB, EES, BEH, JLS, WQ, RL, JPZ, AC, ML, BZ, BAR, STW, Drafting of the manuscript: SB, EES, STW, Review of the manuscript: SB, BEH, RL, JPZ, DGT, CSE, MPY, BP, JJY, RAM, THB, XL, PG, IR, BRN, MTS, HV, DLN, CO, FDM, ERB, DAM, WJG, FG, EGB, KCB, LKW, SJL, BAR, STW, Critical revision of the manuscript: SB, EES, BEH, JPZ, BZ, STW. All authors read and approved the final manuscript.
Acknowledgements
We thank all the participants who made this study possible. We appreciate contributions from Brooke Schuemann, Barbara Klanderman, PhD, Jody S. Sylvia, Ute Geigenmuller, PhD, Roxanne Kelly, M.B.A., Jose Rodriguez Santana, M.D, William Rodriguez Cintron, M.D., Rocio Chapela, M.D., Jean Ford, M.D., Shannon Thyne, M.D., and Pedro C. Avila, M.D. This work was supported by grants from the National Institutes of Allergy and Infectious Disease (K08AI093538 to S.B.; AI070503 to C.O.; AI079139 and AI061774 to L.K.W.; and AI077439 to E.G.B.), the National Heart, Lung, and Blood Institute (HL101651 to C.O. and D.L.N.; HL087665 to D.L.N.; HL085197, HL087665, HL072414, and HL49596 to C.O.; HL064307 and HL064313 to F.D.M.; HL075419, HL65899, HL083069, HL066289, HL087680, HL101543, and HL101651 to S.T.W.; HL079055 to L.K.W.; HL087699, to K.C.B.; HL061768, HL076647, P30ES007048, P01ES011627 to F.D.G.; HL087680 to W.J.G.; HL078885 and HL088133 to E.G.B.; HL087665 to D.A.M.; and HL069167 to E.R.B), the National Institute of Diabetes and Digestive and Kidney Diseases to L.K.W. (DK064695); the National Institutes of Environmental Health Sciences (ES020801 and ES022719 to W.J.G.; ES007048, ES009581, R826708, RD831861, and ES011627 to F.D.G.; ES015794 to E.G.B.; and the Division of Intramural Research, Z01 ES049019 to S.J.L.) of the National Institutes of Health. Also supported by the American Asthma Foundation and the Fund for Henry Ford Hospital (to L.K. W.), Mary Beryl Patch Turnbull Scholar Program (to K.C.B.); the Flight Attendant Medical Research Institute (FAMRI), RWJF Amos Medical Faculty Development Award, the American Asthma Foundation, the Sandler Foundation (to E.G.B.), and Fundación Ramón Areces (to M.P.Y.). The funders had no role in study design, data collection and analysis, decision to publish, or preparation of the manuscript.
Author details
1
Department of Genetics and Genomic Sciences and Icahn Institute for Genomics and Multiscale Biology, Icahn School of Medicine at Mount Sinai, 10029 New York, NY, USA.2Division of Pediatric Allergy and Immunology, Department of Pediatrics, and Mindich Child Health and Development Institute, Icahn School of Medicine at Mount Sinai, New York, NY, USA. 3Channing Division of Network Medicine, Department of Medicine, Brigham & Women’s Hospital and Harvard Medical School, Boston, MA, USA. 4Department of Medicine and Department of Bioengineering and Therapeutic Sciences, University of California San Francisco, San Francisco, CA, USA.5IBER de Enfermedades Respiratorias, Instituto de Salud Carlos III, Madrid, Spain.6Center for Health Policy and Health Services Research, Henry Ford Health System, Detroit, MI, USA.7Department of Public Health Sciences, Henry Ford Health System, Detroit, MI, USA.8Departments of Medicine and Epidemiology, Johns Hopkins University, Baltimore, MD, USA.9Center for Genomics, Wake Forest University School of Medicine, Winston Salem, NC, USA.10Arizona Respiratory Center and BIO5 Institute, University of Arizona, Tucson, AZ, USA.11International Agency for Research on Cancer, Lyon, France.12Hospital Infantil Federico Gómez, México City, Mexico. 13
Health and Human Services, National Institute of Environmental Health Sciences, National Institutes of Health, Research Triangle, Park, NC, USA. 17Medical Bioinformatics, Baker IDI, Melbourne, Australia.
Received: 3 January 2014 Accepted: 4 June 2014 Published: 2 August 2014
References
1. Wallace DV, Dykewicz MS, Bernstein DI, Blessing-Moore J, Cox L, Khan DA, Lang DM, Nicklas RA, Oppenheimer J, Portnoy JM, Randolph CC, Schuller D, Spector SL, Tilles SA:The diagnosis and management of rhinitis: an updated practice parameter.J Allergy Clin Immunol2008,122:S1–S84.
2. Feijen M, Gerritsen J, Postma DS:Genetics of allergic disease.Br Med Bull 2000,56:894–907.
3. Davila I, Mjullol J, Ferrer M, Bartra J, del Cuvillo A, Montoro J, Jauregui I, Sastre J, Valero A:Genetic aspects of allergic rhinitis.J Investig Allergol Clin Immunol2009,19:25–31.
4. Ramasamy A, Curjuric I, Coin LJ, Kumar A, McArdle WL, Imboden M, Leynaert B, Kogevinas M, Schmid-Grendelmeier P, Pekkanen J, Wjst M, Bircher AJ, Sovio U, Rochat T, Hartikainen AL, Balding DJ, Jarvelin MR, Probst-Hensch N, Strachan DP, Jarvis DL:A genome-wide meta-analysis of genetic variants associated with allergic rhinitis and grass sensitization and their interaction with birth order.J Allergy Clin Immunol2011, 128:996–1005.
5. Hindorff LA MJEBI, Morales J, (European Bioinformatics Institute), Junkins HA, Hall PN, Klemm AK, Manolio TA:A Catalog of Published Genome-Wide Association Studies.Available at: http://www.genome.gov/gwastudies Accessed September 19, 2013 2013.
6. Bunyavanich S, Shargorodsky J, Celedon JC:A meta-analysis of Th2 pathway genetic variants and risk for allergic rhinitis.Pediatr Allergy Immunol2011, 22:378–387.
7. Nilsson D, Andiappan AK, Hallden C, Tim CF, Sall T, De Wang Y, Cardell LO: Poor reproducibility of allergic rhinitis SNP associations.PLoS One2013, 8:e53975.
8. Andiappan AK, Wang de Y, Anantharaman R, Parate PN, Suri BK, Low HQ, Li Y, Zhao W, Castagnoli P, Liu J, Chew FT:Genome-wide association study for atopy and allergic rhinitis in a Singapore Chinese population.PLoS One 2011,6:e19719.
9. Hinds DA, McMahon G, Kiefer AK, Do CB, Eriksson N, Evans DM, St Pourcain B, Ring SM, Mountain JL, Francke U, Davey-Smith G, Timpson NJ, Tung JY: A genome-wide association meta-analysis of self-reported allergy identifies shared and allergy-specific susceptibility loci.Nat Genet 2013,45:907–911.
10. Bonnelykke K, Matheson MC, Pers TH, Granell R, Strachan DP, Alves AC, Linneberg A, Curtin JA, Warrington NM, Standl M, Kerkhof M, Jonsdottir I, Bukvic BK, Kaakinen M, Sleimann P, Thorleifsson G, Thorsteinsdottir U, Schramm K, Baltic S, Kreiner-Moller E, Simpson A, St Pourcain B, Coin L, Hui J, Walters EH, Tiesler CM, Duffy DL, Jones G, Ring SM, McArdle WL,et al: Meta-analysis of genome-wide association studies identifies ten loci influencing allergic sensitization.Nat Genet2013,45:902–906. 11. Loos RJ, Schadt EE:This I believe: gaining new insights through
integrating "old" data.Front Genet2012,3:137.
12. Schadt E, Chang R:Genetics. A GPS for navigating DNA.Science2012, 337:1179–1180.
13. Manolio TA:Bringing genome-wide association findings into clinical use. Nat Rev Genet2013,14:549–558.
14. Sieberts SK, Schadt EE:Moving toward a system genetics view of disease. Mamm Genome2007,18:389–401.
15. Schadt EE, Molony C, Chudin E, Hao K, Yang X, Lum PY, Kasarskis A, Zhang B, Wang S, Suver C, Zhu J, Millstein J, Sieberts S, Lamb J, GuhaThakurta D, Derry J, Storey JD, Avila-Campillo I, Kruger MJ, Johnson JM, Rohl CA, van Nas A, Mehrabian M, Drake TA, Lusis AJ, Smith RC, Guengerich FP, Strom SC, Schuetz E, Rushmore TH:Mapping the genetic architecture of gene expression in human liver.PLoS Biol2008,6:e107.
16. Greenawalt DM, Sieberts SK, Cornelis MC, Girman CJ, Zhong H, Yang X, Guinney J, Qi L, Hu FB:Integrating genetic association, genetics of gene expression, and single nucleotide polymorphism set analysis to identify susceptibility Loci for type 2 diabetes mellitus.Am J Epidemiol2012, 176:423–430.
17. Zhang X, Johnson AD, Hendricks AE, Hwang SJ, Tanriverdi K, Ganesh SK, Smith NL, Peyser PA, Freedman JE, O'Donnell CJ:Genetic associations with
expression for genes implicated in GWAS studies for atherosclerotic cardiovascular disease and blood phenotypes.Hum Mol Genet2013, 23:782–795.
18. Anttila V, Winsvold BS, Gormley P, Kurth T, Bettella F, McMahon G, Kallela M, Malik R, de Vries B, Terwindt G, Medland SE, Todt U, McArdle WL, Quaye L, Koiranen M, Ikram MA, Lehtimaki T, Stam AH, Ligthart L, Wedenoja J, Dunham I, Neale BM, Palta P, Hamalainen E, Schurks M, Rose LM, Buring JE, Ridker PM, Steinberg S, Stefansson H:Genome-wide meta-analysis identifies new susceptibility loci for migraine.Nat Genet2013,45:912–917.
19. Lee I, Blom UM, Wang PI, Shim JE, Marcotte EM:Prioritizing candidate disease genes by network-based boosting of genome-wide association data.Genome Res2011,21:1109–1121.
20. Jia P, Zhao Z:Network-assisted analysis to prioritize GWAS results: principles, methods and perspectives.Hum Genet2013,133:125–138. 21. Eleftherohorinou H, Wright V, Hoggart C, Hartikainen AL, Jarvelin MR,
Balding D, Coin L, Levin M:Pathway analysis of GWAS provides new insights into genetic susceptibility to 3 inflammatory diseases.PLoS One 2009,4:e8068.
22. Zhong H, Yang X, Kaplan LM, Molony C, Schadt EE:Integrating pathway analysis and genetics of gene expression for genome-wide association studies.Am J Hum Genet2010,86:581–591.
23. Buchel F, Mittag F, Wrzodek C, Zell A, Gasser T, Sharma M:Integrative pathway-based approach for genome-wide association studies: identification of new pathways for rheumatoid arthritis and type 1 diabetes.PLoS One2013, 8:e78577.
24. Zhang B, Gaiteri C, Bodea LG, Wang Z, McElwee J, Podtelezhnikov AA, Zhang C, Xie T, Tran L, Dobrin R, Fluder E, Clurman B, Melquist S, Narayanan M, Suver C, Shah H, Mahajan M, Gillis T, Mysore J, MacDonald ME, Lamb JR, Bennett DA, Molony C, Stone DJ, Gudnason V, Myers AJ, Schadt EE, Neumann H, Zhu J, Emilsson V:Integrated systems approach identifies genetic nodes and networks in late-onset Alzheimer's disease.Cell2013,153:707–720. 25. Torgerson DG, Ampleford EJ, Chiu GY, Gauderman WJ, Gignoux CR, Graves PE,
Himes BE, Levin AM, Mathias RA, Hancock DB, Baurley JW, Eng C, Stern DA, Celedon JC, Rafaels N, Capurso D, Conti DV, Roth LA, Soto-Quiros M, Togias A, Li X, Myers RA, Romieu I, Berg DJ, Hu D, Hansel NN, Hernandez RD, Israel E, Salam MT, Galanter J:Meta-analysis of genome-wide association studies of asthma in ethnically diverse North American populations.Nat Genet2011, 43:887–892.
26. Meng H, Vera I, Che N, Wang X, Wang SS, Ingram-Drake L, Schadt EE, Drake TA, Lusis AJ:Identification of Abcc6 as the major causal gene for dystrophic cardiac calcification in mice through integrative genomics.Proc Natl Acad Sci U S A2007,104:4530–4535.
27. Zhu J, Sova P, Xu Q, Dombek KM, Xu EY, Vu H, Tu Z, Brem RB, Bumgarner RE, Schadt EE:Stitching together multiple data dimensions reveals interacting metabolomic and transcriptomic networks that modulate cell regulation. PLoS Biol2012,10:e1001301.
28. Kang HP, Yang X, Chen R, Zhang B, Corona E, Schadt EE, Butte AJ: Integration of disease-specific single nucleotide polymorphisms, expression quantitative trait loci and coexpression networks reveal novel candidate genes for type 2 diabetes.Diabetologia2012,55:2205–2213.
29. Jostins L, Ripke S, Weersma RK, Duerr RH, McGovern DP, Hui KY, Lee JC, Schumm LP, Sharma Y, Anderson CA, Essers J, Mitrovic M, Ning K, Cleynen I, Theatre E, Spain SL, Raychaudhuri S, Goyette P, Wei Z, Abraham C, Achkar JP, Ahmad T, Amininejad L, Ananthakrishnan AN, Andersen V, Andrews JM, Baidoo L, Balschun T, Bampton PA, Bitton A:Host-microbe interactions have shaped the genetic architecture of inflammatory bowel disease. Nature2012,491:119–124.
30. Pulendran B, Artis D:New paradigms in type 2 immunity.Science2012, 337:431–435.
31. Zhang B, Horvath S:A general framework for weighted gene co-expression network analysis.Stat Appl Genet Mol Biol2005,4:Article17. doi:10.2202/1544-6115.1128.
32. Bousquet J, Schunemann HJ, Samolinski B, Demoly P, Baena-Cagnani CE, Bachert C, Bonini S, Boulet LP, Bousquet PJ, Brozek JL, Canonica GW, Casale TB, Cruz AA, Fokkens WJ, Fonseca JA, van Wijk RG, Grouse L, Haahtela T, Khaltaev N, Kuna P, Lockey RF, Lodrup Carlsen KC, Mullol J, Naclerio R, O'Hehir RE, Ohta K, Palkonen S, Papadopoulos NG, Passalacqua G, Pawankar R: Allergic Rhinitis and its Impact on Asthma (ARIA): achievements in 10 years and future needs.J Allergy Clin Immunol2012,130:1049–1062.
Cohain A, Difeo A, Ferringer TC, Tismenetsky M, Tsui CL, Friedlander PA, Parides MK, Banchereau J, Chaussabel D, Lebwohl MG, Wolchok JD, Bhardwaj N, Burakoff SJ, Oh WK, Palucka K, Merad M:Dissection of Immune Gene Networks in Primary Melanoma Tumors Critical for Antitumor Surveillance of Patients with Stage II-III Resectable Disease.J Invest Dermatol2014. doi:10.1038/jid.2014.85. [Epub ahead of print].
34. Yeung KY, Dombek KM, Lo K, Mittler JE, Zhu J, Schadt EE, Bumgarner RE, Raftery AE:Construction of regulatory networks using expression time-series data of a genotyped population.Proc Natl Acad Sci U S A 2011,108:19436–19441.
35. Davis RC, van Nas A, Castellani LW, Zhao Y, Zhou Z, Wen P, Yu S, Qi H, Rosales M, Schadt EE, Broman KW, Peterfy M, Lusis AJ:Systems genetics of susceptibility to obesity-induced diabetes in mice.Physiol Genomics2012, 44:1–13.
36. Yang X, Zhang B, Molony C, Chudin E, Hao K, Zhu J, Gaedigk A, Suver C, Zhong H, Leeder JS, Guengerich FP, Strom SC, Schuetz E, Rushmore TH, Ulrich RG, Slatter JG, Schadt EE, Kasarskis A, Lum PY:Systematic genetic and genomic analysis of cytochrome P450 enzyme activities in human liver.Genome Res2010,20:1020–1036.
37. Narayanan M, Vetta A, Schadt EE, Zhu J:Simultaneous clustering of multiple gene expression and physical interaction datasets.PLoS Comput Biol2010,6:e1000742.
38. Leonardson AS, Zhu J, Chen Y, Wang K, Lamb JR, Reitman M, Emilsson V, Schadt EE:The effect of food intake on gene expression in human peripheral blood.Hum Mol Genet2010,19:159–169.
39. Dobrin R, Zhu J, Molony C, Argman C, Parrish ML, Carlson S, Allan MF, Pomp D, Schadt EE:Multi-tissue coexpression networks reveal unexpected subnetworks associated with disease.Genome Biol2009,10:R55. 40. van Nas A, Guhathakurta D, Wang SS, Yehya N, Horvath S, Zhang B,
Ingram-Drake L, Chaudhuri G, Schadt EE, Drake TA, Arnold AP, Lusis AJ: Elucidating the role of gonadal hormones in sexually dimorphic gene coexpression networks.Endocrinology2009,150:1235–1249.
41. Andiappan AK, De Wang Y, Anantharaman R, Suri BK, Lee BT, Rotzschke O, Liu J, Chew FT:Replication of genome-wide association study loci for allergic rhinitis and house dust mite sensitization in an Asian population of ethnic Chinese in Singapore.J Allergy Clin Immunol2013,131:1431–1433. e1438. 42. Braunstahl GJ:United airways concept: what does it teach us about systemic inflammation in airways disease?Proc Am Thorac Soc2009, 6:652–654.
43. Yang Y, Bazhin AV, Werner J, Karakhanova S:Reactive oxygen species in the immune system.Int Rev Immunol2013,32:249–270.
44. Mabalirajan U, Dinda AK, Kumar S, Roshan R, Gupta P, Sharma SK, Ghosh B: Mitochondrial structural changes and dysfunction are associated with experimental allergic asthma.J Immunol2008,181:3540–3548. 45. Boldogh I, Bacsi A, Choudhury BK, Dharajiya N, Alam R, Hazra TK, Mitra S,
Goldblum RM, Sur S:ROS generated by pollen NADPH oxidase provide a signal that augments antigen-induced allergic airway inflammation. J Clin Invest2005,115:2169–2179.
46. Dharajiya N, Choudhury BK, Bacsi A, Boldogh I, Alam R, Sur S:Inhibiting pollen reduced nicotinamide adenine dinucleotide phosphate oxidase-induced signal by intrapulmonary administration of antioxidants blocks allergic airway inflammation.J Allergy Clin Immunol2007,119:646–653. 47. Aguilera-Aguirre L, Bacsi A, Saavedra-Molina A, Kurosky A, Sur S, Boldogh I:
Mitochondrial dysfunction increases allergic airway inflammation.J Immunol 2009,183:5379–5387.
48. Celik M, Tuncer A, Soyer OU, Sackesen C, Tanju Besler H, Kalayci O: Oxidative stress in the airways of children with asthma and allergic rhinitis.Pediatr Allergy Immunol2012,23:556–561.
49. Wright AL, Holberg CJ, Martinez FD, Halonen M, Morgan W, Taussig LM: Epidemiology of physician-diagnosed allergic rhinitis in childhood. Pediatrics1994,94:895–901.
50. Tariq SM, Matthews SM, Hakim EA, Stevens M, Arshad SH, Hide DW:The prevalence of and risk factors for atopy in early childhood: a whole population birth cohort study.J Allergy Clin Immunol1998,101:587–593. 51. Raby BA, Klanderman B, Murphy A, Mazza S, Camargo CA Jr, Silverman EK,
Weiss ST:A common mitochondrial haplogroup is associated with elevated total serum IgE levels.J Allergy Clin Immunol2007,120:351–358. 52. Reboucas JS, Spasojevic I, Batinic-Haberle I:Pure manganese (III) 5,10,15,20-tetrakis
(4-benzoic acid) porphyrin (MnTBAP) is not a superoxide dismutase mimic in aqueous systems: a case of structure-activity relationship as a watchdog
mechanism in experimental therapeutics and biology.J Biol Inorg Chem2008, 13:289–302.
53. Chang LY, Crapo JD:Inhibition of airway inflammation and hyperreactivity by an antioxidant mimetic.Free Radic Biol Med2002, 33:379–386.
54. Galanter JM, Torgerson D, Gignoux CR, Sen S, Roth LA, Via M, Aldrich MC, Eng C, Huntsman S, Rodriguez-Santana J, Rodriguez-Cintron W, Chapela R, Ford JG, Burchard EG:Cosmopolitan and ethnic-specific replication of genetic risk factors for asthma in 2 Latino populations.J Allergy Clin Immunol2011,128:37–43. e12.
55. Monda KL, Chen GK, Taylor KC, Palmer C, Edwards TL, Lange LA, Ng MC, Adeyemo AA, Allison MA, Bielak LF, Chen G, Graff M, Irvin MR, Rhie SK, Li G, Liu Y, Liu Y, Lu Y, Nalls MA, Sun YV, Wojczynski MK, Yanek LR, Aldrich MC, Ademola A, Amos CI, Bandera EV, Bock CH, Britton A, Broeckel U, Cai Q: A meta-analysis identifies new loci associated with body mass index in individuals of African ancestry.Nat Genet2013,45:690–696. 56. Wen W, Cho YS, Zheng W, Dorajoo R, Kato N, Qi L, Chen CH, Delahanty RJ,
Okada Y, Tabara Y, Gu D, Zhu D, Haiman CA, Mo Z, Gao YT, Saw SM, Go MJ, Takeuchi F, Chang LC, Kokubo Y, Liang J, Hao M, Le Marchand L, Zhang Y, Hu Y, Wong TY, Long J, Han BG, Kubo M, Yamamoto K:Meta-analysis identifies common variants associated with body mass index in east Asians.Nat Genet2012,44:307–311.
57. Emilsson V, Thorleifsson G, Zhang B, Leonardson AS, Zink F, Zhu J, Carlson S, Helgason A, Walters GB, Gunnarsdottir S, Mouy M, Steinthorsdottir V, Eiriksdottir GH, Bjornsdottir G, Reynisdottir I, Gudbjartsson D, Helgadottir A, Jonasdottir A, Jonasdottir A, Styrkarsdottir U, Gretarsdottir S, Magnusson KP, Stefansson H, Fossdal R, Kristjansson K, Gislason HG, Stefansson T, Leifsson BG, Thorsteinsdottir U, Lamb JR:Genetics of gene expression and its effect on disease.Nature2008,452:423–428.
58. Li Y, Willer CJ, Ding J, Scheet P, Abecasis GR:MaCH: using sequence and genotype data to estimate haplotypes and unobserved genotypes.Genet Epidemiol2010,34:816–834.
59. Price AL, Patterson NJ, Plenge RM, Weinblatt ME, Shadick NA, Reich D: Principal components analysis corrects for stratification in genome-wide association studies.Nat Genet2006,38:904–909.
60. Purcell S, Neale B, Todd-Brown K, Thomas L, Ferreira MA, Bender D, Maller J, Sklar P, de Bakker PI, Daly MJ, Sham PC:PLINK: a tool set for whole-genome association and population-based linkage analyses.Am J Hum Genet2007, 81:559–575.
61. Willer CJ, Li Y, Abecasis GR:METAL: fast and efficient meta-analysis of genomewide association scans.Bioinformatics2010,26:2190–2191. 62. Murphy A, Chu JH, Xu M, Carey VJ, Lazarus R, Liu A, Szefler SJ, Strunk R, Demuth K, Castro M, Hansel NN, Diette GB, Vonakis BM, Adkinson NF Jr, Klanderman BJ, Senter-Sylvia J, Ziniti J, Lange C, Pastinen T, Raby BA: Mapping of numerous disease-associated expression polymorphisms in primary peripheral blood CD4+ lymphocytes.Hum Mol Genet2010, 19:4745–4757.
63. Langfelder P, Zhang B, Horvath S:Defining clusters from a hierarchical cluster tree: the Dynamic Tree Cut package for R.Bioinformatics2008, 24:719–720.
64. Da Huang W, Sherman BT, Lempicki RA:Systematic and integrative analysis of large gene lists using DAVID bioinformatics resources.Nat Protoc2009,4:44–57.
65. Da Huang W, Sherman BT, Lempicki RA:Bioinformatics enrichment tools: paths toward the comprehensive functional analysis of large gene lists. Nucleic Acids Res2009,37:1–13.
66. Kohl M, Wiese S, Warscheid B:Cytoscape: software for visualization and analysis of biological networks.Methods Mol Biol2011,696:291–303.
doi:10.1186/1755-8794-7-48
Cite this article as:Bunyavanichet al.:Integrated genome-wide association,
coexpression network, and expression single nucleotide polymorphism analysis identifies novel pathway in allergic rhinitis.BMC Medical Genomics