O R I G I N A L R E S E A R C H
Open Access
Brain perfusion CT compared with
15
O-H
2
O-PET in
healthy subjects
Julie Marie Grüner
*†, Rune Paamand
†, Liselotte Højgaard
†and Ian Law
†Abstract
Background:Regional cerebral blood flow [rCBF] measurements are valuable for identifying angiogenically active tumours, and perfusion computed tomography [CT] has been suggested for that purpose. This study aimed to validate rCBF measurements by perfusion CT with positron-emission tomography [PET] and15O-labelled water [15 O-H2O] in healthy subjects.
Methods:RCBF was measured twice in 12 healthy subjects with15O-H2O PET and once with perfusion CT
performed over the basal ganglia. Matching rCBF values in regions of interest were compared.
Results:Measured with perfusion CT, rCBF was significantly and systematically overestimated. White matter rCBF values were 17.4 ± 2.0 (mean ± SD) mL min-1100 g-1for PET and 21.8 ± 3.4 mL min-1100 g-1for perfusion CT. Grey matter rCBF values were 48.7 ± 5.0 mL min-1100 g-1for PET and 71.8 ± 8.0 mL min-1100 g-1for perfusion CT. The overestimation of grey matter rCBF could be reduced from 47% to 20% after normalization to white matter rCBF, but the difference was still significant.
Conclusion:RCBF measured with perfusion CT does contain perfusion information, but neither quantitative nor relative values can substitute rCBF measured by15O-H2O PET yet. This, however, does not necessarily preclude a useful role in patient management.
Keywords:brain perfusion imaging, PET, oxygen radioisotopes, perfusion CT, healthy human subjects
Background
Quantitative measurement of the regional cerebral blood flow [rCBF] is a fundamental physiological parameter for characterizing the status of the brain tissue. RCBF mea-surements have important clinical implications in defin-ing tissue ischemia [1,2], in diagnosing neurodegenerative diseases [3], and in locating and monitoring angiogenically active tumour tissues [4,5]. Positron-emission tomography [PET] measurements using a freely diffusible tissue tracer, oxygen-15-labelled water [15O-H2O], is regarded as one of the rCBF gold standards [6-8]. This cumbersome technique requires on-line tracer production from a cyclotron and continu-ous arterial blood sampling. It is expensive, technically demanding, and traumatic for the patient, and is rarely found outside specialized hospital units. An attractive
alternative to PET would be dynamic contrast-enhanced computed tomography [CT] or perfusion CT. Perfusion CT methodology has improved profoundly in recent years. It is now a practical technique for the clinical environment due to the development and broad intro-duction of fast multidetector row CT systems, increasing computer power, new image acquisition protocols, and commercially available perfusion softwares [1]. It is also relatively cheap, easy, and rapid to perform. Further-more, in many acute medical and surgical conditions, such as stroke, head injury, and subarachnoid haemor-rhage, and in radiotherapy planning, cerebral CT scan-ning is often the primary imaging modality of choice. This makes perfusion CT particularly applicable for additional tissue characterization [9]. Another interest-ing application has arisen with the advent of hybrid ima-ging techniques such as PET/CT and single photon emission computed tomography/CT. In the same exami-nation, and with only minor additional scan time, perfu-sion CT can be considered as an adjunct to further * Correspondence: [email protected]
†Contributed equally
Department of Clinical Physiology, Nuclear Medicine and PET, Rigshospitalet, University of Copenhagen, Blegdamsvej 9, Copenhagen, 2100, Denmark
visualize the vascular physiology of relevant lesions. This complements and extends the physiological tissue infor-mation obtained by PET, e.g. the glucose metabolism using18F-fluorodeoxyglucose [10] or hypoxia using18 F-fluoromisonidazole [11].
However, the underlying kinetic models for rCBF measured by perfusion CT and PET with15O-H2O differ fundamentally. Perfusion CT is based on the dynamic behaviour of an intravascular contrast agent, while15 O-H2O PET models a freely diffusible tissue tracer. To investigate this further, we compared the rCBF measure-ments of the two techniques directly in the same healthy subjects on the same day within a few hours.
Materials and methods
Subjects
Seventeen healthy volunteers were recruited to the pro-tocol and scanned from August 2008 to April 2009. All subjects underwent a structured interview of health his-tory. The exclusion criteria were a known neurological disease, migraine, reduced renal function, pregnancy, and a known allergy against iodinated contrast media. All subjects gave oral and written informed consents according to the Helsinki II Declaration. The plasma creatinine levels of all subjects were measured within 2 weeks before the scan and were all within a normal range. One subject was excluded because of a technical failure in the CT iv-contrast power injector; two subjects were excluded because of failure in the arterial blood sampling during PET scanning; one subject was excluded as the arterial catheter could not be placed correctly; and in one subject, the rCBF PET kinetic modelling failed. Consequently, 12 volunteers (nine females, three males) were available for analysis with a median age of 24 years (range 20 to 26 years). The pro-tocol was approved by the Committee on Biomedical Research for the Capital Region of Denmark (protocol number H-A-2008-055).
PET protocol
Scanner
A dedicated brain high-resolution research tomograph PET scanner (CTI/Siemens, Knoxville, TN, USA) was used for all PET scans. This scanner has an axial field of view of 25 cm and a near-isotropic resolution of 2 mm. PET tracer
An 800-MBq15O-H2O was produced on-line and injected intravenously in an antecubital vein via an automatic water injection system [AWIS] (1997, Scansys, Værløse, Denmark). AWIS delivered a 16-mL bolus over 10 s with both pre- and after-flush of an inert saline solution [7]. Each volunteer had two tracer injections. A short indwel-ling catheter was placed in the non-dominant radial artery under local anaesthesia for blood sampling.
Image acquisition
During scanning, the subject’s head was rested in a foam-cushioned headrest, and a head strap was used to minimize head movement. Initially, a 6-min transmis-sion scan with a rotating137Cs single-photon point source was performed for attenuation correction. The 7-min emission scans were acquired in a three-dimen-sional [3D] list mode and initiated immediately before tracer injection. The interscan interval was at least 10 min to allow for isotope decay.
For kinetic modelling, arterial blood was sampled con-tinuously during the scans using an automatic blood sampling system [ABSS] (Allogg, Mariefred, Sweden) set to draw arterial blood at a constant speed of 8 mL/min with its activity measured every 0.5 s. The inner dia-meter of the tube connected to the arterial catheter was 1.0 mm. Immediately after the scan, 2 mL of arterial blood was drawn for blood gas analysis to evaluate the physiologic respiratory state of the subjects. The samples were analysed for arterial partial pressures of oxygen [PaO2] and carbon dioxide [PaCO2], saturation level of oxygen [sO2], and haemoglobin concentration [ctHb] (ABL 700 Series, Radiometer Medical, Copenhagen, Denmark). The detectors in the ABSS and the PET scanner were cross-calibrated against an independent dose calibrator so that all data could be reported in radioactivity concentration (in becquerel per millilitre). Image reconstruction
Dynamic images were reconstructed using a 3D-ordered subset expectation maximization algorithm with correc-tion for the measured point spread funccorrec-tion into 40 frames per scan with durations of 1 × 30, 18 × 5, 9 × 10, 10 × 15, and 2 × 30 s. Each frame consisted of 207 image planes in a 256 × 256 matrix with an isotropic voxel size of 1.22 × 1.22 × 1.22 mm3. The first 30-s frame was designed to accommodate the tracer delay from injection to the brain tissue. All images were cor-rected for dead time and scatter and filtered with a 3D Gaussian 5-mm filter.
PET CBF calculation
Using a commercially available software package, PMOD 3.0 (PMOD Technologies, Zürich, Switzerland), the dynamic images of the first 210 s following the arrival of activity to the brain and the delay- and dispersion-cor-rected arterial input functions [12] were fitted by Alpert’s one-tissue compartment model [13] according to Equation 1:
Ct(t) =f Ca(t)⊗e−(f/Vd)t (1)
per gram) is the fitted volume of distribution. ⊗ repre-sents the convolution operation. This generated the parametric images of rCBF.
Radiation dose
The dose equivalent following PET transmission and emission scans was in a total of 1.6 mSv: 0.1 mSv for the transmission scan and 0.74 mSv for each emission scan [14].
CT protocol
Scanner
A Biograph 40 TruePoint PET/CT scanner (Siemens, Knoxville, TN, USA) was used.
Contrast media
A preheated iso-osmolar iodine contrast medium OptiRay 350 (Ioversol 350 mg/mL, Tyco Healthcare, Neustadt an der Donau, Bayern, Germany) was injected intravenously by a power injector (OptiVantage DH Injection System, Liebel-Flarsheim, Cincinnati, OH, USA) as a short bolus of 40 mL (8 mL/s) through a catheter in the antecubital vein followed by 20 mL of saline solution.
Image acquisition
In nine subjects, PET scanning was performed before CT, and in three subjects, CT before PET. A lateral scout scan at the angle of the meato-orbital plane was performed followed by a non-enhanced low dose CT (120 kVp, 40 mAs). This guided the selection of four contiguous transaxial slices at the anatomical level of the third ventricle and through the basal ganglia, which is the level most frequently used in perfusion CT stroke evaluations. The orbits were not in the field of view to avoid unnecessary irradiation to the lens. The contrast medium was injected 4 s before the initiation of the dynamic scan. The dynamic scan consisted of 160 images: one image for 40 s over four slices of 7.2-mm thick at 80 kVp and 120 mAs. The arterial cannula from the PET scan was kept in place and used to draw arter-ial blood for blood gas analysis immediately after the scan.
Image reconstruction and rCBF calculation
Each slice was reconstructed into a 512 × 512 image matrix using a H30s medium smooth kernel. Voxel dimensions were non-isotropic 0.44 × 0.44 × 7.2 mm3. The rCBF was calculated in a semi-automated manner using a commercial software, Syngo Neuro Perfusion CT 2006A (Siemens, Knoxville, TN, USA). After seg-mentation and removal of an extra cerebral tissue, a cir-cular reference region of interest [ROI] was defined automatically in the occipital part of the superior sagittal sinus. Maximum intensity projection [MIP] CTs were reconstructed to enhance areas of high radiodensity that are useful for identifying vascular structures. Regions with larger vessels were excluded in the rCBF
assessments by thresholding the MIP CT image by 15% of the maximal value corresponding to a regional cere-bral blood volume [rCBV] threshold of 14.4 mL/100 mL. The arterial input function was derived from the time-attenuation curve from ROIs comprising both anterior cerebral arteries in cross section, and the rCBF (in millilitre per minute per 100 mL) was calculated using a deconvolution approach. By dividing with the brain tissue density of 1.04 g/mL, the rCBF values were converted into units per weight tissue as for rCBF PET. Radiation dose
The effective dose equivalent was 2.9 mSv for the CT perfusion protocol.
Data analysis
Image co-registration and ROIs
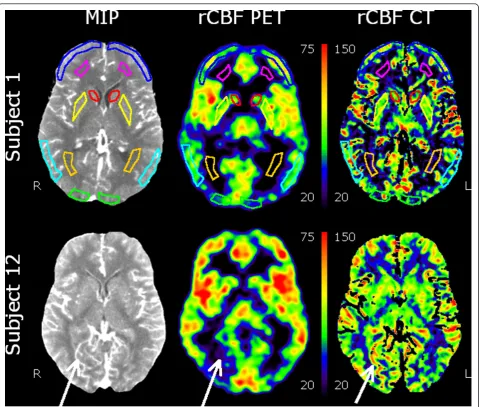
Using PMOD, rCBF PET, rCBF CT, and MIP CT images were co-registered to the low-dose CT scan of the head to a final voxel size of 0.5 × 0.5 × 1.5 mm3. This was done to insure that all ROIs referred to and included an identical tissue composition across techni-ques. On the MIP CT images, 14 ROIs were drawn in symmetrical areas over the grey matter in the head of the caudate nuclei, putamen, frontal cortex, temporal/ parietal cortex, occipital cortex, and anterior and poster-ior white matter (Figure 1, top). By using a masking technique on the rCBF CT images, values below zero inside ROIs were excluded from analysis. In one subject, the putamen could not be drawn because it was only partly included in the scanned area. Finally, the 14 ROIs were projected onto identical areas of the masked para-metric rCBF PET and rCBF CT images for quantifica-tion. The tissue volume in the ROIs ranged from 109 to 407 mm3
(average 247 mm3). We then calculated the volume-weighted average white and grey matter values based on the selected ROIs.
Statistical methods
The statistical analysis was conducted using MATLAB (MathWorks Inc., Natick, MA, USA). Paired ttests with a two-tailed significance level ofa = 0.05 was used to evaluate the blood gas data. A similar method was used for the analyses between rCBF CT and the average of two rCBF PET scans for white and grey matter ROIs.
comparisons) and p < 0.005 (10 comparisons) for the quantified and white matter normalized analyses, respectively.
The Bland-Altman test [19] was used to assess the agreement between corresponding grey matter measure-ments. The mean difference, standard deviations, and the 95% limits of agreement were calculated and plotted. The rCBF measures were plotted against each other for each subject individually using linear regression analyses; the linear slopes were determined; and the coefficient of deter-mination [r2] between the two methods was calculated.
Results
Blood gas analyses
Air bubbles in one syringe and malfunction of one arterial catheter left a total of 11 subjects for this analy-sis (Table 1). There was no significant change in blood gas levels and haemoglobin concentration between the first and the second PET scan. However, when compar-ing the averaged blood gas levels of the two PET scans to the gas values measured immediately after CT, there was a modest, but significant drop in PaCO2 of approxi-mately 0.3 kPa or 2 mmHg. At the same time, there was
a slight, but non-significant (p= 0.07), increase in PaO2 of approximately 1.0 kPa or 7 mmHg. The data indicate slight hyperventilation during the performance of perfu-sion CT and confirm that no discernable effects of the approximately 100-mL blood drawn during PET scan-ning could be found in the haemoglobin concentration.
RCBF measures
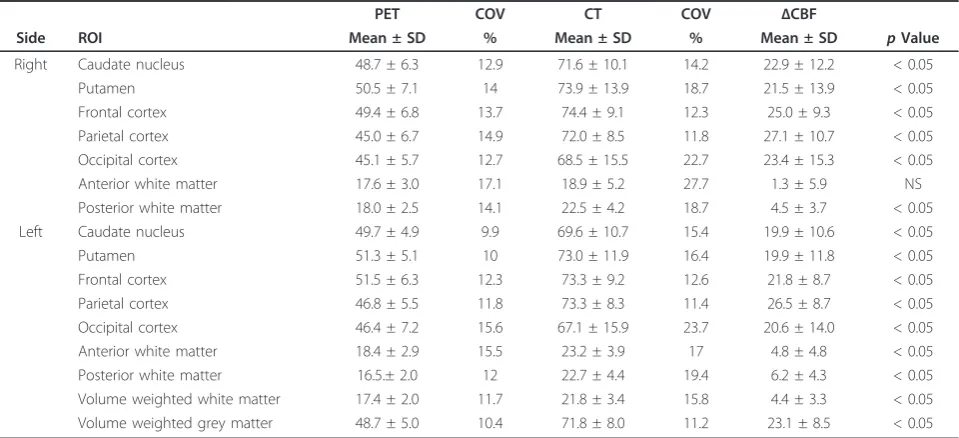
There was no significant difference between the two rCBF PET measurements. The absolute measurements are summarised in Table 2. The average volume-weighted rCBF PET measurements were 17.4 ± 2.0 mL min-1 100 g-1(mean ± standard deviation) for the white matter and 48.7 ± 5.0 mL min-1 100 g-1 for the grey matter with a between-subject regional coefficient of variance [COV] in the 10% to 17% range. In all regions but one white matter ROI, the absolute rCBF measure-ments with perfusion CT were significantly higher than the PET measurements even after a rigid Bonferroni
correction. The average volume-weighted rCBF mea-surements with perfusion CT were 21.8 ± 3.4 mL min-1 100 g-1 for the white matter and 71.8 ± 8.0 mL min-1 100 g-1 for the grey matter. The COVs were higher than the rCBF PET measurements in 11 of 14 ROIs ranging from 11% to 28%. The mean increase compared to rCBF PET was 4.4 ± 3.3 mL min-1100 g-1 in the white matter and 23.1 ± 8.5 mL min-1 100 g-1 in the grey matter (Table 2). The lower and upper 95% limits of the grey and white matter changes from PET to CT rCBF were -8.0 and 43.4 mL min-1100 g-1, respectively (Figure 2). The overall mean volume-weighted grey matter/white matter ratio was 2.78 ± 0.25 for rCBF PET, and it was significantly higher for perfusion CT, 3.34 ± 0.48 (Table 3). On the regional level, the ratios were significantly higher in the right caudate nucleus, in the frontal and parietal cortices, and in the left parietal cortex. Interest-ingly, compared to the absolute measurements, the regional COVs were reduced in seven out of ten regions for rCBF PET, but increased in eight out of ten for rCBF CT. Thus, normalization to the white matter reduced the volume-weighted grey matter COV for rCBF PET from 10.4% to 9.1%, while it was increased for rCBF CT from 11.2% to 14.3%.
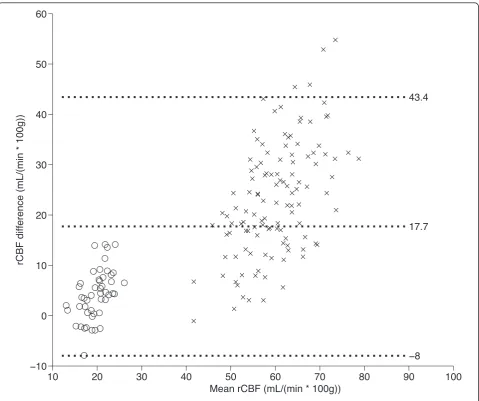
The Bland-Altman plots demonstrated a bias for rCBF CT that increases from lower to higher mean grey and white matter values (Figure 2). The linear slopes between the two methods when including both white and grey matter values were significantly different from zero in all individuals with an average r2 of 0.89 (range 0.82 to 0.96) and an average slope of 1.56 (range 1.20 to Table 1 Blood gas measurements
RCBF PET RCBF CT
(n= 11) Mean ± SD Mean ± SD pValue
PaCO2(kPa) 5.51 ± 0.50 5.23 ± 0.42 < 0.01
PaO2(kPa) 13.80 ± 1.37 14.77 ± 1.19 NS
ctHb (mmol/L) 8.22 ± 0.69 8.12 ± 0.73 NS sO2(%) 0.98 ± 0.01 0.99 ± 0.00 NS
RCBF, regional cerebral blood flow; CT, computed tomography; PET, positron-emission tomography; SD, standard deviation; NS, non-significant; PaCO2,
arterial tension of carbon dioxide; PaO2, arterial tension of oxygen; ctHb,
haemoglobin concentration; sO2, oxygen saturation.
Table 2 RCBF measurements from PET and perfusion CT scanning
PET COV CT COV ΔCBF
Side ROI Mean ± SD % Mean ± SD % Mean ± SD pValue
Right Caudate nucleus 48.7 ± 6.3 12.9 71.6 ± 10.1 14.2 22.9 ± 12.2 < 0.05 Putamen 50.5 ± 7.1 14 73.9 ± 13.9 18.7 21.5 ± 13.9 < 0.05 Frontal cortex 49.4 ± 6.8 13.7 74.4 ± 9.1 12.3 25.0 ± 9.3 < 0.05 Parietal cortex 45.0 ± 6.7 14.9 72.0 ± 8.5 11.8 27.1 ± 10.7 < 0.05 Occipital cortex 45.1 ± 5.7 12.7 68.5 ± 15.5 22.7 23.4 ± 15.3 < 0.05 Anterior white matter 17.6 ± 3.0 17.1 18.9 ± 5.2 27.7 1.3 ± 5.9 NS Posterior white matter 18.0 ± 2.5 14.1 22.5 ± 4.2 18.7 4.5 ± 3.7 < 0.05 Left Caudate nucleus 49.7 ± 4.9 9.9 69.6 ± 10.7 15.4 19.9 ± 10.6 < 0.05 Putamen 51.3 ± 5.1 10 73.0 ± 11.9 16.4 19.9 ± 11.8 < 0.05 Frontal cortex 51.5 ± 6.3 12.3 73.3 ± 9.2 12.6 21.8 ± 8.7 < 0.05 Parietal cortex 46.8 ± 5.5 11.8 73.3 ± 8.3 11.4 26.5 ± 8.7 < 0.05 Occipital cortex 46.4 ± 7.2 15.6 67.1 ± 15.9 23.7 20.6 ± 14.0 < 0.05 Anterior white matter 18.4 ± 2.9 15.5 23.2 ± 3.9 17 4.8 ± 4.8 < 0.05 Posterior white matter 16.5.± 2.0 12 22.7 ± 4.4 19.4 6.2 ± 4.3 < 0.05 Volume weighted white matter 17.4 ± 2.0 11.7 21.8 ± 3.4 15.8 4.4 ± 3.3 < 0.05 Volume weighted grey matter 48.7 ± 5.0 10.4 71.8 ± 8.0 11.2 23.1 ± 8.5 < 0.05
10 20 30 40 50 60 70 80 90 100 −10
0 10 20 30 40 50 60
17.7
−8 43.4
Mean rCBF (mL/(min * 100g))
rCBF difference (mL/(min * 100g))
Figure 2Bland-Altman plot of the difference between rCBF CT and rCBF PET against their mean values. The middle line indicates the mean difference. The outer lines indicate 95% limits of agreement. The rCBF CT values are biased and are all larger than the rCBF PET values, and the difference increases with increasing mean rCBF values. Cross mark, grey matter; empty circle, white matter.
Table 3 Relative rCBF grey matter measurements from PET and perfusion CT scanning normalized to white matter
PET COV CT COV ΔCBF
Side ROI Mean ± SD % Mean ± SD % Mean ± SD pValue
Right Caudate nucleus 2.77 ± 0.26 9.4 3.32 ± 0.55 16.6 0.56 ± 0.40 < 0.05 Putamen 2.90 ± 0.30 10.4 3.39 ± 0.62 18.3 0.44 ± 0.65 NS
Frontal cortex 2.81 ± 0.30 10.5 3.47 ± 0.60 17.2 0.66 ± 0.52 < 0.05 Parietal cortex 2.56 ± 0.35 13.6 3.37 ± 0.67 19.8 0.81 ± 0.67 < 0.05 Occipital cortex 2.58 ± 0.34 13.3 3.17 ± 0.64 20.2 0.59 ± 0.72 NS
Left Caudate nucleus 2.84 ± 0.33 11.6 3.24 ± 0.62 19 0.40 ± 0.45 NS Putamen 2.96 ± 0.28 9.4 3.36 ± 0.66 19.7 0.37 ± 0.66 NS
Frontal cortex 2.94 ± 0.31 10.4 3.41 ± 0.56 16.3 0.48 ± 0.52 NS Parietal cortex 2.67 ± 0.34 12.7 3.43 ± 0.64 18.5 0.76 ± 0.70 < 0.05 Occipital cortex 2.65 ± 0.40 15 3.12 ± 0.77 24.8 0.47 ± 0.69 NS
Volume weighted grey matter 2.78 ± 0.25 9.1 3.34 ± 0.48 14.3 0.56 ± 0.47 < 0.05
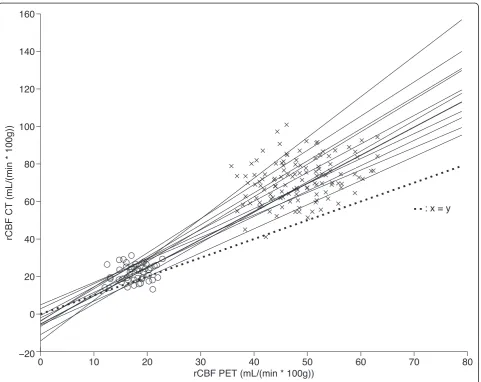
2.17; Figure 3). When only the grey matter regions were analysed, the slopes were only significant in 4 of 12 sub-jects. These four subjects had r2 of 0.40 to 0.50 and slopes between 0.5 and 1.75.
Discussion
In this study, we have compared the quantitative rCBF values that can be obtained by two imaging techni-ques,15O-H2O PET and perfusion CT. To date, studies that directly validate perfusion CT in healthy subjects have been very scarce. The majority of studies concern patients with cerebrovascular disease, and validation has been against either the stable xenon-CT method [20,21] or15O-H2O PET [22]. Although rCBF can be derived from the non-ischemic hemisphere in stroke patients, the design is suboptimal. It is quite possible that regio-nal perfusion in the undamaged hemisphere is
influenced to some degree by either a subclinical tissue pathology, a generalised micro- or macrovascular dis-ease, remote functional effects of neural damage (dia-schisis), or a co-morbidity (cardiac function, pulmonary disease). Particularly the quality of the bolus input gives errors in the rCBF determination, e.g. bolus buffering in the lungs. Therefore, a reduced cardiac output will sys-tematically decrease rCBF [23]. Similarly, in patients with carotid occlusion, selection of a single arterial input function will cause increased delay and dispersion of the contrast agent to the ischemic areas and thus, underestimate rCBF by 15% to 20% [24].
As the greater part of the validation studies is aimed at cerebrovascular diseases, the regions used focus on the major cerebral artery territories or whole hemi-spheres. Thus, the rCBF measures are a heterogeneous mixture derived from both the white and grey matter
0 10 20 30 40 50 60 70 80
−20 0 20 40 60 80 100 120 140 160
: x = y
rCBF PET (mL/(min * 100g))
rCBF CT (mL/(min * 100g))
tissues, vascular volumes, and cerebrospinal fluid spaces, but the relative weights of the individual tissue compo-nents are unknown [21,22,24-26]. This will render direct comparison between our quantitative grey matter rCBF CT values and these studies difficult.
In studies where the white and grey matter rCBF CT values are available, these range from 14 to 30 mL min-1 100 g-1 and 40 to 70 mL min-1 100 g-1, respectively, with a COV of 25% to 30% [6,20,23,27]. Although mostly derived from patient studies, these results are quite similar to the results we found in normal healthy subjects. We found average volume-weighted rCBF CT measurements of 21.8 ± 3.4 mL min-1 100 g-1 for the white matter and 71.8 ± 8.0 mL min-1100 g-1 for the grey matter. The relative regional between-subject COV ranged from 11% to 28%. The rCBF CT values were sig-nificantly larger than the average volume-weighted rCBF PET measurements by 25% in the white matter and 47% in the grey matter. The absolute values were 17.4 ± 2.0 mL min-1100 g-1 for the white matter and 48.7 ± 5.0 mL min-1100 g-1 for the grey matter with a COV in the 10% to 17% range. Our findings correspond to the values previously reported in the literature using this technique [7,8,13,28,29]. In a larger Japanese study encompassing 70 healthy subjects spanning 11 institu-tions, the overall average rCBF for cerebral cortical regions were 42.7 ± 6.3 mL min-1100 g-1 with a COV of 14.6% [30].
When normalizing to the white matter, the relative regional grey matter COV was nominally lower with PET compared to CT in 10 of 14 ROIs. One explanation for the lower COV with PET was that we used the aver-age of two measurements. This was not done for perfu-sion CT to keep the radiation dose within acceptable limits. To our knowledge, a test-retest study of baseline rCBF CT has not been reported on healthy subjects.
In the study design, we have tried to limit the varia-tion between the two techniques further by performing same-day measurements within 1 to 2 h. A further source of variation, which has not been considered in previous validation studies, is the impact that changes of the pre-scan arterial blood gas status might have on rCBF [29]. The PaCO2 decreased significantly by 2 mmHg from PET to CT scanning, suggesting slight hyperventilation. Hyperventilation decreases rCBF by washing out PaCO2by approximately 2% per millimetre of mercury [31,32]. This would decrease the rCBF CT measurements by 4% and further increase the difference between techniques if corrected for. The hyperventila-tion itself may have been caused by anticipatory anxiety in the CT scanning session possibly associated to the procedure itself. Mood states in scanning sessions have been investigated by Matthew et al. [28], and a trend was found for anticipatory anxiety to be lowered from
the first to second scans. This may have been forestalled by letting the subjects rest in the CT scanner for several minutes before scans and maybe even perform a ‘ sham-scan’before scans.
The bias between techniques was not constant, but increased with the increasing rCBF value (Figure 2), which indicates a logarithmic influence. It is possible that there are global effects in a measurement that influ-ences the regional values. This could be between-subject differences, physiological fluctuations, or methodological errors pertaining to the measurement of the input func-tion and the involved correcfunc-tions [32,33] or in the selec-tion of the venous ROI and the arterial input funcselec-tion in perfusion CT [23,34]. One strategy is to normalize the rCBF to the tissue that systematically co-varies with the global fluctuations and is not affected by isolated pathological processes. We examined this hypothesis using the white matter as a reference tissue. For the overall grey matter, the normalized rCBF in perfusion CT was only 20% larger than that for PET. Thus, more than half of the difference between techniques can be explained by global fluctuations affecting both tissues alike, but there is a residual effect manifest as a larger contrast between the white and grey matter tissues in perfusion CT. Interestingly, normalization to the white matter reduced the grey matter COV in PET, but increased the COV in perfusion CT, indicating that there are individual grey/white matter differences to be considered. Thus, prior to the use of tissue normaliza-tion in a clinical setting, it is essential that effects of bias and noise are well understood.
One aspect that also needs to be examined is the effect of differences in resolution, the partial volume effect [PVE]. The PVE will of course affect not only PET values, but also PCT values, as the resolution of both methods is insufficient to accurately quantify the rCBF in the cortical grey matter. The object of the paper, however, was not so much to measure‘true’ cor-tical rCBF, but to compare two methods under clinical conditions. So the strategy was to have the PVE affect the two methods to the same degree, rather than to introduce a new level of complexity and potential bias by PVE correction through e.g. tissue-segmented MRI. This was done by securing comparable image resolu-tions and an accurate image registration between the two imaging modalities. Thus, any error caused by tissue heterogeneity in a given ROI would affect the sampled values to the same degree. We do not believe that the differences between methods can be related to image resolution.
that is freely diffusible into the tissues. Strictly speaking, the term ‘rCBF’should only be reserved to denote the volume flow rate of blood though a functional tissue that has the ability to exchange nutrients and waste pro-ducts, thus, the capillary blood flow. However, a purely intravascular tracer, as iodine contrast, will distribute to all vascular segments. Thus, a fundamental flaw with perfusion CT is the presence of high-contrast signals in regions without a functional tissue and a capillary bed such as the choroid plexus, arteries, arterioles, venules, veins, and sinuses. An example can be seen in Figure 1, where a draining vein in the left occipital region has an rCBF signal increase on perfusion CT without any dis-cernable signal on15O-H2O-PET, indicating the absence of a functional tissue. The most common strategy is to eliminate vascular pixels in the CT images before calcu-lation of rCBF. A simple regional rCBV threshold of 8 mL/100 g has been suggested as the most accurate [6]. This threshold, however, was not feasible in our study as large and irregular sections of the brain parenchyma were excluded from analyses. We, thus, chose a thresh-old of 14.4 mL/100 g that respected tissue integrity and kept the rCBF CT images legible for clinical use. The grey matter rCBV has been measured to 3 to 4 mL/100 g [30,35], so both thresholds are somewhat above the normal tissue rCBV level. In the ROI definitions, we carefully omitted obvious larger vascular structures, but there is definitely a contribution from smaller non-capil-lary vessels and probably also from a PVE from larger vessels. We regard that the blood volume influenced the signal as the dominant error source in the overestima-tion of rCBF CT values, in the increased contrast between the white and grey matter, and as an important regional noise contribution. This has been recognized previously as well [6,36,37].
Although biased, we found that the rCBF CT does correlate with rCBF PET for each individual over a broad range of values from the white to the grey matter (Figure 3), but poorly if only grey matter rCBF values were considered. Previous studies in patients have found
r2
ranging from 0.5 to 0.8 with significant linear regres-sion slopes of 0.7 to 1.4 [20,22,38,39] and in healthy subjects, r2 from 0.4 to 0.9 with slopes 1.0 to 1.55 [6,25]. The significant correlations signify that rCBF CT does deliver a perfusion-weighted signal, but with a ten-dency to overestimate the values particularly for highly perfused regions.
Conclusion
Although perfusion CT is an attractive, widely avail-able, relatively cheap, rapid, and easily performed method, we have not been able to confirm some of the previously published reports of high accuracy per-formed mainly on patients with cerebrovascular
disease. Perfusion CT is not accurate enough in the current setting. In healthy subjects, perfusion CT does deliver a perfusion-weighted signal, but with a ten-dency to overestimate the values particularly for highly perfused regions. The average overestimation of rCBF in the grey matter of 47% is unacceptably high. Neither with respect to absolute quantification nor perfusion distribution can rCBF CT measures substitute rCBF PET, primarily because of the confounding effects of blood volume. This does not exclude a useful role in patient management, which must, however, be evalu-ated in separate investigations with the normative data in mind.
Abbreviations
CBF: cerebral blood flow; CT: computed tomography;15O-H2O:15O-labelled
water; PET: positron-emission tomography; rCBF: regional CBF.
Authors’contributions
IL conceived the study. JG, LH, and IL participated in the design of the study. JG and IL coordinated the study, and JG carried out the scannings. RP performed the statistical analysis. All authors drafted the manuscript and read and approved the final manuscript.
Competing interests
The authors declare that they have no competing interests.
Received: 23 September 2011 Accepted: 18 November 2011 Published: 18 November 2011
References
1. Miles KA:Brain perfusion: computed tomography applications.
Neuroradiology2004,46:s194-s200.
2. Coles JP:Imaging of cerebral blood flow and metabolism.Curr Opin Anaesthesiol2006,19:473-480.
3. Waldemar G:Functional brain imaging with SPECT in normal aging and dementia.Methodological, pathophysiological, and diagnostic aspects. Cerebrovasc Brain Metab Rev1995,7:89-130.
4. Cha S:Update on brain tumor imaging: from anatomy to physiology.
AJNR Am J Neuroradiol2006,27:475-487.
5. Aref M, Chaudhari AR, Bailey KL, Aref S, Wiener EC:Comparison of tumor histology to dynamic contrast enhanced magnetic resonance imaging-based physiological estimates.Magn Reson Imaging2008,26:1279-1293. 6. Kudo K, Terae S, Katoh C, Oka M, Shiga T, Tamaki N, Miyasaka K:
Quantitative cerebral blood flow measurement with dynamic perfusion CT using the vascular-pixel elimination method: comparison with H2(15) O positron emission tomography.AJNR Am J Neuroradiol2003,24:419-426. 7. Law I, Iida H, Holm S, Nour S, Rostrup E, Svarer C, Paulson OB, :
Quantitation of regional cerebral blood flow corrected for partial volume effect using O-15 water and PET: II. Normal values and gray matter blood flow response to visual activation.J Cereb Blood Flow Metab
2000,20:1252-1263.
8. Iida H, Law I, Pakkenberg B, Krarup-Hansen A, Eberl S, Holm S, Hansen AK, Gundersen HJ, Thomsen C, Svarer C, Ring P, Friberg L, Paulson OB: Quantitation of regional cerebral blood flow corrected for partial volume effect using O-15 water and PET: I. Theory, error analysis, and stereologic comparison.J Cereb Blood Flow Metab2000,20:1237-1251. 9. Miles KA:Perfusion imaging with computed tomography: brain and
beyond.Eur Radiol2006,16:M37-M43.
10. Chen W:Clinical applications of PET in brain tumors.J Nucl Med2007, 48:1468-1481.
11. Bruehlmeier M, Roelcke U, Schubiger PA, Ametamey SM:Assessment of hypoxia and perfusion in human brain tumors using PET with 18F-fluoromisonidazole and 15O-H2O.J Nucl Med2004,45:1851-1859. 12. Alpert NM, Eriksson L, Chang JY, Bergstrom M, Litton JE, Correia JA,
regional cerebral blood flow using short-lived tracers and emission tomography.J Cereb Blood Flow Metab1984,4:28-34.
13. Treyer V, Jobin M, Burger C, Teneggi V, Buck A:Quantitative cerebral H2 (15)O perfusion PET without arterial blood sampling, a method based on washout rate.Eur J Nucl Med Mol Imaging2003,30:572-580. 14. Radiation dose to patients from radiopharmaceuticals (addendum 2 to
ICRP publication 53). Ann ICRP1998,28:1-126.
15. Friston KJ, Frith CD, Liddle PF, Dolan RJ, Lammertsma AA, Frackowiak RS: The relationship between global and local changes in PET scans.J Cereb Blood Flow Metab1990,10:458-466.
16. Eastwood JD, Provenzale JM:Cerebral blood flow, blood volume, and vascular permeability of cerebral glioma assessed with dynamic CT perfusion imaging.Neuroradiology2003,45:373-376.
17. Eastwood JD, Lev MH, Wintermark M, Fitzek C, Barboriak DP, Delong DM, Lee TY, Azhari T, Herzau M, Chilukuri VR, Provenzale JM:Correlation of early dynamic CT perfusion imaging with whole-brain MR diffusion and perfusion imaging in acute hemispheric stroke.AJNR Am J Neuroradiol
2003,24:1869-1875.
18. Ziegelitz D, Starck G, Mikkelsen IK, Tullberg M, Edsbagge M, Wikkelsö C, Forssell-Aronson E, Holtås S, Knutsson L:Absolute quantification of cerebral blood flow in neurologically normal volunteers: dynamic-susceptibility contrast MRI-perfusion compared with computed tomography (CT)-perfusion.Magn Reson Med2009,62:56-65. 19. Bland JM, Altman DG:Statistical methods for assessing agreement
between two methods of clinical measurement.Lancet1986,1:307-310. 20. Wintermark M, Thiran JP, Maeder P, Schnyder P, Meuli R:Simultaneous
measurement of regional cerebral blood flow by perfusion CT and stable xenon CT: a validation study.AJNR Am J Neuroradiol2001, 22:905-914.
21. Kanazawa R, Kato M, Ishikawa K, Eguchi T, Teramoto A:Convenience of the computed tomography perfusion method for cerebral vasospasm detection after subarachnoid hemorrhage.Surg Neurol2007,67:604-611. 22. Bisdas S, Donnerstag F, Berding G, Vogl TJ, Thng CH, Koh TS:Computed
tomography assessment of cerebral perfusion using a distributed parameter tracer kinetics model: validation with H(2)((15))O positron emission tomography measurements and initial clinical experience in patients with acute stroke.J Cereb Blood Flow Metab2008,28(2):402-411. 23. Klotz E, Konig M:Perfusion measurements of the brain: using dynamic
CT for the quantitative assessment of cerebral ischemia in acute stroke.
Eur J Radiol1999,30:170-184.
24. Kamath A, Smith WS, Powers WJ, Cianfoni A, Chien JD, Videen T, Lawton MT, Finley B, Dillon WP, Wintermark M:Perfusion CT compared to H(2) (15)O/O (15)O PET in patients with chronic cervical carotid artery occlusion.Neuroradiology2008,50:745-751.
25. Sase S, Honda M, Machida K, Seiki Y:Comparison of cerebral blood flow between perfusion computed tomography and xenon-enhanced computed tomography for normal subjects: territorial analysis.J Comput Assist Tomogr2005,29:270-277.
26. Bisdas S, Nemitz O, Berding G, Weissenborn K, Ahl B, Becker H, Donnerstag F:Correlative assessment of cerebral blood flow obtained with perfusion CT and positron emission tomography in symptomatic stenotic carotid disease.Eur Radiol2006,16:2220-2228.
27. Koenig M, Kraus M, Theek C, Klotz E, Gehlen W, Heuser L:Quantitative assessment of the ischemic brain by means of perfusion-related parameters derived from perfusion CT.Stroke2001,32:431-437. 28. Matthew E, Andreason P, Carson RE, Herscovitch P, Pettigrew K, Cohen R,
King C, Johanson CE, Paul SM:Reproducibility of resting cerebral blood flow measurements with H2(15)O positron emission tomography in humans.J Cereb Blood Flow Metab1993,13:748-754.
29. Rostrup E, Knudsen GM, Law I, Holm S, Larsson HB, Paulson OB:The relationship between cerebral blood flow and volume in humans.
Neuroimage2005,24:1-11.
30. Ito H, Kanno I, Kato C, Sasaki T, Ishii K, Ouchi Y, Iida A, Okazawa H, Hayashida K, Tsuyuguchi N, Ishii K, Kuwabara Y, Senda M:Database of normal human cerebral blood flow, cerebral blood volume, cerebral oxygen extraction fraction and cerebral metabolic rate of oxygen measured by positron emission tomography with 15O-labelled carbon dioxide or water, carbon monoxide and oxygen: a multicentre study in Japan.Eur J Nucl Med Mol Imaging2004,31:635-643.
31. Ito H, Kanno I, Ibaraki M, Suhara T, Miura S:Relationship between baseline cerebral blood flow and vascular responses to changes in PaCO2
measured by positron emission tomography in humans: implication of inter-individual variations of cerebral vascular tone.Acta Physiol (Oxf)
2008,193:325-330.
32. Lassen NA:Cerebral blood flow and metabolism in health and disease.
Res Publ Assoc Res Nerv Ment Dis1966,41:205-215.
33. Iida H, Kanno I, Miura S, Murakami M, Takahashi K, Uemura K:Error analysis of a quantitative cerebral blood flow measurement using H2(15)O autoradiography and positron emission tomography, with respect to the dispersion of the input function.J Cereb Blood Flow Metab1986, 6:536-545.
34. Hoeffner EG, Case I, Jain R, Gujar SK, Shah GV, Deveikis JP, Carlos RC, Thompson BG, Harrigan MR, Mukherji SK:Cerebral perfusion CT: technique and clinical applications.Radiology2004,231:632-644.
35. Martin WR, Powers WJ, Raichle ME:Cerebral blood volume measured with inhaled C15O and positron emission tomography.J Cereb Blood Flow Metab1987,7:421-426.
36. Wintermark M, Maeder P, Thiran JP, Schnyder P, Meuli R:Quantitative assessment of regional cerebral blood flows by perfusion CT studies at low injection rates: a critical review of the underlying theoretical models.Eur Radiol2001,11:1220-1230.
37. Hoeffner EG:Cerebral perfusion imaging.J Neuroophthalmol2005, 25:313-320.
38. Shinohara Y, Ibaraki M, Ohmura T, Sugawara S, Toyoshima H, Nakamura K, Kinoshita F, Kinoshita T:Whole-brain perfusion measurement using 320-detector row computed tomography in patients with cerebrovascular steno-occlusive disease: comparison with 15O-positron emission tomography.J Comput Assist Tomogr2010,34:830-835.
39. Gillard JH, Minhas PS, Hayball MP, Bearcroft PW, Antoun NM, Freer CE, Mathews JC, Miles KA, Pickard JD:Assessment of quantitative computed tomographic cerebral perfusion imaging with H2(15)O positron emission tomography.Neurol Res2000,22:457-464.
doi:10.1186/2191-219X-1-28
Cite this article as:Grüneret al.:Brain perfusion CT compared with15 O-H2O-PET in healthy subjects.EJNMMI Research20111:28.
Submit your manuscript to a
journal and benefi t from:
7Convenient online submission 7Rigorous peer review
7Immediate publication on acceptance 7Open access: articles freely available online 7High visibility within the fi eld
7Retaining the copyright to your article