Weather Test 2 Study Guide Name ________Key_______________________Date _______ Period ___ Air Masses, Fronts, and Storms
1. Indicate the moisture level, temperature, and formation location of the following air masses: Air Mass abbreviation Moisture Level
(humid-or-dry)
Temperature (warm-or-cold)
Formation Location (over land-or-over water)
maritime tropical mT humid warm over water
maritime polar mP humid cold over water
continental tropical cT dry warm over land
continental polar cP dry cold over land
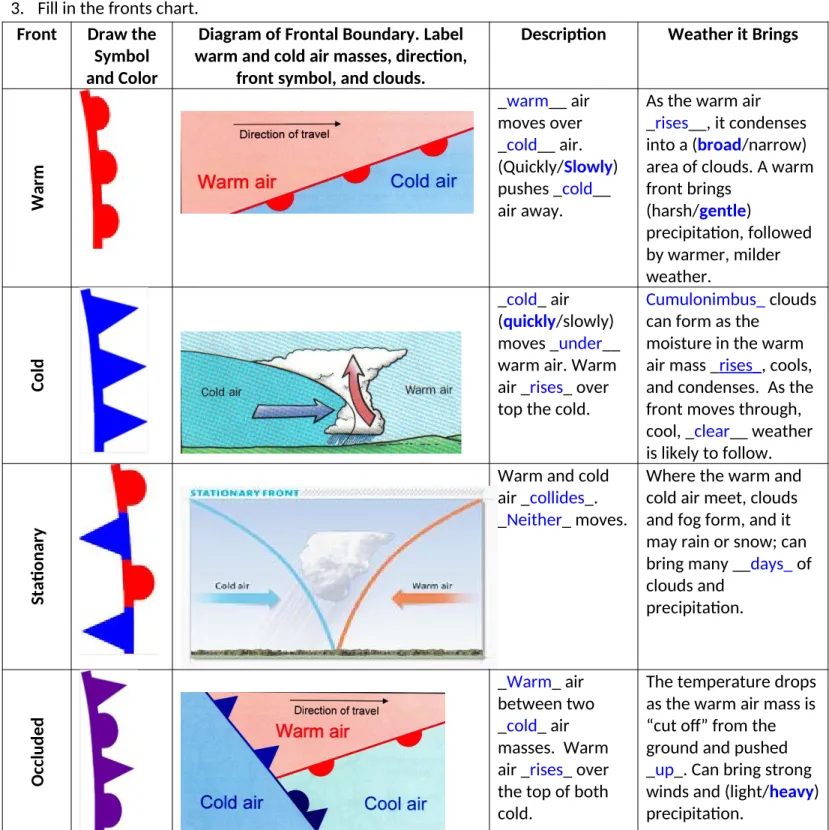
2. Fronts are colliding boundaries between _air masses___. 3. Fill in the fronts chart.
Front Draw the Symbol and Color
Diagram of Frontal Boundary. Label warm and cold air masses, direction,
front symbol, and clouds.
Description Weather it Brings
W ar m _warm__ air moves over _cold__ air. (Quickly/Slowly) pushes _cold__ air away.
As the warm air _rises__, it condenses into a (broad/narrow) area of clouds. A warm front brings
(harsh/gentle)
precipitation, followed by warmer, milder weather. C o ld _cold_ air (quickly/slowly) moves _under__ warm air. Warm air _rises_ over top the cold.
Cumulonimbus_ clouds can form as the
moisture in the warm air mass _rises_, cools, and condenses. As the front moves through, cool, _clear__ weather is likely to follow.
St ati o n ar y
Warm and cold air _collides_. _Neither_ moves.
Where the warm and cold air meet, clouds and fog form, and it may rain or snow; can bring many __days_ of clouds and precipitation. O cc lu d e d _Warm_ air between two _cold_ air masses. Warm air _rises_ over the top of both cold.
4. Fill out the chart for Low and High Pressure Systems. Low Pressure
System (L)
Draw a diagram illustrating this air
movement and weather.
Each system should have one choice written in the chart for
each category below.
High Pressure System
(H)
Draw a diagram illustrating this air movement and weather.
warm air Air Temperature
(cold air-or-warm air)
cold air
rising air Air Movement
(rising air-or-sinking air)
sinking air
CCW inward Rotation (CW
outward-or-CCW inward)
CW outward
Low density Density (high
density-or-low density)
High density
cloudy/rainy/ stormy
Resulting Weather (clear
skies-or-cloudy/rainy/st orms)
clear skies
5. Explain the differences between a thunderstorm, tornado, and hurricane. Important Details/Descriptions
Thunderstor m
thunder, lightning, heavy rains, strong winds. Along a cold front or in an air mass.
Tornado funnel-shaped cloud that extends down from a storm cloud, on land around frontal systems. Hurricane low pressure tropical storm, forms over warm ocean water.
Weather Tools and Technology
6. The weather forecast says we have a 60% chance of rain. Our baseball game is at 5:00 pm and it hasn’t rained yet. What type of technology should I use to track the possible time and intensity the rain that may come through Greer? __________radar______________
7. I would love to track cloud movement for the next hurricane. What type of technology should I use to see cloud movement? _____satellite______________________
8. How might the weather change if the barometric pressure changes from 999 to 1020 mb? stormy to fair weather
9. How might the weather change if the barometric pressure changes from 1040 to 1000 mb? fair weather to cloudy and higher chance of rain.
10. Fill in the Weather Tool Chart
Tool Tool Name
thermomet er
sling-psychrometer
weather
vane anemometer rain gauge barometer
Measures temp. relative-humidity
wind direction (comes from)
wind speed rainfall air pressure
C or F mL atm, pascals, psi
11. Describe the weather for each station model: Interpret the station
model data below.
Temp (F) 24 ˚ 95 ˚ 55 ˚
Cloud Cover overcast overcast scattered
Precipitation moderate snow thunderstorm w/ rain light rain
Wind Speed (knots) 35 knots 15 knots 15 knots
Wind Direction: (from) NW SE SW
Pressure (mb) 997.9 mb 1010.3 mb 1013.8 mb
12. Draw the station model for the following cities. Draw the station models
on the circles given to the right for Cities A, B, and C based on the data below.
City A City B City C
Air Temperature 70 °F 62 °F 43 °F
Dew point 65 °F 33 °F 43 °F
Air Pressure 1005.7 mb 1040.3 mb 993.4 mb
Wind direction SW calm NE
Wind Magnitude 15 knots - (none) 60 knots
Cloud coverage 75 % no clouds 100 %
Present weather light rain - (none) Thundershowers
13. The image to the right is a(n) weather map____________. 14. a. Describe the weather
conditions for the Great Lakes region located near Michigan and Wisconsin (near the 992 mb pressure line).
cloudy, rainy, windy, CCW b. What are the weather conditions like in the northwest U.S. (near Idaho)?
clear and calm c. What is your weather prediction for the southeast U.S.?
Winds and Ocean Currents
15. Winds are created when air moves from _high__ to _low__ pressure. Wind creation is affected by convection currents created from warm air ____rising_______ and cold air ____sinking_____. 16. What can cause a city to have stronger winds? Circle 1 from each set of answers.
(weaker-or-stronger convection currents), (higher-or-lower pressure system), (close-or-far apart isobars) 17. What three things contribute to climate zones?
-unequal heating of Earth due to convection at various latitudes, -temperature differences between the equator and the poles, -because of warm and cold surface ocean currents.
18. Explain the differences between how land and water interact with solar energy. Land takes up and releases heat quickly. Water- slowly.
-regulates global temperatures
19. Draw a globe (may be Northern Hemisphere only) and label the equator, 30⁰N, 60⁰N, and 90⁰N. Label the 3 global winds and draw the wind direction and the 3 convection regions.
20. Draw a land breeze and sea breeze. Label the type of breeze, high and low pressure, arrows of air movement, day and night. You may want to include a flag to show the direction of wind movement.
21. Explain how and where (the direction) Jet streams move? Draw and label a diagram of the two main northern hemisphere jet streams. How: Jet streams fast moving ribbons of air
Where: west to east around the Earth.
22. In an experiment, is the IV the cause-or-the measured effect? __cause__
23. In a controlled investigation, how many variables should purposefully change? __one__ 24. Controlled variables reduce the possible effects of outside influences, they should be kept the
_(same)______ for all experimental groups.
H L
Sea Breeze
H
L
Land Breeze
Cold
25. Experiments are more valid and reliable if they have more __trials____.
26.Draw a basic data table and graph. Label Independent Variable (IV) and Dependent Variable (DV) placement.
IV DV
Climate Factors: Use the diagram below to answer the next set of questions.
27. Which City is colder (City A or City B)? _B_ How do you know? higher latitude
28. Which City is colder (City C or City D)? _C_ How do you know? higher
elevation (on the mountain)
29. Which City has a higher range of temperatures in a 24-hour period (City E or City F)? _F_ How do you know? _on land so has higher day temp and lower night temp (absorbs and loses heat faster than water)_
30. Which City has a more regulated temperature in a 24-hour period (City E or City F)? _E_ How do you know? _near water (water absorbs and loses heat slower than land)_
31. Which City has a drier climate (City E or City F)? _F_ How do you know? more inland (not close to water)
32. What is Ocean Current “H” in the Pacific Ocean? __California current__ Describe the temperature. _cold_
33. How does Ocean Current “H” affect the climate of City I? ___makes it colder and moist___
34. What is Ocean Current “G” in the Atlantic Ocean? __Gulf Stream__ Describe the temperature. _warm_
35. How does Ocean Current “G” affect the climate of City J? _makes it warmer and moist_
36. City L is in what climate region? How do you know? _Tropical, between 0 and 30 degrees N latitude_
37. City J is in what climate region? How do you know? _Temperate, between 30 and 60 degrees N latitude_
38. City K is in what climate region? How do you know? _Polar, above 60 degrees N latitude_
39. What direction do weather systems generally move in the temperate region? _west to east_
Why? _Westerlies Global Winds, Jet Stream_
40. What Global wind and air mass type most affects Cities K and B? _Polar Winds and continental polar_
41. What Global wind most affects City L? How does it affect the climate of City L? _Trade Winds, brings warm moist air from East to West_