70
Simultaneous estimation of Gallic acid, Curcumin and Quercetin by HPTLC
method
Vinitkumar Y. Thakker*1,Vaishali N. Shah1, Uravashi D. Shah1, Manish P. Suthar2 1. Department of Pharmacognosy, A.P.M.C. College of Pharmaceutical Education &
Research, Himatnagar, India.
2. A.R College & G. H. Patel Institute of Pharmacy, V.V. Nagar, India.
*Corresponding author: [email protected]
ABSTRACT:
There are number of Polyherbal formulation available for psoriasis but standardization
is essential for ensuring quality control of Polyherbal formulation. The aim of this study
was to formulate psoriasis tablets and to standardize it by HPTLC using gallic acid,
curcumin and quercetin as a biomarker. Chromatography was performed on silica gel
60F254 percolated TLC plate using toluene: ethyl acetate: forminc acid (4.5:3.0:0.2,
v/v/v) as solvent system. Densitometry scanning was performed under
reflectance-absorbance mode at 366 nm to quantify the spots. The Rf values of gallic acid,
curcumin and quercetin are 0.40, 0.73 and 0.55 respectively. The total peak areas of
the standards (gallic acid, curcumin and quercetin) and the corresponding peak areas
of extracts were compared and the Gallic acid, curcumin and quercetin contents were
estimated to be 1.860, 1.682 and 0.4693 % w/w. The HPTLC method was validated as
per the ICH guideline and to be simple, precise, specific, sensitive and accurate and can
be used for routine quality control of raw material as well as formulation containing any
of these compounds.
Keywords: Gallic acid, Curcumin, Quercetin, HPTLC, Standardization.
INTRODUCTION:
Psoriasis is a common chronic inflammatory dermatosis. Person of all ages may develop
the disease [1]. In Ayurveda, there are three kinds of psoriasis called “Kitibha”,
“Ekakushtha” and “Charmakhya” [2].
The effect of psoriasis on a patient is multidimensional, encompassing the physical,
social, and psychological health of the person and is based largely on the patient’s view
of condition. Indeed, the effect on the quality of life of the patient is far greater than
what is suggested by the overall clinical severity of psoriasis, as assessed by the
71
In modern treatment topical medications are used but they produce disadvantages like
skin irritation, dilated blood vessels, increased risk of skin aging, skin cancer with
long-term treatment etc., Because of these disadvantages with the available treatments,
there is a need for more safe and more effective approaches. The present study
polyherbal formulation, psoriasis tablet whose major ingredients include Azadirachta
indica Linn., Curcuma longa Linn., Rubia cordifolia Linn., Tinospora cordifolia Willd.,
Acacia catechu Wildand others.
Herbal medicines are prepared from materials of plant origin which are prone to
contamination, deterioration and variation in composition thus posing problems for
quality control. There may be batch to batch variation, quality control of raw material,
process control and quality control of finished products. Several external factors like
environmental, genetic, methods of cultivation, collection, harvest time, preparation,
storage etc., also affects quality of herbal drugs. Hence standardization is essential for
ensuring quality control of Herbal drugs [4].
So, in the present study deals with Development of Polyherbal formulation for psoriasis
this was developed in our institute and its standardization. Formulation was
standardized by using gallic acid, curcumin and quercetin as a biomarker by HPTLC
analysis.
MATERIALS AND METHODS:
Preparation of extract
The medicinal plants which were used for the preparation of the polyherbal formulation,
the plant was identified and authenticated by the botanist Mr. M. M. Prajapati, H.N.S.B
Science College, Himatnagar, and voucher specimen was retained in our laboratory
(APMC 1101-1108). Methanolic extract of polyherbal formulation was prepared by
distillation method. The extract was filtered using whatman filter paper and then
concentrated in vacuum and dried.
Reagents and other materials
Gallic acid, curcumin and quercetin [Natural remedies, Bangaluru], toluene, acetone,
ethyl acetate, dichloromethane, formic acid, glacial acetic acid and methanol [all
Reagents of analytical grade, E-Merck] and silica gel 60F254 precoated TLC aluminium
plates [E-Merck].
72
ApparatusSpotting device: Linomat V Automatic Sample Spotter; CAMAG (Muttenz, Switzerland)
Syringe: 100µL Hamilton (Bonadzu, Switzerland)
Thin layer chromatography (TLC) Chamber: Glass with trough chamber (20×10 ×4 cm)
(CAMAG)
Densitometer: TLC scanner 3 linked to WinCats Software (CAMAG)
HPTLC plates: 10×10 cm, 0.2 mm thickness precoated with silica gel 60 F254 (E. Merck,
Mumbai, India)
Experimental conditions: Temperature 25 ± 2 ºC, relative humidity 40 %
Preparation of standard and sample solutions
Standard solution of gallic acid
A stock solution of gallic acid was prepared by dissolving 10 mg of accurately weighed
gallic acid in methanol and making up the volume to 10 ml with methanol to get the
final concentration of 1mg/ml.
Standard solution of curcumin
A stock solution of curcumin was prepared by dissolving 10 mg of accurately weighed
curcumin in methanol and making up the volume to 10 ml with methanol to get the
final concentration of 1 mg/ml.
Standard solution of quercetin
A stock solution of quercetin was prepared by dissolving 10 mg of accurately weighed
quercetin in methanol and making up the volume to 10 ml with methanol to get the
final concentration of 1 mg/ml.
Preparation of sample solutions
Sample solution was prepared by dissolving 50 mg of the methanolic extract of
formulation in methanol and making up the volume to 5 ml to get the concentration of
73
Calibration curve for gallic acid, curcumin and quercetin
Exactly 10 µl of each of the standard solution of gallic acid, curcumin and quercetin
were applied in triplicate on TLC plates. The plates were developed in a solvent system
of toluene: ethyl acetate: formic acid (4.5: 3: 0.2) at 25 ± 20C temperature and 40%
relative humidity and allowed to travel up to a distance of 8 cm. After development the
plates were dried in air and scanned densitometrically at 366 nm for gallic acid,
curcumin and quercetin. The peak areas were recorded. Calibration curves of gallic
acid, curcumin and quercetin were prepared by plotting peak areas versus
concentration.
Quantification of gallic acid, curcumin and quercetin
Exactly 10 µl of sample solution was applied in triplicate on a pre-coated silica gel 60
F254 TLC plate (0.2 mm thickness) with the Linomat V Automatic sample Spotter. The
Plate was developed in the solvent system of toluene: ethyl acetate: formic acid (4.5: 3:
0.2) and scanned at 366 nm for gallic acid, curcumin and quercetin. The amount of
gallic acid, curcumin and quercetin in the sample was calculated using the respective
calibration curves.
Validation of the method
ICH guidelines were (CPMP/ICH/381/95; CPMP/ICH/281/95) followed for the
validation of the analytical procedure. The method was validated for precision,
repeatability and accuracy. The repeatability of the method was checked by repeated
scanning of the same spot of gallic acid (800 ng), curcumin (600 ng) and quercetin (200
ng) , seven times and was expressed as coefficient of variance (% CV). Variability of the
method was studied by analyzing aliquots of the standard solution of gallic acid (800,
1000, 1200 ng), curcumin (600, 800, 1000 ng) and quercetin (200, 600, 1000 ng) on the
same day (intra-day precision) and on different days (inter-day precision) and the
results were expressed as % CV. Accuracy of the method was tested by performing
recovery studies at three levels (50%, 100% and 150% addition). The percent recovery
as well as average percent recovery was calculated. For the determination of limit of
detection and limit of quantification, different dilutions of the standard solutions of
gallic acid, curcumin and quercetin were applied along with methanol as well as the
74
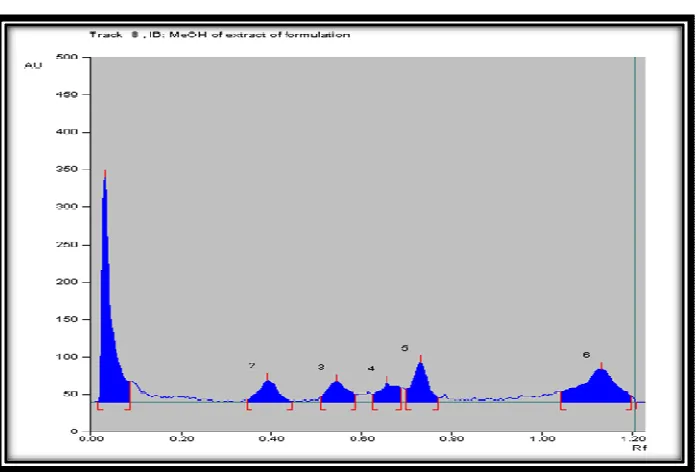
RESULTS AND DISCUSSION:Different concentration of standard solution of gallic acid, curcumin and quercetin were
applied in triplicate on HPTLC plates and methanolic extract of formulation was applied
on HPTLC plate for estimation of gallic acid, curcumin and quercetin. The HPTLC plates
were developed in a solvent system toluene: ethyl acetate: formic acid (4.5: 3: 0.2,
v/v/v) and dried in air and scanned densitometrically at 366 nm for gallic acid,
curcumin and quercetin.
The peak areas were recorded. The method was validated in terms of precision,
repeatability and accuracy (Table II and III). The relationship between the concentration
and peak response was linear within the range of 600 to 1500 ng/spot for gallic acid,
200 to 1000 ng/spot for curcumin and 200 to 1500 ng/spot for quercetin with
correlation coefficient of 0.9918, 0.9969 and 0.9969 respectively.
The % recovery of gallic acid was found to be 98.70%, 99.34%, 99.51% , for curcumin
was found to be 98.95%, 99.00%, 99.28% and for quercetin was found to be 98.69%,
99.09%, 99.17%. Average recovery was found to be 99.18% for gallic acid, 99.07% for
curcumin and 98.98% for quercetin.
The HPTLC method was developed for simultaneous quantification of gallic acid,
curcumin and quercetin in presence of other plant constituents. The proposed method
was found to be precise, simple, specific and sensitive.
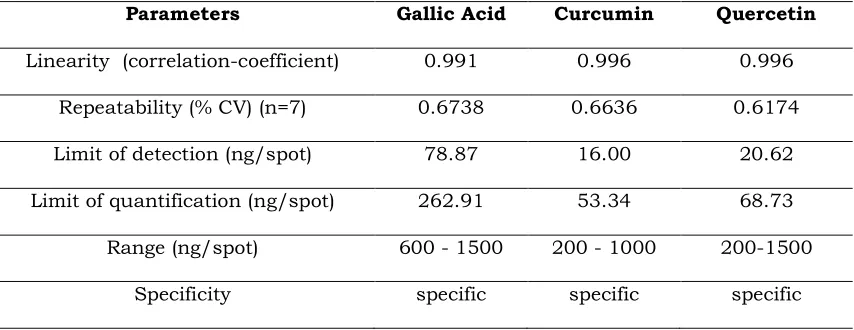
Table 1. Method of Validation parameters for estimation of biomarker compound by HPTLC
Parameters Gallic Acid Curcumin Quercetin
Linearity (correlation-coefficient) 0.991 0.996 0.996
Repeatability (% CV) (n=7) 0.6738 0.6636 0.6174
Limit of detection (ng/spot) 78.87 16.00 20.62
Limit of quantification (ng/spot) 262.91 53.34 68.73
Range (ng/spot) 600 - 1500 200 - 1000 200-1500
75
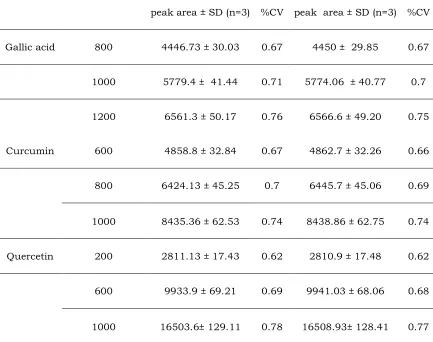
Table 2: Data for Validation and precision of Intraday and Interday precision for Gallic acid, Curcumin and Quercetin
Biomarker
Concentration
(ng/spot) Intraday Interday
peak area ± SD (n=3) %CV peak area ± SD (n=3) %CV
Gallic acid 800 4446.73 ± 30.03 0.67 4450 ± 29.85 0.67
1000 5779.4 ± 41.44 0.71 5774.06 ± 40.77 0.7
1200 6561.3 ± 50.17 0.76 6566.6 ± 49.20 0.75
Curcumin 600 4858.8 ± 32.84 0.67 4862.7 ± 32.26 0.66
800 6424.13 ± 45.25 0.7 6445.7 ± 45.06 0.69
1000 8435.36 ± 62.53 0.74 8438.86 ± 62.75 0.74
Quercetin 200 2811.13 ± 17.43 0.62 2810.9 ± 17.48 0.62
600 9933.9 ± 69.21 0.69 9941.03 ± 68.06 0.68
1000 16503.6± 129.11 0.78 16508.93± 128.41 0.77
76
Table 3. Recovery study of marker compound by proposed HPTLC method
Biomarker Amount in sample
(ng)
Amount added
(ng)
Peak area Amount found
Recovery Average Recovery
Gallic acid 300 150 1985.08 ± 14.89 444.15 98.70%
99.18%
300 300 2869.56 ± 22.13 596.05 99.34%
300 450 3575.19 ± 26.90 746.35 99.51%
Curcumin 80 40 914.16 ± 7.122 118.74 98.95%
99.07%
80 80 1299.53 ± 9.78 158.4 99.00%
80 120 1535.32 ± 11.67 198.56 99.28%
Quercetin 100 50 1786.52 ± 13.62 148.04 98.69%
98.98%
100 100 2537.51 ± 19.56 198.18 99.09%
100 150 3267.26 ± 25.26 247.94 99.17%
Values are expressed as Mean ± SD (n = 3)
77
Fig. 2. HPTLC Chromatogram of Gallic acid
78
Fig. 4. HPTLC Chromatogram of Quercetin
Correlation coefficient: 0.991, Slope: 5.664 Intercept: 156.6
79
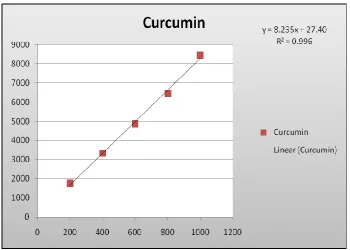
Correlation coefficient: 0.996, Slope: 8.235 Intercept: 27.40
Fig. 6. Calibration curve for standard Curcumin (Concentration Vs peak area)
Correlation coefficient: 0.996, Slope: 16.47 Intercept: 141.5
80
CONCLUSION:A TLC densitometric method is established for the simultaneous quantification of gallic
acid, curcumin and quercetin from polyherbal formulation Psoriasis using HPTLC
fingerprinting. The methods were found to be simple, precise, specific, sensitive and
accurate and can be used for their quantification in plant materials and also in routine
quality control of the raw materials as well as formulations containing any of these
compounds.
ACKNOWLEDGEMENTS:
The authors are thankful to the Department of Pharmacognosy, A.P.M.C. College of
Pharmaceutical Education & Research, Himatnagar, for their help during this research
work.
REFERENCES:
1. Walter L.F., Schaumburg G., Histopathology of the skin Boston, Massachusetts.
1981; 156 - 164.
2. Bajracharya, M.B. Ayurveda- The science of life series – vol.14, 2nd ed. Piyushvarshi
Aushadhalaya Publishers: 2003.
3. Weiss S.C., Kimball A.B., Liewehr D.J., Blauvelt A., Turner M.L., Emanuel E.J.
Quantifying the harmful effect of psoriasis on health-related quality of life. J Am
Acad Dermatol.2002; 47:512-518.
4. Agrawal, S.S. Paridhavi, M. Herbal Drug Technology, Universities Press (India)