Notebook provides data not easily found elsewhere, background descriptions of important aspects of the energy system and reports on new developments. Contributions are invited.
Thierry Lefevre is Professor and Bui Duy Thanh is Research Associater School of Environment Re-sources and Development, Asian Institute of Tech-nologyfThailand.
Notebook
Energy Efficiency and
Conservation in Thailand:
Analysis of the 1980-1992 Period
THIERRY LEFEVRE and BUI DUY THANH
1. Introduction
Energy conservation and improvements in end-use energy efficiencies are recognized as
very important components of energy policies, not only because they allow to reduce the bur-den of the energy import bill and to avoid the negative impacts of international energy shocks, but also because they allow to
con-serve domestic energy resources and the
envi-ronment. This paper examines the energy de-velopment and the evolution of energy effi-ciency and conservation in Thailand during the period 1980-1992. Energy efficiency
per-formanceinThailand is examinedvis-a-vis the
analysis of the economic development and the energy demand management policies of the country during that period. A set of
quantita-tive indicators at the macroeconomic level, as
efficiency indicators includes the following:
• Primary/jinal energy intensities,defined as the ratio of total primary /final energy consump-tion to CDP at constant prices.
• Sectoral energy intensities,defined as the ratio of energy consumption to the corresponding sectoral value added (VA) at constant prices. This is ap plied to the industrial and commer-cial sectors. For the transport sector, energy intensity is defined as the ra tio of energy con-sumption to CDP at constant prices.
o Unit energy consumption,defined as the ratio
of energy consumption in the given sub-sector or end-use to outputs expressed in physical terms or number of devices(e.g.,ton of oil equivalent (toe) per ton of steel; or kilogram of oil equivalent (kgoe) of gasoline per car).
o An index is associated with each indica tor, defined as the ratio of the value of this indicator in a given year over its value in the base year(e.g., 1980). These indices are more convenient for examining the evolution of energy efficiency indica tors over time.
For the calculation of these indicators, only commercial energies are taken into considera-tion and no attempt is made to account for traditional fuels, due to the unavailability of data.
2. Economic and Energy Development
During the period 1980-1992, the Thai econ-omy changed remarkably. This can be seen by looking at the transformation of the volume and structure of the country's CDP. Over this period, real CDP more than doubled, going from Baht1913.7 billion in 1980 to Baht 2270.5 billion in 1992 (expressed in constant 1988 prices), growing at an average annual rat~of 7.9% (Office of the National Economic and So-cial Development Board 1990). Since 1987 Thailand has been enjoying the strongest eco-nomic boom in its history. The annual CDP growth rate averaged around 12% during the period 1987-1990. Even though the economy slowed down in subsequent years (1991-1992),
1/ Baht is the unit of Thai currency (US$ 1 ~ 25 Baht, approximately).
growth remained as high as 7.5% annually. Thailand is undergoing a rapid transfor-mation from an agriculture-based to an indus-trialized economy. Between 1980 and 1992, the share of agriculture in CDP decreased from 22 to 14%, while the share of industry increased from to 31 to 41%. Table 1 depicts some key indicators showing the remarkable economic development of Thailand during that period.
2.1 Primary Energy Supply
In Thailand, the role of renewable energy sources such as fuel wood, charcoal, paddy husk, and bagasse remains significant. How-ever; modern energy production has increased very rapidly, in line with the accelerated de-velopment of the Thai economy in the last decade. During the 1980-1992 period, the share of renewable energy has fallen substantially, being replaced by increasing domestic sup-plies of lignite, natural gas, and oil. This trend is expected to continue in the late 1990s.
The rapid expansion of lignite production (due mainly to the expansion of the Mae Moh power plant from 225 megawatt (MW) in 1980, to 2025 MW in 1992) and natural gas produc-tion has changed the energy supply structure considerably. In 1992 Thailand produced about 15.3 million tons of lignite and 305.3 bil-lion standard cubic feet (scf) of natural gas. The share of natural gas and lignite in total primary energy supply in 1992 reached 20 and 12% respectively, as compared with only 8.2 and 4.3% in 1980 (Department of Energy De-velopment and Promotion; various issues).
The total primary supply of oil and petroleum products in 1992 amounted to 23 million tons of oil equivalent (Mtoe) or 63% of total primary supply, of which 91% came from imports.
2.2 Final Energy Consumption
of the planned and remaining hydro power potential. In 1990, hydroelectricity supplied only 4.7% of the total primary energy supply in Thailand.
1/kilograms of oil equivalent
SOlace:Authors' calculations based on Na tional Sta-tistical Office, Office of the Prime Minister (1992); Office of the National Economic and Social Devel-opment Board (1990); Asian Development Bank (1992).
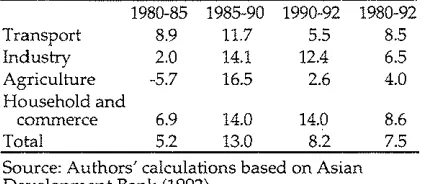
Final energy consumption increased rapidly in . the period 1980-1992. Total final consumption of commercial energy in 1992 was 25.416 Mtoe, which was roughly three times the volume consumed in 1980 (Department of Energy De-velopment and Promotion, various issues). As Table 2 indicates, energy consumption growth was especially high in the second half of the 1980s (1985-1990), when it reached 13% per year, as compared with 5.2% in the first half (1980-1985).Inthe early 1990s, this growth rate dropped to 8.2% per annum, which was still very high. For the period 1980-1992, the mea-sured elasticity of energy demand with respect to GOP was equal to 1.16, indicating that the rate of increase in energy consumption ex-ceeded the growth rate ofGOP.
Even though the role of petroleum prod-ucts in the final fuel mix has gradually fallen - clear evidenceofthe success of government policies aimed at reducing oil import depen-dency - petroleum products remained by far the most consumed fuels in Thailand. Thus in 1992, petroleum products accounted for 77% of
8.6 7.5 14.0
8.2 14.0
13.0 6.9
5.2
1980-85 1985-90 1990-92 1980-92
8.9 11.7 5.5 8.5
2.0 14.1 12.4 6.5
-5.7 16.5 2.6 4.0
3. Energy Demand Management
Policies
As with other Asian developing countries, the main objectives of Thailand's national energy policies are ensuring reliable energy supplies to satisfy the growing demand that results from rapid economic growth, by diversifying energy supply sources and mobilizing domes-tic energy sources to alleviate the burden of the energy import bill. However, since the mid-1980s, rational use of energy, energy con-servation and efficiency improvements, and active participation by the private sector in the the final consumption of modern energy, slightly lower than its 87% share in 1980. This red uction in the market share of petroleum products was compensated by an increased penetration of electricity and lignite, which saw.their market share increase by 4 and 6 percentage points, respectively, during the 1980-1992 period (Figure 1).
As can be seen from Figure 2, energy con-sumption in all the economic sectors increased almost uniformly between 1980 and 1992, with the transport sector accounting for the largest share (52.2%) of total final energy consump-tion at the end of that period. Energy con-sumption for transport purposes grew at an average rate of 8% per year, resulting in a threefold increase over the period (from 4.28 Mtoe in 1980, to 12.65 Mtoe in 1992). A sub-stantial increase in energy consumption was also recorded in the industrial and the residen-tial/commercial sectors. Average household energy consumption growth was around 8.6%, and average industrial energy consumption growth was nearly 6.5%.
Source: Authors' calculations based on Asian Development Bank (1992).
Transport Industry Agriculture Household and
commerce Total
Table 2: Final Energy Consumption Growth Rate (%per annum)
9.7% 7.2%
7.1% 1.79% 7.9% 6.0% Growth Rate
(1980-1992) Avg. Annual
Value (1992) 513,115
57.79 110.3 1909
448
625
845
Land area, (km2) Population (million) CDP, billion($US)
Per capita CDP(SUS)
Per capita primary energy consumption (kgoe)l
Per capita final energy consumption (kgoe) Per capita electricity
consumption (k"Wh)
1980
1992
Coal
&
lignite
1%
Electricity
12%
Coal
&
lignite
7%
Electricity
16%
Petroleum
prod.
87%
Figure 1: Final Energy Consumption Fuel Mix
Source: Deparhnent of Energy Development and Promotion
25000
2CXXXl
g;
15000
:2
1CXXXl
5000
o
Petroleum
prod.
77%
Res/com
!II
AgricultJre
~.1 Industry
Transport
o ~ N M ~ ~ ~ ~ ro m 0 N
ro ro ro ro ro ro ro ro ro ro m ~ m
Figure2: Final Energy Consumption by Sectors
Source: Department of Energy Development and Promotion
energy and electric power industries have gradually emerged as the main trends in the country's energy demand management poli-cies.
At present, Thailand has a fairly compre-hensive energy demand management frame-work. This ·framework is the result of a long
the first oil crisis, and continues to be strength-ened today. Energy demand management measures in the early days (right after 1973, and until 1982) was mainly comprised of direct restrictive regulations by the government. Ex-amples of such regulations are restrictions on the operating hours of gas stations, limits on street lighting intensity and time, bans on the use of lighting for advertising purposes, and tight controls of the distribution of final en-ergy, These measures, though simplistic, were necessary interventions by the government to remedy the energy shortage that followed the oil crises.
Realizing that energy conservation man-agement was a complex issue requiring a sys-tematic approach, the Thai government turned towards more sophisticated and credible mea-sures to develop energy demand management policies. The Fifth Five-Year Plan (1982-1986) marked the beginning of a new phase in the development of energy conservation strategies in Thailand.Itwas here that energy conserva-tion objectives were explicitly stated as part of the energy plan. In subsequent Five-Year Plans, energy conservation strategies were re-inforced by adding concrete programs, such as the Demand Side Management Program and the Energy Conservation Program, with its specified quantitative targets for energy con-servation in every economic sector,2 to become today's comprehensive framework.
Energy management measures initiated during the 1980s also included changes in en-ergy pricing policies aimed at eliminating subsidies, the creation of centers and programs whose main functions were campaigning and providing services related to the rational use of energy and to efficiency improvements. In April 1985, the Energy Conservation Center of Thailand (ECCT) was established with the twin objectives of carrying out public educa-tion campaigns and providing energy man-agement services to the industrial and com-mercial sectors. ECCT then launched several
2/ For example, in the Sixth Five-Year Plan (1987-1991), the energy conservation target was to save 2.45 million barrels of oil equivalent annually in the transport, industrial, and residential sectors.
programs to fulfill its mandate,e.g., the Energy
Audit Program (EAP), the Energy Information Dissemination and Training Program (EIDIT), and the Energy Technology Demonstration Program (ETDP). Every year between 1986 and 1991, ECCT conducted energy audits on about 100 factories to collect data on key pa-rameters, such as combustion efficiencies, power factors, and equipment efficiencies. As a result, energy audit reports aimed at provid-ing, for individual factories, overviews of their energy situation and of their energy conserva-tion potential, as well as at providing technical measures for energy use improvements have been prepared.
The establishment in 1986 of the National Energy Policy Council (NEPC) and the Na-tional Energy Policy Office (NEPO), strong and centralized institutions to oversee energy policy issues and to advise the government in this area, completed the institutional arrange-ments necessary for the further realization of the country's energy conservation strategies.
The beginning of the Seventh Five-Year Plan (1991-1996) is a milestone in the devel-opment history of the Energy Management Strategies of Thailand. In 1991, the first de-mand-side management (DSM) project in the electric power system was finalized - the first ever DSM project to be implemented in the entire Southeast Asia region. This DSM pro-gram called for electricity conservation through the implementation of a series of pro-grams(e.g., a lighting program in the
residen-tial sector, lighting and air conditioning pro-grams in the commercial sectors, an efficient motors program in the industrial sector). This five-year DSM program was launched with a budget of $(US)189 million and a target of re-ducing peak demand by 238 MW and saving 1,428 gigawatt-hour (GWh) of electricity by 1997 (Electricity Generating Authority of Thai-land, 1995).
and assistance measures. Regarding energy conservation in the industrial and the com-mercial sectors, the Act defines three target groups: "designated factories;"3 "designated buildings;" and "producers and distributors of machinery, equipment with high efficiency, and material used in energy conservation." The Act also further defines the scope of activi-ties to be applied to designated factories and buildings, duties and responsibilities of their owners, and also penalties against violators. All these conditions are detailed in a Royal Decree and a series of Ministerial Regulations issued under the Act (Department of Energy Development and Promotion 1995).
The Energy Conservation Promotion Fund has been established by transferring the rev-enue generated by a small levy (0.07 Baht per liter) on refined petroleum products. The ini-tial allocation to the fund was 1.5 billion Baht, or $(US)60 million, with an expected annual capital inflow of 1.5 to 2 billion Baht ($(US)60-80 million). The main purpose of the Fund is to encourage designated factories and designated buildings to carry out energy conservation, as required by the Act. In addition, the Fund is also used for providing financial incentives for renewable energy projects, energy research development, and the dissemination of energy efficiency technologies and personnel training. With the promulgation of the Energy Con-servation Act, the implementation of the DSM program, and more recently the initiation of power sector privatization, Thai national strategies on energy conservation and effi-ciency have gained strength, laying down the foundations for the future achievement of en-ergy conservation and efficiency improve-ments in the actual socio-economic context.
3/ Designated factories are defined as those with installed electrical capacity above 1 MW or total en-ergy consumption of more than 20 terajoules (TJ) per year.
4. Evolution of Energy Efficiency
Indicators
4.1 Primary and Final Energy Intensities
of
GOPOverall energy intensity, which is defined as the ratio of total annual energy consumption to
COP, shows the performance of the economy with respect to energy use at the most aggre-gated level. Throughout the 1980-1992 period, Thainland's overall energy intensity exhibited a general upward trend, with some fluctuations (Figure 3). In 1980, the final en-ergy intensity of Thailand's CDP was 293 tonnes of oil equivalent per million US dollars (toe/M$US) at 1986 prices. In 1992, the corre-sponding value was 334 toe/M$US at 1986 prices. All in all, a 15% increase was recorded for the en tire period. In the first years of this period (1980-1982), a drop of as much as 10% in final energy intensity was observed, but over the following years this trend was re-versed and energy in tensity increased contin-ually.
A comparison of trends in the evolution of energy intensity and energy prices (Figure 4) shows a strong influence of the latter on en-ergy intensity. Decreases in enen-ergy intensityin
Thailand were recorded in the early 1980s - the years following the second oil shock, when the government removed subsidies from energy prices. As a result, the prices of all energy sources in 1982 were double their 1979 levels (Asian Development Bank, 1992). This sudden price surge obviously played a key role in the declining trend of energy intensity. From 1982 to 1984, as energy prices recovered from the oil shock, energy intensity rose up back to its 1980 level.Infact, a 15% drop in oil product prices was recorded during these years. The correla-tion of the two graphs given in Figures 3 and 4 indicates that, as energy prices stabilized and then went down starting in 1982, the country's overall energy intensity began an upward trend that lasted until the end of the period under consideration.
take-115
~
110!
~
I
8
105t
'is
.5
~
100t
95~
~
90 L+I-+-I-f-I-11-+1-+-1-+--+---+-+-1-+--41a ...- N ("') ""¢ l{) ( 0 1"'- co en 0 "I""' N
co ro co co co co co co co co 0 ) (J') m
Figure 3: Evolution of GDP Energy Intensities, 1980-1992
160
150
140
0'
130
0
~
II 0 120
co
a>
:::.
110 x <I> 'C100
.E
90
80
c::>
co
N 0")..,.
li'l""
"- co'"
0co co co co CD CD CD co CD
'"
Figure 4: Energy Price Index in Thailand, 1980-1992 Source: Asian Development Bank, 1992
- - - a - Final energy intensity
- - - - f r - Final energy
intensity at constant GDP structure
.. Oil product
III Electricity
- - + - - Aver. energy
off of Thailand's economy, which achieved very high growth rates in this particular pe-riod. The increase in energy intensity, which in this case means a faster growth of energy con-sumption in comparison with an already high
GDP growth, can be attributed to: i) the substi-tution of traditional fuels by commercial ones as the result of the on-going process of eco-nomic modernization; ii) a very fast increasein
sec-tors, such as transportation and residen-tial/ commercial; and iii) an increased share of energy intensive industries, which usually oc-curs in booming developing countries like Thailand.
Figure 3 also displays the variation in the final energy intensity calculated based on the GDP structure of the Thai economy in base year 1980. This indicator was derived by as-suming that the shares of value added of the industrial, commercial, and agricultural sec-tors in total GDP had remained unchanged throughout the period. This allows us to iso-late the effects of structural changes of the economy on the evolution of energy intensity. Final energy intensity, rather than primary en-ergy intensity, was chosen for this purpose be-cause it better reflects the evolution of end-use energy efficiencies. Figure 3 shows that, since 1987, the index of actual final energy intensity exceeded (especially during 1990-1992) the in-dex of final energy intensity calculated with the structure prevailing in 1980, reflecting the increased share of the industrial sector and the reduction of the importance of agriculture in total GDP. The noticeably higher level of the actual energy intensity index compared to that of energy intensity at a constant 1980 GDP structure is evidence of an extensive penetra-tion of more energy intensive activities.
Figure 5 depicts the so-called "Economy-Energy Trajectory" of Thailand for the period 1980-1992. It vividly illustrates the country's significant economic development and the im-provement in the living standards of the Thai people.Italso clearly shows the evolution of energy intensity at a macroeconomic level. The 15% increase in final energy intensity from 293 to 334 toe/M$US at 1986 prices was accompa-nied by a much more impressive increase in GDP per capita (i.e., from 650 to 1200 $US at 1986 prices) and by the doubling of per capita energy consumption (from almost 180 to 360 kgoe) 4 during the period under study.
4/ For a detailed comparison between Thailand and several other Asian developing countries, readers are referred to Lefevre, Thanhet al.(1995).
4.2 Sectoral Energy Efficiency 5
INDUSTRY 6
Industry is the second largest energy con-sumer in Thailand, accounting for 29% of commercial final energy consumption in 1992 (7.17 Mtoe). Throughout the period under study, along with the rapid expansion of pro-duction capacity and outputs, the Thai indus-trial sector achieved a marked decrease in the energy intensity of industrial value added (Figure 6). A reduction of 20% was achieved by 1984, and industrial energy intensity has remained more or less unchanged ever since.
The improvement in the energy efficiency of the Thai industrial sector was largely due to the fact that a substantial portion of the pro-duction capacity was added during the last decade, utilising relatively up-to-date tech-nologies. For example, two-thirds of the ce-ment production capacity was installed after 1980, and thus utilises the energy-efficient dry process. The pulp and paper industry was also in a similar situation. It is estimated that the energy intensity of Thailand's paper industry is among the lowest in the developing world and comparable to those in industrialized countries. The textile and food industries are the two sub-sectors that recorded the highest
5/An analysis of energy efficiency indicators for the agricultural sector was not carried out in this study due to the fact that energy consumption in this sector (99% of which is petroleum products) ac-counted for a minor share (between 6 and 7%) of to-tal commercial final energy consumption in Thai-land. The potential for energy conservation in the agricul tural sector is likely the smallest in compari-son to that of the other sectors.
6/In this study, the industrial sector is further dis-aggregated into several sub-sectors: the metallic in-dustry(e.g., ferrous and non-ferrous metals); the non-metallic industry (e.g., glass, ceramics, etc.);
350.00
,
,
,'.0.351De/capi1a
0- \ 0.251De/capi1a
,
0
$
,
,
CJ
,
, , ,-:::>
,
,, 19920 " .
,
~oo
,
,
.
,'0; <Xl , ,
c 0)
,
,1!J ~
300.00 1900
,
, ,c
'"
- t: ,
>-0
,
01=:
,~
'E
,
(]) ,
,
c , ,
w
-
(]),
1982 ,\ ,
"i6
g
, ,,
t:
\0.181De/capi1a ,
i.L ,
250.00 \ ,'.
600 700 BOO 900 10c0 1100 12(0)
GDP per Capita (1986$US)
Figure 5: The "Energy-Economy Trajectory" of Thailand, 1980-1992
92 91 90 89
88
87 86
85 84
83 82
40+---1---+-->--+---1--+--->--+---1--+--->----<
00 81
-~- InduslIY
- + -
AgriculllJre - - - Transport - 0 - -Res/comFigure6: Evolution of Sectoral Energy Intensity Indices
output growth and a large share of value added during the whole period. This is not surprising because the growth of Thailand's economy in the last decade has been export-oriented, with garment and food products be-ing the major export products,
Analysis of sub-sectoral intensities revealed
that, among sub-sectors and during the period under study, only basic metal industry re-corded an increasing energy intensity; the food industry's intensity fluctuated within a range of 800 to 1200 toe/M$US at 1986 prices.
re-Source: Authors' calculations
141 352
Textile Industry
Mechanical Industry
Electric and Electronics lndustry
Table 3: Energy Intensity of Several Industrial Sub-sectors in 1980 and 1992 (toe/M$US at 1986 prices)
1980 1990
2,600 1,500
1,750 700
duced their energy intensity (Table 3). This substantial reduction coupled with the fact that these industries had big shares in indus-trial value added (in 1992, textiles, equipment goods, electric and electronics accounted for 20%, 10%, and 15% of industrial value added, respectively) partly explain the decreasing trend of energy intensity in the industrial sec-tor as a whole.
TRANSPORT
The transport sector was the largest energy consumer in Thailand throughout the period under study, and consumed 12.65 Mtoe in 1992. Energy consumption in this sector ac-counted for about 50% of the country's total
fi-na energy consumption. In addition, road transport, in which only two fuels (i.e., gaso-line and diesel) were used, accounted for three-quarters of total transport energy con-sumption during the entire period. Therefore, the potential for energy conservation largely depended on this mode of transport.
The growth rate of energy consumption in the transport sector was also the highest among the major final energy consuming sec-tors. An average annual growth of 10.4% was recorded between 1980 and 1992. This growth was moderate during the first three years (1980-1982), and became uniformly high thereafter.
The evolution of the energy intensity of the transport sector, which is defined as the ratio of energy consumption in this sector to GDP, is depicted in Figure 6. As this figure shows, the energy intensity of this sector exhibited a gen-erally increasing trend, which can be explained by the following factors .
• During the late 1980s Thailand witnessed a very rapid motorization (Transport and Communications Economics Division 1985, 1993). From 1983 to 1992, the stock of private cars in Thailand doubled, and the stock of light road vehicles (pickups, vans, micro-buses, etc.) increased threefold. As a result, fuel consumption in the transport sector grew so fast that it outpaced GDP growth, resulting in a 20% increase in the energy in-tensity of the transport sector between 1980
and 1992.
• Heavy traffic congestion in the Bangkok Metropolitan Region, where a predominant part of vehicle stock is concentrated, caused a big loss of fuels and therefore increased en-ergy consumption in road transport. This could also contribute to the sector's higher energy intensity.
On the other hand, the index of fuel con-sumption per vehicle (Figure 7) shows a no-ticeabedecreasing trend during the period under study. Average gasoline consumption per road vehicle (including private cars, mo-torcycles, light road vehicles) decreased by
30%(i.e., from 0.53 to 0.35 toe per vehicle per
year) and average gasoline consumption by private cars decreased by 35%(i.e.,from 0.73 to 0.51 toe per car per year) between 1983 and 1992. This decreasing trend in unit energy con-sumption in road transport can be explained by the fact that a substantial part of the motor vehicle fleet in Thailand has been added dur-ing recent years. Indeed, two-thirds of the pre-sent fleet consists of vehicles which were first registered in the late 1980s and the beginning of the 1990s, and have relatively high stan-dards of unit fuel consumption (Transport and Communications Economics Division, 1985j
1993).
0-o 85
II
(')
<Xl
'"
~
80
75
70
:t
""' "
Ln « j "- co O""l c:> ~ Nco co co co co co co O""l O""l O""l
II Gasoline
consumption per
vehicle
- y - Gasoline
consumption per car
Figure 7: Evolution of Indices of Average Fuel Consumption per Vehicle
been escalating during the period under study.
RESIDENTIAL/COMMERCIAL
In 1992, energy consumption in the residen-tial/ commercial sector represented 3.46 Mtoe, or 13.6% of total final marketed energy con-sumption. However it should be noted that marketed (or commercial) energy accounted for only one-third of total energy consumption in this sector. About two-thirds of household energy needs in Thailand are still met by biomass, which was not taken into considera-tion in this study.
The evolution of residential/commercial energy intensity is shown in Figure 6. The en-ergy intensity of this sector was calculated as the ratio of residential/commercial energy consumption to GDP. The figure shows a clear ascending trend of this sector's energy inten-sity during the entire period. In1992, the resi-dential/ commercial energy intensity was 30% higher than in 1980. This could be the result of: (i) the rapid expansion - especially in the last three years - of the service sector,whichinfact has a big potential for energy conservation that was not materialized during that period; (il) higher penetration of modern energy in households to replace traditional energy, in
line with the improvement in living standards (National Statistical Office, Office of the Prime Minister 1992)
Between 1980 and 1990, average energy consumption per household rose from 470 to 760 kgoe per year. During the same period, average electricity consumption per household increased from 400 to 771 kWh per year. The fact that average electricity consumption per household increased at a faster rate than the total commercial energy consumption in this sector shows the result of the electrification processinThailand, which gave access to elec-tricity to more households in both urban and rural areas. In 1992, electricity accounted for more than 70% of total final commercial en-ergy use in Thailand's residential/commercial sector.
5. Concluding Remarks
From the discussion presented so far, it can be seen that energy consumption in Thailand dur-ing the period 1980-1992 exhibited the typical pattern associated with a fast growing devel-oping economy. In particular, the volume of
energy useinall economic sectors rose rapidly,
energy consumption exceeded the growth rate of GDP, resulting in an increase in overall en-ergy intensity.
During the period under study, the two main factors that most markedly influenced energy consumption patterns in Thailand were: (i) the continuously growing level of economic activity, which tends to push up en-ergy intensity for economiesintransition like Thailand; and (ii) the policy measures gradu-ally undertaken by the government to counter the excessively high growth of energy de-mand, such as ending the regulation of energy prices (e.g., elimination of subsidies), the im-plementation of energy audit programs, of demonstration and training programs, and the introduction of lower taxes for energy-efficient equipment, etc. These measures have had a no-ticeable effect in the industrial sector, which was the prime target of energy conservation efforts. In addition, the recorded improve-ments in techno-economic energy efficiency indicators in the industry and the transport sectors can be attributed to the modernization of equipment, machinery, and the vehicle stock, due to Thailand's successful economic development, which has helped to maintain a favorable investment climate and to raise the standard of living of its people.
The evolution of energy intensities; which are the main indicators of energy efficiency, is largely determined by the combination of the structural changes in the economy and the ef-fectiveness of the management policies being implemented. In fast growing developing countries, the observed trend of structural change corresponds to the expansion of the industrial and commercial sectors, and to the increasing urbanization rate resultingina very
high growth of energy demand (Lefevre, Thanhet a1. 1995). Thus, a comprehensive de-mand management strategy has proven to be essential to sustain the socio-economic cleveI-opment of the country. In Thailand, energy management strategies including institutional arrangements have evolved in the right direc-tion and gradually become a comprehensive framework that will benefit Thai society. Not only will it provide balanced energy supply-consumption patterns, butit will also create a
cleaner environment. To that end, a strong commitment on the part of policy makers, business people, and public alike is needed to implement actively measures to exploit the huge potential for energy conservation in all the socia-economic sectors of the country.
References
Asian Development Bank (1992)Energy Indica-tors of Developing Member Countries of ADB.
(Manila, Philippines: Energy and Industry Department).
-(1993) Electric Utili ties Data Book. (Manila, Philippines).
-(1994) Key Indicators of Developing Asian and Pacific Countries (London: Oxford Univer-sity Press).
Department of Energy Development and Pro-motion (1995)Energy Conservation Promotion Act (Bangkok, Thailand: Bureau of Energy Regulation and Conservation).
-(various issues, 1984-1992) Thailand Energy Situation.(Bangkok, Thailand).
Electricity Generating Authority of Thailand
(1995) General Information EGAT Power De-velopment Plan (PDP 95-01). (Bangkok, Thailand).
Lefevre, Thierry, Bui Duy Thanhet al. (1995)
'Synthesis Report on Cross-country Com-parisons of Energy Efficiency Indicators in Asian countries; Revue de l'Energie 470:July-August-September:605-20.
National Statistical Office, Office of the Prime Minister (1992) Statistical Yearbook of Thai-landNo 39. (Bangkok, Thailand).
Office of the National Economic and Social Development Board(1990) National Income of Thailand, 1990 edition. (Bangkok, Thai-land).
Transport and Communications Economics Division (1985) Transport Statistics Data for
1984. (Bangkok, Thailand).
-(1993) Transport Statistics Data for 1992.
(Bangkok, Thailand).
United Nations (1990) Statistical Yearbook for Asia and the Pacific.ST jESCAP/943 (Bang-kok, Thailand).
T.V. Ramachandra is with the Energy Research Group of the Centre for Ecological Sciences, Indian Institute of Science in Bangalore.
Scope for Solar Energy Devices
in Karnataka State, India
T. V. RAMACHANDRA
Introduction
The primary renewable energy source on earth is solar radiation. The total flow of solar en-ergy through the earth's natural system is some 10,000 times greater than the present flow of energy through man's machines. Even the 1% of the solar influx that generates the great atmospheric pressure systems which drive the winds, and which in turn generates the waves, is some 180 times as large as man's rate of energy use. And though, on average, the photosynthetic process accounts for less than 0.2% of the total flow, even photosyn-thetic production creates 10 times as much en-ergy as man uses. The flow of solar and solar-derived energy forms is not independent from the activities of man. Radiation fluxes are mod-ified by changing the reflectivity of the earth's surface through, for example, urbanisation, agricultural practices, and deforestation. Man's activities also change wind patterns and modify cloud coverage. Injection of pollution into the environment, removal of forest cover, and man-made structural changes influence radiation, heat, and water flows (Ramachandra 1993).
measure and current techniques allow us only readily to measure the flux of radiant energy at a point. However, this flux varies so widely over most land surfaces as to render point measurements of limited value. The spatial heterogeneity in the radiant flux is due to the variation in solar-beam irradiation caused by variations in the inclination of the earth's sur-face with respect to beam direction. Within a geographic region, and subject to uniform at-mospheric conditions, irradiation from the sky is fairly uniform regardless of surface inclina-tion. However, the total of sun and sky irradia-tion would vary wide!y with surface orienta-tion and slope. The variaorienta-tion of direct-beam radiation varies in time with atmospheric con-dition and path length, the combined effect of which can be estimated. All in all, these factors are of practical importance since solar energy can meet a large variety of the small-scale de-centralised energy needs of a region.
A detailed study (Ramachandra and Sub-ramanian, forthcoming) of five locations of the coastal belt of Uttara Kannada District (Karna-taka State, India) in the Western Ghats region demonstrates that good solar energy potential is available in this region during most of the months in the year. The amount of solar energy that could be harnessed by utilising 5% of the present wasteland in coastal Taluks as a solar-collector area, is found to be in the order of 95.7 million kilowatt-hours (kWh) annually from the coastal belt of Uttara Kannada District alone. This means that solar energy could meet at least 32.5% of the District's present electricity needs. This study suggests that solar-conversion technologies have considerable potential for application, pro-vided that questions of storage can be resolved and that electricity requirements during the monsoon season can be met through other means. The abundance of the solar resource can be illustrated by comparing the land re-quirements of solar (thermal or photovoltaic) with those of hydro or energy plantation pro-jects. Except for run-of-river projects and for high head sites in deep gorges, the land re-quirements for such hydel projects average around 25 to 45 times those for solar energy, at today's conversion efficiencies. This means
that solar energy is capable to supply 5 to 10 times the electricity requirements of Karnataka State, while occupying smaller land areas than those currently used by hyde! projects.
Rural communities depend on firewood and agricultural residues to meet the fuel re-quirement of domestic needs, such as cooking and water heating. Energy surveys in Kar-nataka State show that people are receptive to
technologies which do not involve major atti-tudinal change and cultural barriers. In this regard, solar water heaters seem to be the most acceptable' device in the domestic sector. Solar energy for water-heating purposes would re-duce firewood consumption in the domestic sector.
Karnataka's Energy Scene
Karnataka State depends both on commercial and non-commercial forms of energy. Recent data (Subramanian and Ramachandra, forth-corning) suggest that 53.2% of total energy use is met by non-commercial sources such as firewood (43.6%), cow dung cake (1.4%), and agricultural wastes (8.2%). While commercial energy like coal (5.8%), oil (11.6%), kerosene (2.6%), liquid petroleum gases (0.7%), and electricity (26.1 %) account for 46.8% of overall energy use. A significant part of these non-conventional energy sources cater to the heat-ing (domestic) needs of the rural population (about 70-80% of the total) and, to a lesser de-gree, to that of village industries.
As far as electricity is concerned, the share of the industrial sectorintotal consumption is around 44.9%, followed by irrigation pump sets with a share of 28.6%, and domestic users which account for approximately 15.5%.
The Rural Energy Scene
all town divisions in Kumta Taluk. While in the Taluks of Sirsi, Mundgod, Siddapur, and Ankola our conclusions are based on ran-domly selected households of the order of 190 to 220 households in each Taluk.
Our sample of 1304 households from 90 villages in Kumta Taluk shows that most households still use traditional stoves for cooking (97.9%) and water heating (98.3%). Average consumption for cooking purposes ranges from 2.01 1.49 kilograms per person per day (kg/person/day) in the coastal region, to 2.322.09 kg/person/ day in the hilly region. A seasonal pattern is also evident in both re-gions. Specifically, firewood requirements for coastal areas, in kg/person/day, vary from 1.98 during the summer, to 2.11 during the monooon season. Similarly, for the hilly region the range is 2.22 to 2.51 kg/person/day during the summer and monsoon seasons, respec-tively.
Firewood requirements for water-heating purposes range from 1.170.02 (coast) to 1.630.05 (hilly) kg/person/day. Seasonal vari-ation is also evident from the range for the coastal zone: from 1.12 to 1.22 kg/person/ day for the summer and monsoon seasons, respec-tively. For the hilly region, the range is from 1.53 (summer) to 1.73 (monsoon) kg/ per-son/day.
Analysis of other sources of energy used for domestic purposes shows that in the
coastal zone kerosene is used for cooking and
also for lighting. Kerosene consumption for cooking, in kg/person/day, ranges from 0.05 (hilly) to 0.34 (coast). The availability of
bio-re-sourcesin thehilly region is the main reason for the lower consumption of kerosene.
Kero-sene for lighting purposes ranges from 0.74 litres per person per month (lit/person/ month) in the coastal areas, to 0.98 lit/person/ month in the hilly region. The latter region is more dependent on kerosene for lighting be-cause of the non-availability of electricity for lighting purposes. In the hilly region, house-holds are distributed over a large area and the electrification of all households has thus far not been carried out.
Based on the fuel consumption averages (by region, season, and end use) obtained from
our detailed survey of households, we esti-mate that:
a) the firewood required in the domestic sector (for cooking, water heating, space heating, jaggery making, parboiling) of Uttara Kan-nada District works out to be 1.67 million tonnes per year;
b) the annual electricity consumption in the domestic sector (excluding irrigation) of the District is about 32.65 million kWh; and c) kerosene demand of the District for cooking
and water heating is about 15.9 megalitres per year.
The climateincoastal areas is favourable to setting up solar water-heating devices to meet the requirement of hot water for bathing pur-poses. If30% of the population were to switch over to solar water-heating devices, the esti-mated quantity of firewood saved would be approximately 66.8 kilotonnes per year from the five coastal Taluks of Uttara Kannada Dis-trict. The lack of information about the tech-nology and the non-availability of proper ser-vice and maintenance backupinthis region are the main reasons for energy-efficient devices and alternative technologies not finding a sig-nificant place in fhis rural energy scene.
Rural industries like cashew processing and others are major consumers of firewoodin
These analyses show that solar energy could be a viable alternative in meeting the en-ergy needs associated with the drying of
agri-cultural products, cooking (through solar cookers), hot water requirements for bathing and washing (solar water heaters), and light-ing (through solar photovoltaic systems). In lightof theabove, we now turn to an examina-tion of various aspects of solar water-heating devices, such as the underlying technology and their future prospects.
Solar Energy Conversion Modes
Solar energyiscaptured by being converted to other forms of energy by: (a) chemical reaction;
(b)thermal excitation; and (c) photovoltaic ef-fect. Solar energy is also chemically converted into energy through photosynthesis, which di-rectly produces food and wood. Simple
ther-mal-conversion devices, such as flat-plate
col-lectors, are suitable mainly for providing low-energy, high-entropy heat to systems of the same nature. The flat-plate collector can de-liver temperatures of up to approximately 100c
e.
The direct conversion of sunlight toelectricity by means of solar cells is the photo-voltaic effect. The solar cell use energetic pho-tons of the incident solar radiation, converting solar energy into electricity (Wilbur 1985; Mortimer 1991).
Some advantages of photovoltaic devices are that they: a) have no inherent lifetime limit; b) have efficiencies that are independent of size; c) are modular; d) are compatible to all environments; e)proVide fairly constant volt-age, independent of sunlight intensity; f) are relatively low-maintenance; g) have low oper-ating and maintenance costs; h) are Simple; andi)do not require water cooling.
Potential areas of commercialisation of so-lar photovoltaics are: a) domestic lighting; b) community lighting (street lighting); c) health care; d) telecommunications; e) water pumping; and f) entertainment gadgets, like televisions and radios. Solar photovoltaics alone cannot successfully cater to energy requirements without a very high-efficiency balance of system design. Another major requirement is the storage of energy, wherein
batteries of low-maintenance and high-recycling capacities are to be used. However, some disadvantages are: (a) the combination of theoretical efficiencies of about25(?,ocombined
with the low-energy intensity of sunlight means that relatively large collectors are needed; (b) the fact that these sources are not economically competitive with other, more traditional sources; and (c) the need for DC to AC inversion equipment to supply AC loads.
Solar Water Heating
Solar energy for dailyuse in households is al-ready a popular concept. The current trend is such that these uses are virtually confined to water heating: more than 600 homes in Banga-lore City are already using this system. Solar water-heating systems aTe simple devices, which work on the principle of black-body ra-diation and the greenhouse effect. These gen-erally involve the use of flat-plate collectors, storage tanks, circulation systems, and ap-propriate controls and accessories. Solar water heaters can be broadly classified as either thermosyphon (natural circulation) or forced-circulation systems. Usually thermosyphon units are used for domestic applications (given a standard capacity of 300 litres), while forced circulation is usedinthe case of industrial and commercial applications.
Industrial and Commercial Systems
upon the solar installations.
Domestic Water Heating
Thermosyphon systems are generally used be-cause of their ease of operation and mainte-nance. For proper functioning, it is necessary to have as little resistance as possible in the thermosyphon path as well as an adequate supply of cold water. In some cases, an auto-matic electric backup system is incorporated to ensure hot water availability throughout the year, and storage tanks are usually double-walled, insulated constructions.
The collector is the heart of the system and consists of components such as absorbers, glazing, boxes, and insulation. A wide range of materials and design choices are available now. The basic absorber can be made of gal-vanized steel, aluminum or copper, and both flat black paint or selective coatings are avail-able options. The glazing can be plain window glass, toughened glass, or acrylic. Sawdust and cork are occasionally used for insulation. However, the majority of commercially-avail-able collectors use mineral wool, glass wool, or even polyurethane foam for bottom insulation. While wooden boxes are once again employed
insome instances to contain the other compo-nents of the system, metals like steel and alu-minum as well as reinforced plastic are more frequently employed.
Present Status in Karnataka
The total number of industrial and commercial systems installed in the State is approximately 150, with 35 systems of 1000 litres per day (LPD), 72 systems of 1000 to 5000 LPD, and 10 systems of 10,000 LPD. Assuming that the sys-tem is used effectively for 225 days a year, the amount of equivalent electrical energy saved annually is 6 million kWh. In Bangalore City alone, the amount of electrical energy that could be saved by installing solar water heaters in All Electric Houses (AEHs) is 1.8 million kWh per year. The generation capacity required to meet their demand is 250 MW, the cost of which is higher, by as much as 50%, than that of installing solar water heaters in
AEHs.
The cost of a domestic water heater is be-tween 8000 and 10,000 rupees (Rs.). The Gov-ernment of India provides a subsidy of Rs.3000 to each person who decides to proceed with the installation of such a system. Solar heaters save about 50 to 75 kWh of energy per month per household. By educating people about so-lar energy through mass media, substantial savings in electrical energy and firewood could be achieved. It would appear that the main reasons for the low market penetration rate currently observed are: (a) the high capital cost of the system; (b) the inadequate avail-ability of funds for the disbursement of subsi-dies; (c) the absence of attractive financial packages for buyers; and (d) a lack of aware-ness of the technology.
Techn!cal Issues
The main technical snags encountered in solar heaters are:
(a) Corrosion of various forms has been a nag-ging problem. While the use of galvaniza-tion has produced reasonably satisfactory results in the case of steel absorbers, prob-lems in certain localized areas still persist. The use of copper overcomes this problem, but increases the cost dramatically.
(b)Formation of scales in absorbers, due to the direct use of raw water, inhibits the flow and increases the resistance to heat transfer. This problem is more severe where thin and narrow passages are employed. A scale thickness of 1.22 millimetres (mm) in a 15 mm pipe would decrease the collector effi-ciency by about 1 to 2%.
(c) Failure and very poor reliability of the con-trol hardwareinthe case of forced-flow sys-tems, namely the fact that simple ther-mostats change calibration over time (capil-lary thermostats would provide better per-formance and reliable operation, but are quite expensive), and problems with solenoid valves and, at times, level con-trollers.
of materials (to bring down initial costs) would severely hamper the commercialisation of so-lar water heaters.
Economic Issues
Without accounting for any available financial incentives, the normal payback period in commercially-installed solar water-heating systems works out to be about four to five years for domestic users (when compared with electrical systems). A number of factors such as climate, site location, type of application, conventional alternatives being substituted for also playa role in the economic evaluation of a solar system. As it turns out, the economics works out to be most favourable for applica-tions that require very little storage or when the alternative conventional energy source is electricity. Revised economic analyses, which include various incentives (such as tax savings due to higher depreciation rates) and higher energy costs of conventional sources, show that the payback period for solar devices in commercial applications is about 1.5 to 2 years. However, when solar systems are com-pared to firewood-based systems, where the price of firewood is highly subsidised, solar-system economics are rather poor. When the subsidy component is removed for firewood, the payback period for solar devices is five years. (In Kumta Taluk, for example, the cost of firewood supplied by government agencies is about Rs.25.6 per 100 kilograms (or quintal) of firewood, while the cost of firewood sup-pliedbyprivate agencies in certain areas can vary between as much as Rs.75 to Rs.100 per quintaL) These analyses show that with attrac-tive payback periods, solar-heating technolo-gies would automatically find acceptance among industries and domestic users, pro-vided potential users are aware of the exis-tence of these technologies. Appropriate policy measures and incentives are required for the accelerated commercialisation of solar devices.
Policy Issues
The energy crunch situation that prevails in Karnataka State is due to its large-scale
de-pendence on conventional sources and a sec-toral approach to energy planning. The conflict between energy demand and environmental-quality goals can be resolved by an integrated approach to the problem of energy planning, with an aim of maximising the efficiency of use, minimising the consumption of non-re-newable sources, optimising energy source and end-use matching, and encouraging the use of renewable reSources with proper policy and incentive measures. Incentive measures which would help both domestic and in-dustrial sectors include exemptions from ex-cise and sales taxes and the provision of en-hanced depreciation. Apart from these, there is also a need to make people aware of the alter-native technologies available.
All in all, we would argue that appropriate policy initiatives in this area should ensure: a) the availability of capital for solar in-stallations; b) provisions for the installation . and capital-cost recovery of devices along with monthly electricity charges or in monthly instalments; and c) making the installation of solar devices in AEHs mandatory (at least in new installa tions) in places where the climate is favourable.
Conclusions
Itis clear that to encourage sustainable devel-opment it is necessary to increase energy sup-plies from renewable sources like solar. Com-pared to the enormous theoretical and techni-cal potential of solar energy conversion, little use has thus far been made of developed and demonstrated technologies, such as solar wa-ter-heaters, and dryers. A more intensive use of such technologies would reduce the pres-sure on supplies of electrical energy in urban areas and of firewoodinrural areas.
References
Renewable Energy Resources,' Energy
Pol-icy.
Ramachandra, T.V. (1993) "Energy Options for Sustainable Development," Energy Manage-ment,Jan-Mar: 12-19.
Ramachandra, T.V. and D.K. Subramanian (forthcoming) 'Potential and Prospects for Solar Energy in Uttara Kannada District of Kamataka, India,'Energy Sources.
Ramachandra, T.V., D.K. Subramanian, and N.V. Joshi (1995) 'Efficient Utilisation of
En-ergy in Domestic Sector for Cooking and Water Heating in Uttara Kannada District, Kamataka,' Indian Journal of Rural Technol-ogy,7(1&2):1-22.
Subramanian, D.K. and T.V. Ramachandra (forthcoming) 'Energy Utilisation in Kar-nataka: Part 1, 11 and 11;Energy Management.
John Walsh is an independent energy advisor in Ottawa
1996 Carbon Dioxide Fact Sheet
JOHN H. WALSH
The 1996 issue of the 'Carbon Dioxide Fact Sheet' follows the same format as in the previ-0us year (Energy Studies Review, 7:3, 273-75, 1995). Energy consumption data for the world and its principal regions and nations is taken from the BP Statistical Review
of
World Energyand converted to emissions of carbon dioxide using standard factors. This well-accepted source of energy statistics is now posted on the World Wide Web at http://www.bp.com/ bpstats. The Review is normally published in June following the year under review and so provides a means of estimating emissions of carbon dioxide from the fossil fuels on a con-sistent basis throughout the world as early as six months after the subject year.
The conversion of one million tonnes of oil equivalent (MTOE), the basic energy unit em-ployed in the Review, was taken here as 41.868 petajoules and the specific factors applied to the three fossil fuels were those employed by the International Energy Agency: for oil- 19.9 million tonnes of carbon (not thedioxide) per exajoule (MTC/EJ); for natural gas - 13.8 MTC/EJ; and for coal- 24.] MTC/EJ, calcu-lated on the basis of the higher heating value. Should it be desired to express emissions in terms of carbon dioxide rather than the carbon convention used in this note, the factor is 3.67. The limitations ontheuse of energy consump-tion data for the estimaconsump-tion of carbon dioxide emissions have been noted previously. (Walsh, J.H. (]993) ']992 Carbon Dioxide Sheet,' ESR, 5:2:131-35).
In 1996, world emissions of carbon dioxide increased by 2.8% while the corresponding primary energy consumption (excluding bio-mass and non-commercial forms of energy as is the practice in the Review) grew 3.0%, a marked increase over the 1.4% increase in emissions and 1.8% in primary energy con-sumption reported for ]995. The fossil fuels continued to account for 90.0% of the world's energy consumption in 1996.
Table 1:Carbon Dioxide Emissions from Selected Countries and Regions
~
~-""'""---~---~-~..I
I
1995~
19~
J!
% C1lange and C Percap~ta~1
, Country! Oil NatGas Coal ToL-u Oil NaLGa' Coal Total %In- %of
I
Tomle, 'Ii Region IMfCI% MTCI% MfC/% MTCI% MTCI% MTC/% MTCI% MTCI% crease World ClPerson!
'i
5.79I
25.0% II 1543.6 +3.3% 100% 520.6 33.7% 328.9 21.3%1494.4 I, 694.1
100% 45.0% 498.7 33.4% 322.7 21.6% 673.0 45.0% U.S.A. ,il
World 2695 1088 2225 6008 i 2760 1139 2277 6176
I
+2.8% 100% 107 Ii1!-~~_I!-44~.9_0/,_'__I-1-8-.1-0/,-,
-+-_3_7_.0_'_Vo--l_I_0_0_0/,_'-if_44_._7_%~1__1_8-.4-'-Vo--l-3-6-.9_0/,-'-+-_1-00-O-Vo--lII__I~
___I----+-~i,·
I
i
!I
i,l "M ICanada 63.6 36.9 25.4
I
125.9: 66.2 38.4 23.3 127.9 :.1 +1.6% 2.1% 4.27:150.5% 29.3% 20.2% 100% 51.8% 30.0% 18.2% 100%!i i'l
I
I
2.45 0.23 3.5% 14.&% I +2.2% '1I
916.9 100%218.5
I
+7.5% 100% i 141.6 64.&% 227.6 24.8%I
11.3 5.2% 16.8 15.6% 174.4 19.0% 75.8 70.6% 65.6 30.0% 514.9 56.2% 203.2 100% 105.8 100%I
896.9I
100%I
14.5 13.7% 41.6 51.2% 234.2 26.1% 10.6 15.0% 132.2 65.0% 10.2 5.0%'
i
2.6 3.7% 10.2 12.5% 305.2 35.1% 158.3 17.7% 17.1 16.2% 504.4 56.2% 29.4 36.3% 60.8 30.0% 237.2 27.3% 74.2 70.1% 57.7 81.3% E.U. (15) India China Brazil France Austra-liaI
KEur. +FSU327.4
I
869.8 221.9 310.8 316.6I
849.3 -2.4% l3.8% 2.10 'I37.6% ! 100% 26.1% 36.6% 37.3%
I
100%=J
'F~!--~-F--~~~-rll ~~--F-~"'~~~-""f"---~'"
I'81.2 I' 29.8 ,I 9.9 i 43.3 I 83.0 II +2.3% 1.3% 4.54 I; 100% 35.8% 12.0%
I
52.2% 100% II IiII I I 'I
:1 70.9
i
61.8 2.7 10.& 75.3 +6.3% 1.2% 0.46;1100%
I
82.1% 3.6% 14.3% 100% :1I!---I__--__~---+--~-+---t----I__-~__I---_+~~-+-·--+_---I__-~-II
133.8 9.2 645.0 788.0 143.7 9.2 672.0 824.9 +4.7% 13.4%
I
068 !I17.0% 1.2% &1.8% 100% 17.4% 1.1% 81.5% 100% ~!
11---+--t--+---'I--+---1--+---1--+--+---I--~il
14.8 107.4 +1.5% 1.7% 1.84 1i
13.8% 100% I:
II
1 1 - - - t - - - t - - - + - - I - - + - - - 1 - - - I - · - - - 1 - - + - - + - - - I _ _ - - · ,
II! ! 2.78 0.53 5.6% 19.3% +4.7% 348.4 +1.7% 100% 1189.1 100% 232.4 19.5% 89.1 25.5% 34.4 9.9% 219.3 18.5% 737.4 62.0%
I
224.9I
64.6% tincreased 1.6% and accounted for 2.1 % of the world's total. Canada's per capita emissions of 4.27 tonnes C/person/year were narrowly ex-ceeded by Australia (4.54) but both countries' per capita emissions were less than the US value at 5.79. Emissions continued to decline in Eastern Europe (a category here that in-cludes all the former members of the Soviet Union), but ,at -2.4% the rate was significantly less than the - 5.0% experienced the previous year. The 15 nations of the European Union also experienced an increase of 2.2% in emis-sions in 1996 in comparison with a small in-crease of 1.1% the previous year. France, though a member of the EU, was listed sepa-rately because of the importance of nuclear power in that country, which typically ac-counts for about 78% of its electrical genera-tion: the increase in emissions was 1.5% in 1996.
In both Canada and France, natural gas was a larger source of carbon dioxide emis-sions than coal. The United States remains the largest contributor to emissions accounting for 25.0% of the world's total. The increase in carbon dioxide emissions for that country in 1996 is listed in Table 1 at 3.3%, which may be compared with the official value for the increase in total greenhouse gas emissions of 3.4% announced on October 20, 1997.
The growth in emissions in the large devel-oping countries of Brazil, China, and India is
noteworthy at 6.3%, 4.7%, and 7.5% respec-tively, although their per capita levels remain low. In the rather heterogeneous category of the Rest-of-World (calculated by deducting all the countries or regions specifically listed in Table 1 from the world total), emissions rose 4.7% but per capita emissions were low at 0.53 tonnes C/person/year.
Primary energy consumption increased in some nations in Eastern Europe in 1996 (Belarus, Czech Republic, Hungary, Poland, Romania and some other successor states of the old Soviet Union), although consumption continued to fall some 3.0% in the Russian Federation. Itis clear that if economic condi-tions improve more generally throughout this region, world emissions of carbon dioxide will increase more rapidly.
International negotiations aimed at the mit-igation of greenhouse gas emissions continue under the Framework Convention on Climate Change with a Third Conference of the Parties scheduled for December 1-10, 1997, in Kyoto.
The Department of Natural Resources is-sued its update of Canada's Energy Outlook
1996-2020dated April 1997, which provides a reference outlook for Canadian energy de-mand and supply and for greenhouse gas emissions over the next 25 years.