Volume 5, No. 6, July-August 2014
International Journal of Advanced Research in Computer Science
RESEARCH PAPER
Available Online at www.ijarcs.info
Sophisticated Fuzzy Clustering Algorithm for Duplicate content Detection based on
Outlier Detection
Dr. S.P. Victor
Associate Professor and Head & Director of the Research Center, Department of Computer Science, St. Xavier‟s
College, Palayamkottai-627 002, India,
Nancy Jasmine Goldena
Research Scholar, Department of Computer Application, Mother Teresa Women's University,
Kodaikanal- 624101, India.
Abstract: In this paper, the concept of duplicate document detection in the text is analyzed based on the fuzzy clustering method. It acts a method for allocating the data points in the documents as similar and dissimilar data through the cluster. It processes with series of stages to evaluate the algorithm. Initially, the collections of document with certain membership levels are compared. The suspicious text in the original document are matched with the list of other paragraphs that based on the fuzzy compilation of membership data. Then, it under goes through the initial cluster generation based on set of documents. It evaluated by the local membership function through the modified fuzz y cluster algorithm. Finally the pattern are mapped through the outlier detection method in a iterative stages. The result of similar and dissimilar data are clustered and compared with various existing algorithms.
Key words – Fuzzy clustering, Duplicate document, text detection, outlier detection.
I. INTRODUCTION
Psychological studies have compared different types of note taking which copy and paste part by Igo et al. (2005) in [1] point out that, for print, summary, paraphrase or annotation of the main ideas are more effective than copying verbatim. Also in the environmental education there is a difficulty in distinguishing the originality of the work, and plagiarism easier today due to extensive use of information technology. Possible to detect plagiarism is crucial the evaluator for the precise information relevant to the original work analyzed in comparison with those other with presenting the proximity suspicious. In the last period are developing different systems and application tools generally to detect plagiarism The wide variety of words in the English language to define the areas of falsification and plagiarism gives us an idea of the importance of these events in unauthorized collaboration of others work. External approach that aims to determine the possible existence of plagiarized fragments, identify the source of plagiarism, and the delineation of such fragments in both the suspect document as their source of plagiarism. The reuse of text is the activity in which pre-existing written texts are reused to create new texts or versions. There have been reused when there is an embodiment conscious transformation of a text to get to another by Clough & Gaizauskas.
The process of duplication (identical copy), revision, adaptation genre, summary, translation and quotes are as many different shapes of reusing an original text. Researchers as manufacturers are aware for many years of interest to study the activity that corresponds to the actual application issues such as document detection duplicated on the web has an impact on the effectiveness of the search engines as well for treatment (cost of indexing and storing) that the accuracy of answers returned. Detecting plagiarism also has a great interest in respect of copyright as it concerns the source code of the software or any document used as a basic task. Monitoring the impact of a communication
about a product or an information made public also has commercial and scientific interests in perspective view. In practice, the detection systems reuse text proceeds in three steps:
a. First, they select unit type‟s textual notes (word, phrase, sentence, paragraph, document, n-gram with / without recovery) in the manipulated documents; b. Then they build a model of each document language
standardization (lexical, syntactic, semantic) or digital (condensation hash algorithm) and filtering (full words, a given n-gram, n-first encountered with the text, weighted by tf: idf,)
c. Finally, they actually compare the documents on the basis of these representations.
The choice of representation is of course dependent on the comparative method used. These vary according to different processing costs: measures similarities encountered Classification and Information Retrieval (IR) (ratio of shared distance vector material) to the more complex and specific comparisons (longer chains in common, edit distance) Hirschtick (2006) in [2]. The different steps of this procedure are subject to many technical challenges of the most representative document content, textual units that based on less expensive to extract (in terms of resources required, methods to implement, time calculation). The most characteristic phenomena reuse in terms of accuracy and processing time methods to detect form data reuse.
intended to enter the dilemma of which one is better or worse because clearly each system has its own limitations and advantages. In this paper, a simple fuzzy algorithm is proposed as a baseline to be taken as the minimum benchmark for evaluating the effectiveness of the systems that follow the intrinsic (or combination) approach, and accordingly, a new method for evaluating the effectiveness of these systems.
The rest of the paper is organized as follows: Section 2 explains various literature works and Section 3 describes the methodology about documents analysis. The Section 4 analyzes the proposed fuzzy based clustering algorithm for the duplicate text detection. Section 5 provides some preliminary experimental results. Finally the section 6 provides a detail view about conclusion of this paper.
II. RELATED WORK
Clustering is important in many different fields such as data mining [3], image compression [4] and information retrieval [5], [6] provides an extensive survey of various clustering techniques. In this section, we highlight the work most related to our research. We can divide clustering algorithms into hard and soft clustering algorithms. According to [7], there are four different kinds of clustering algorithms: hierarchical, partition, model fitting and density based. These algorithms form clusters by putting each item into a single cluster. Soft clustering allows each item to associate with multiple clusters, by introducing a membership function Wij between each cluster-item pair to measure the degree of association. Expectation-maximization [8] serves as the basis of many soft-clustering algorithms. A good survey of such algorithms can be found in [9]. Many clustering techniques have been used for document clustering. Most of the early work [10, 11] applied traditional clustering algorithms like K-means to the sets of documents to be clustered. Willett [12] provided a survey on applying hierarchical clustering algorithms into clustering documents.
Hinneburg, et al. [13] proposed speeding up the partition-based clustering by using techniques that provide good initial clusters. Two techniques, Buckshot and Fractionation are mentioned. Buckshot selects a small sample of documents to pre-cluster using a standard clustering algorithm and assigns the rest of the documents to the clusters formed. Fractionation splits the N documents into ‘m’ buckets where each bucket contains N/m documents. Fractionation takes an input parameter, which indicates the reduction factor for each bucket. The standard clustering algorithm is applied so that if there are „n‟ documents in each bucket, they are clustered into n/ clusters. Now each of these clusters is treated as if they were individual documents and the whole process is repeated until „K‟ clusters are left.
Most of the algorithms above use a word-based approach to find the similarity between two documents. In [14] a phrase-based approach called STC (suffix-tree clustering) was proposed. STC uses a suffix-tree to form common phrases of documents enabling it to form clusters depending not only on individual words but also on the ordering of the words.
Various other clustering techniques have been applied to document clustering. This includes using association rules
and hypergraph partitioning [15], self-organizing maps [16], neural networks [17, 18], and EM-based techniques [19].
III. METHODOLOGY
The methodology for the proposed method involves a series of stages. The first stage involves analyze the document text through the following steps that based on Chow & Rahman (2009) in [20].
a. The first task was to obtain documents suspected plagiarism:
b. One was obtained in PDF format on the Web, so had to submit to the process of Word to make the manipulation required for analysis. This had to type for only in this way could implement programs to detect plagiarism.
c. The "The Plagiarism Checker” program was applied to each paragraph by paragraph article. Each sentence identified as suspicious. When a group of paragraphs from a text was detected, it applied the through the fuzzy based algorithm, comparing the two texts, and a percentage of plagiarism (the limitation of this program is that it only identifies plagiarism which is textual).
d. Each paragraph of each article was moved to a two-column table. In a two-column paragraphs of each article copied and the other texts which appeared possible sources and Web sources.
e. Each paragraph mark in both matches was compared. Comparison analyzed and determined whether the paragraph is considered original or suspect.
f. In each paragraph suspected of duplicating a characterization of what is done found.
g. This information is transferred to the analysis tables, paragraph by paragraph, coincidence with other written texts.
h. A percentage of paragraphs identified as coincident with other texts set relative to the total article paragraphs analyzed.
i. Percentages of plagiarism between parts of texts compared are reported through the fuzzy clustering algorithms.
Submission of data
The data for each item are presented in descriptive tables:
a. Review, paragraph by paragraph, coincidence with other written texts
b. Percentage analysis of paragraphs in which matches appear in other texts
c. Percentage analysis of similarities between texts compared
between the text of the article and another values, even in the organization of discourse. It takes an entire section of a text and is played with minimal changes. No source or paraphrasing notes or textual. At other times an entire paragraph enumeration made is rewritten to immediately afterwards, change of structure (each item listed on a separate line and vignettes), the score is modified to adapt to the new structure, and not recorded or such as quote or paraphrase. Although some small changes are made, it is copied verbatim so that even moving quotes listed in the source. If the text had indicated their origin, he should consider dating second order and indicate them, as such paragraph. If not perceived that the text is a copy of another , would be read as paraphrasing quotes in the text in values, but should appear in the references literature . However, these quotes do not appear in the reference section, which seems to demonstrate that they were not consulted for the job, but took the text font. Although the author of the source text does appear in the references, in this part of written in values must be shown that this part of the text was taken verbatim or, at least, paraphrased, which is not shown. On the other hand, they were highly coincident with a variety of text documents on the network, possibly very popular for this subject, so that it showed many copies of the same, without appropriate references. All previous cases summarized, as conceptualized in this report, classified that the plagiarism because authorship is omitted, it is taken as indicated by quotation marks and made minimal changes to other texts which are presented as originals.
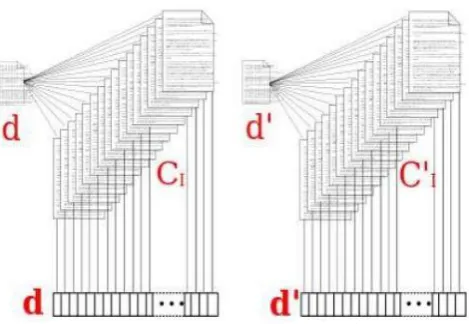
Figure 3.1 Representation of various documents and its similarity between texts through the fuzzy clustering method. The “d” is the original documents and d‟ is processed document based on the fuzzy compilation of
“C1” for original documents and C‟1 for processed documents
IV. PROPOSED METHOD
A. Pre-processing:
In this step each document is transformed into a structure that will be used by the similarity function f(). One such representation is a vector, with each dimension denoting the presence/absence of a certain word in that document. In addition, we remove all the stop words (like articles, propositions and auxiliaries verbs) that are not helpful in clustering.
B. Initial cluster generation :
At this step the input is analyzed, initial clusters are produced and outliers are removed that based on Chiu (1994) in [21].
The first thing for fuzzy to do is to decide what constitute as “similar” documents. Essentially, we need to find a threshold value
such that two documents are considered similar if and only iff
(
x
,
y
)
. Since fuzzy is designed to adapt to different similarity measures f, it is not reasonable for the user to supply a value for
. As a result, fuzzy determines the appropriate value of
based on the input documents. The value of
can neither be too high, such that no documents will be clustered at the end; nor too low, such that all documents will be clustered into one cluster. Thus, the algorithm chooses
such that half1 of the documents are assigned at least to one cluster centroid. This is done by the following method:a. Pick a set of k documents, assigning each one as the initial cluster centroid of a cluster.
b. Pick
as the largest value such that for half of the documents q in the data set, there exists a p such that
) , (p q
f , pC,qD where C is the set of cluster centroids and D is the document set. This can be done by calculating all the similarity values
D q C p q p
f( , ), , and sorting them.
This ensures that at least half of the documents are close to at least one of the clusters, so that enough interesting clusters can be found. An issue here is how the initial cluster centroids are picked. The simple way is to pick a random set of documents. However, since the initial cluster centroids can have a significant effect on the algorithm, it pays to be more careful. We want to avoid picking too many cluster centroids that are close to one another (so they should actually belong to the same cluster). One way to overcome it is to start with picking a random document as the first centroid, and then pick the document that is least similar to it as the second centroid. Subsequent centroids are chosen such that they are farthest away from those centroids that are already picked.
One drawback of this approach is that outliers can easily be picked as centroids, rendering the clustering method ineffective. To remedy that, the algorithm makes use of the threshold value
selected. After
is picked, the chosen cluster centroids are re-examined to make sure that there is at least one document similar to it (i.e. with
()
f
). Otherwise, the document is viewed as an outlier and is discarded, and replaced with an alternate document chosen as a centroid (the same test is applied to the new document to ensure that it is not an outlier itself).To make the algorithm more robust to the initial choice of cluster centroids, fuzzy starts with 2k instead of k initial clusters. This makes the algorithm more flexible to find the right number of clusters. The standard FCM is an iterative, unsupervised clustering algorithm, initially developed by FCM algorithm, introduced by Bezdek in [22]. The following model of FCM is described by Ahmed in [23].
The Observed duplicate document is modeled as a product of the true signal generated by the underlying regions in the document.
Y
k
X G
k k
k
{1, 2,
, }
N
(1)groups the values
X
k,Y
k andG
kare the true regions invarious dimensions. The application of a logarithmic transformation to the intensities allows the artifact to be modeled as an additive field for similar text.
k k k
y
x
k
{1, 2,
, }
N
(2)where
x
k andy
k are the true and observed log-transformed intensities at the kth level respectively.C. Modified FCM algorithm (M-FCM):
In the followings, we will introduce some modifications to this algorithm. The evaluation of the method for localized measurements, such as the impact on the document ranges determinations also needs further work by Siyal & Yu (2005) in [24].
2 2
1 1 1 1
(
( , ) ||
|| )
r k
c N c N
p p
m ik k k i ik k r r r i
i k i k y N
J
u
y
v
u
w y y
y
v
(3)Where
w y y
(
k,
r)
is a weighting function, satisfied the following conditions(
,
)
r k k r
yN
w y y
,0
1
,
k
{1, 2,
, }
N
especially, when
(
k,
r)
R
w y y
N
, theJ
mis FCMobjective function. Formally, the optimization problem is estimated those parameters in the form
(4)
The objective function can be calculated as the M-FCM algorithm. Taking the first derivatives of
J
m with respect toik
u
,v
i ,
k, and setting them to zero results in threenecessary but not sufficient conditions for
J
mto be at a local maximum. In the following sections, we derive these estimating results and propose the algorithm..a. Membership Evaluation:
*
1/( 1)
1
1
ik p
c ik ik
j ij ij
u
D
D
(5)where
D
ik
||
y
k
k
v
i||
2, and2
(
,
) ||
||
r k
ik y N
w y y
k ry
r r i
b. Cluster Prototype Updating:
1 *
1
(
)
( ,
)(
)
(1
( ,
))
r k
r k
N p
ki k k k r r r
k y N
i N p
ki k r
k y N
u
y
w y y
y
v
u
w y y
(6)c. Similar Text Estimation:
1 * 1(
,
)
(
,
)
r k r kc p p
i ik k r ir
i y N
k k c p p
ik k r ir
i y N
v u
w y y u
y
u
w y y u
(7)d. The discuss of the convergence:
Theory: if
w y y
(
k,
r)
0
and(
,
)
r k k r
yN
w y y
,0
1
,
k
{1, 2,
, }
N
and
N
k is a 4 or 8 – connective neighborhood.Then objective function
J
mis convergence.D. M-FCM Algorithm Stages:
The M-FCM algorithm for correcting the similar document into different clusters can be summarized in the following steps.
Step 1: Select the Weighting function, in general, (8)
where ;
Step
2: Select
initial class prototypes
{ }
1 c i iv
, for example
(2
1)
1log(255*
)
2
c i ii
v
c
Set
{
k}
Nk1to equal and very small values (e.g., 0.01). Step 3: Update the partition matrix using (5).Step 4: The prototypes of the clusters are obtained in the form of weighted averages of the patterns using (6).
Step 5: Estimate the bias term using (7).
Repeat Steps 3)–5) till termination. The termination criterion is as follows:
new old
V
V
(9)where
is the Euclidean norm,V
is a vector of clustercenters, and
is a small number that can be set by the user (e.g., 0.01).a. Step 1 – Initialization:
The existing version of the Fuzzy C-means is applied to the set of available patterns by setting the initial cluster number and m to 2. The outputs of this step are the preliminary values for U and the Candidate Data Cluster (CDC) are added to it.
b. Step 2 – Outlier Detection:
a) Cluster Member Assignment:
It is based upon the ideas that developed by Tang et al (2001) in [25]. Every pattern in the fuzzy clustering algorithm has a membership degree in all available clusters. The process of pattern to cluster assignment is done through allocating the pattern to the cluster in which it has the highest membership degree. Matrix M, [mij] c*n is defined
as follows:
b) Local Outlier Detection:
In this sub step the candidates in each cluster to be the final outliers over all of the patterns are selected. This process selects the pattern with the lowest non-zero membership value in vector Mi where i shows the current
cluster (7).
else
U
U
Max
if
U
M
ij ijc i ij ij
,
0
,
1(6)
2 2(
)
k r y y k rw y
y
e
c) Final Outlier Selection and Splitting:
The pattern with the lowest value in the Candidate vector (OP) is selected as the ultimate outlier. The coordinates of OP are used as the basis for the center of a new cluster. Let OP = {op1, op2… opr} be the outlier point,
the new cluster center will be calculated using (Eq.8):
Center (c+1) = OP + λ ( 8)
Where λ = (λ1, λ2… λr) ~ 0.
Having calculated the value of the new cluster center, the previous composition of pattern classifications can be altered and rearranged based on c+ 1 cluster. Matrix U is updated using (Eq. 4) where the upper bound of k is c+1.The modified version of fuzzy C-means is now tuned using the calculated U and c+1 number of clusters and is used to create the new cluster composition. After having split the cluster formation into a new arrangement, the CDC will be updated (Eq. 9). The value obtained from the division of the new CDC to the former CDC is multiplied by a coefficient, α, which is between 0 and 1. To show that splitting has improved the clustering, θt+1 should be larger than θt and
thus the splitting procedure is confirmed and stabilized. The value for α is usually set to 0.2. The θ is named the Feedback Control Parameter (FCP) which controls the system behavior using a feedback from the prior iteration.
1
1 1
1 c
i n
j ij
t M
CDC (9)
t t
t t
CDC CDC
1 ( 1)(1 ) (10)
If the splitting has been unsuccessful 2.c is repeated with the next pattern in the Candidate vector.
c. Step 3 – Test:
If none of the patterns available in the Candidate vector can serve as a successful splitting point for improving the current cluster arrangement, the algorithm will terminate with the current composition on hand else it will increase the number of clusters by one unit and resume algorithm execution
E. Iterative step:
In this step, clusters are refined. Since fuzzy uses cluster centroids as representative of each cluster, this step examines each cluster and decides whether the centroids should change. The algorithm terminates when no more such changes are made.
To determine whether a document should be in a cluster centroid, we need a measure of similarity between the document and the cluster. Thus, we define a measure m(c, x) that denotes the similarity of document x for cluster c. It is defined as the average similarity of x for the documents in the current centroid of cluster c. At each iteration, the value of each m(c, x) is re-calculated. If the value is larger than the threshold
, then document x is put into the centroid of c. However, if for any documenty
c
, the new value of
) , (c y
m , then it is removed from that cluster centroid
Thus, we can speed up the algorithm by using randomization. Rather than calculating every m(c, y) pair, fuzzy recalculates the new value of m(c, y) with the probability of m(c,y) ; i.e. the chance of recalculating the similarity measure is proportional to how close it is to the threshold. This cuts down on many unnecessary calculations while maintaining the cluster quality.
F. Displaying clusters and keywords:
We need to display the final clusters at the end of the algorithm. Each cluster c is represented by the cluster centroids as the representatives. Moreover, for each document y, m(c, y) is used as the measure of similarity. Thus for each cluster, the documents can be sorted by this value to determine its association with the cluster and the results can be displayed accordingly.
One final step is to annotate each cluster with keywords (terms) so that summary information about the clusters can be provided. For each cluster c, we keep track of the terms that appear in the documents of that cluster‟s centroid. For each term in the documents in the centroid, we calculate two values:
a. n, the number of documents in the cluster centroid that it appears in.
b. w
m(c, y) ,yX , where X is theset of all the documents in which the word appears. We ordered the terms by n * w, and displayed the top 6-7 of them. We experimented with different formulae and found this way of calculating keywords for a cluster as the best.
V. EXPERIMENTS & RESULTS
This section describes the results of the various experiments with modified based fuzzy. In order to evaluate the performance, we compared Fuzzy clustering with other algorithms like K-Means, Fractionation and Buckshot [26].
The collective test bed consists of 4000 documents downloaded from the Web. In our experiments we used “Tanimoto coefficient” that written as TC [27, 28] as the similarity measure. It is defined as follows: If
n
1
is the number of terms in the first document and n2 is the number of terms in the second document and m is the number of common terms then the similarity measure between the twodocuments is given by
m n n
m
2
1
. Note that fuzzy does
not preclude the use of other measures. We chose the Tanimoto coefficient because of its simplicity.
We also compared the execution times of all the algorithms for document sets of different sizes.
A. Effectiveness of clustering:
We did many experiments with the document sets of different sizes that are taken from the above-mentioned test bed. All the algorithms were run to produce the same number of clusters with same input parameter settings. Fuzzy formed clusters for each of the different categories in the document sets, while the other algorithms (K-Means, Fractionation and Buckshot) did not. In addition, the other algorithms formed clusters with documents of many categories that are not related to each other.
Initializing the Prototypes. To study the difference between initializing prototypes randomly and using the
0
)
(
1
ij ij
n
j
i
Min
M
where
M
feature vectors, we run the program at same conditions but initialized the prototypes using feature vectors in Table 3 and initialized randomly in Table 4. The resulting clusters were affected by the initial prototype centers.
Table 3 shows the results on Duplicate Document data set. We standardized the feature vectors into[0,1], initialized prototyes using the first Kinit feature vectors, and run the
program by fixing p = 2 and varying the iteration number of fuzzy clustering and Kinit, where iteration number I = 100
and 200, Kinit = 150, 120, 90, 60, 30, 10 and 5. The results
[image:6.595.73.521.153.224.2]were very similar, after 200 iteration, the first cluster contains 56 feature vectors and the second contains 94 feature vectors.
Table 1. Results on the Duplicate Document date set via modified based FCM algorithm (Kinit = 150).
Iterations P = 2 P = 3 P = 4 P = 5
Clusters TC Clusters TC Clusters TC Clusters TC
100 56, 57, 37 2.19E-30 48, 93, 9 1.8E-31 53, 68, 25, 4 0.39E-32 58, 92 2.175 200 56, 94 2.365 57, 93 2.225 57, 93 2.190 58, 92 2.175 300 56, 94 2.365 57, 93 2.225 57, 93 2.190 58, 92 2.175
Table 2 shows the results on Duplicate Document data set under the same condition as in Table 1 except Kinit = 50.
The best result so far was when p = 2 and iteration I >= 100,
the modified TC = 2.385, there are two clusters, one has 56
[image:6.595.79.522.289.359.2]feature vectors, the other has 94.
Table 2. Results on the Duplicate Document Data via Modified Based FCM Algorithm (Kinit = 50).
Iterations P = 2 P = 3 P = 4 P = 5
Clusters TC Clusters TC Clusters TC Clusters TC
[image:6.595.73.519.378.504.2]100 56, 94 2.385 51, 93, 6 9.46E-32 53, 93, 4 1.36E-31 52, 92, 3, 3 3.35E-32 200 56, 94 2.385 57, 93 2.225 57, 93 2.190 52, 92, 6 1.10E-31 300 56, 94 2.385 57, 93 2.225 57, 93 2.190 54, 92, 4 2.00E-31
Table 3. Results on Duplicate Document Data via the Modified Based FCM Algorithm When Prototypes Are Initialized Using Feature Vectors.
Kinit
I = 100 I = 200
Clusters TC Clusters TC
150 56, 57, 37 2.19E-30 56, 94 2.365
120 56, 94 2.355 56, 94 2.355
90 56, 94 2.355 56, 94 2.355
60 56, 94 2.355 56, 94 2.355
30 56, 94 2.405 56, 94 2.405
10 56, 94 2.355 56, 94 2.355
5 50, 94, 6 1.15E-31 56, 94 2.355
[image:6.595.71.522.555.678.2]Table 4 presents the results of the Modified Based FCM algorithm under the same conditions as in Table 3 except initializing the prototypes randomly.
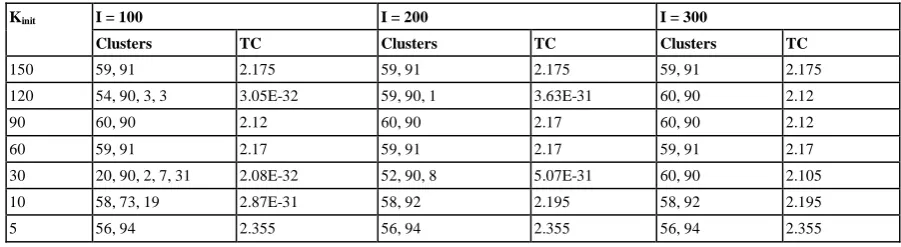
Table 4. Results on Duplicate Document Data via the Modified Based FCM Algorithm When Prototypes Are Initialized Randomly.
Kinit I = 100 I = 200 I = 300
Clusters TC Clusters TC Clusters TC
150 59, 91 2.175 59, 91 2.175 59, 91 2.175 120 54, 90, 3, 3 3.05E-32 59, 90, 1 3.63E-31 60, 90 2.12
90 60, 90 2.12 60, 90 2.17 60, 90 2.12
60 59, 91 2.17 59, 91 2.17 59, 91 2.17
30 20, 90, 2, 7, 31 2.08E-32 52, 90, 8 5.07E-31 60, 90 2.105 10 58, 73, 19 2.87E-31 58, 92 2.195 58, 92 2.195
5 56, 94 2.355 56, 94 2.355 56, 94 2.355
B. Over Convergence.
K = 1.
0 0.5 1 1.5 2 2.5 3 3.5
0 0.2 0.4 0.6
y
x
[image:7.595.39.283.59.498.2]Feature Vectors on Test13
Figure 1: Feature Vectors on Test13
K = 2.
0 0.5 1 1.5 2 2.5 3 3.5
0 0.2 0.4 0.6
y
x
FCM Result on Test13
Figure 2: Clustering Results on Test13
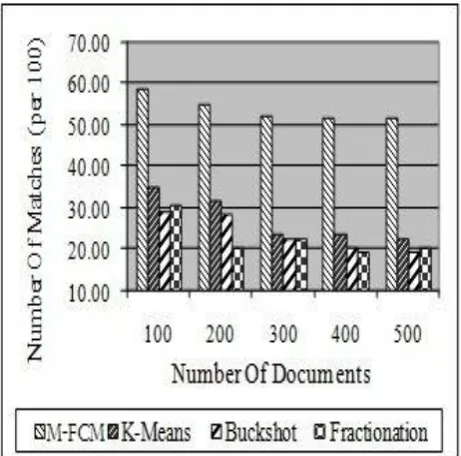
We also measured the effectiveness of the clustering algorithm quantitatively. We compared the clusters formed by the documents against the documents in the original categories and matched the clusters with the categories one-to-one. For each matching, we counted the number of documents that are common in corresponding clusters. The matching with the largest number of common documents is used to measure the effectiveness. This matching can be found by a maximum weight bipartite matching algorithm [29]. We return the number of documents in the matching. The more documents that are matched, the more they resemble the clusters are to the original categories. For our algorithm, and for the purpose of this comparison, we assigned each document to the cluster that has the largest similarity value.
[image:7.595.323.553.61.254.2]Figure 3 shows the number of matches with the original categories for different algorithms averaged on 10 different sets of documents. We can clearly see that fuzzy outperforms the other algorithms in effectiveness.
Figure 3: Comparison of quality of clusters by different clustering algorithms
[image:7.595.328.559.379.607.2]Next we turn to the data set downloaded from the UCI archive in [30], which contains data from various newsgroups. The newsgroups contain topics like atheism, computer graphics, Mac hardware, pc hardware, x-windows, basketball, hockey, cryptography, electronics, space and Christianity. Due to limitation of space, we only show the result of cluster quality comparison in figure 4.
Figure 4: Comparison of quality of clusters by different algorithms on UCI document set
The figure shows that our algorithm worked well with the data from the UCI document archive and clearly outperformed the others.
C. Execution time
Figure 5: Execution times of various clustering algorithms
As the graph shows, the modified based fuzzy outperforms almost all other algorithms in execution time, especially as the number of documents increase.
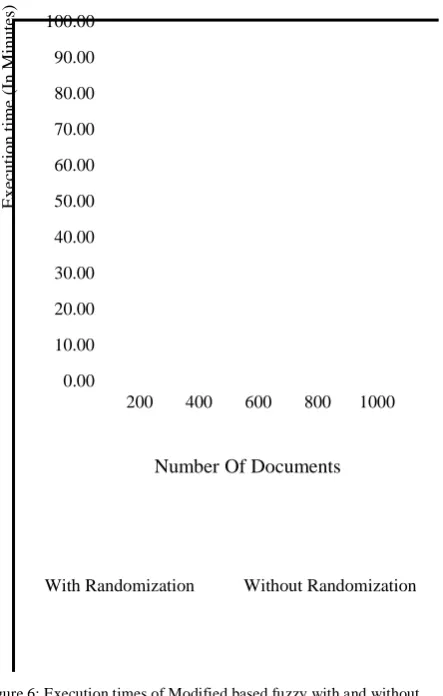
To see how effective randomization is, we compared the execution times of our algorithm with and without randomization.
0.00 10.00 20.00 30.00 40.00 50.00 60.00 70.00 80.00 90.00 100.00
200 400 600 800 1000
Ex
ec
u
ti
o
n
ti
m
e
(In
M
in
u
tes
)
Number Of Documents
[image:8.595.326.555.116.264.2]With Randomization Without Randomization
Figure 6: Execution times of Modified based fuzzy with and without randomization
We can observe from Figure 6 that introducing randomization cuts down the running time significantly. This shows the effectiveness of using the randomization approach.
Of course, we need to justify randomization by comparing the cluster quality. We use the quantitative measure to compare the two algorithms to see if they give similar results.
30.00 40.00 50.00 60.00 70.00
200 400 600 800 1000
N
um
be
r
O
f M
at
che
s
(pe
r
100
)
Number Of Documents
[image:8.595.57.279.364.712.2]Without Randomization With Randomization
Figure 7: shows that both algorithms give roughly the same number of matches. In fact, the difference is less than 5%; thus, we can can justify the
use of randomization to speed up the algorithm.
VI. CONCLUSIONS
In this paper, we proposed new theoretical bases to frame the problem reuse of textual detection. We defined two notions capitals, the invariance and singularity, which allows the consideration based on the sensing (e.g., degree of uniqueness of a feature of a document is a new selection criterion to represent this document). The fuzzy clustering algorithm analyzes the singular brands discursive nature are strong indications to differentiate a document derived from a non- derivative from an original document. It observed from the paper that the discursive and original documents is found themselves in derivatives documentation, which allowed us to identify them. The suspicious text in the original document are matched with the list of other paragraphs that based on the fuzzy compilation of membership data. Then, it undergoes through the initial cluster generation based on set of documents. It evaluated by the local membership function through the modified fuzzy cluster algorithm. Finally the pattern are mapped through the outlier detection method in an iterative stages. The result of similar and dissimilar data are clustered and compared with various existing algorithms.
VII. REFERENCES
[1]. Igo, L. B., Bruning, R., & McCrudden, M. T. (2005). Exploring Differences in Students' Copy-and-Paste Decision Making and Processing: A Mixed-Methods Study. Journal of Educational Psychology, 97(1), 103.
[2]. Hirschtick, R. E. (2006). Copy-and-paste. Jama, 295(20), 2335-2336.
[3]. Berkhin, P. (2006). A survey of clustering data mining techniques. In Grouping multidimensional data (pp. 25-71). Springer Berlin Heidelberg.
[5]. Miyamoto, S. (1990). Fuzzy sets in information retrieval and cluster analysis. Theory and Decision Library, Ser. D: System Theory, Knowledge Engineering and Problem Solving, Dordrecht: Kluwer, 1990,
[6]. Bordogna, G., & Pasi, G. (1993). A fuzzy linguistic approach generalizing boolean information retrieval: A model and its evaluation. JASIS, 44(2), 70-82.
[7]. Ester, M., Kriegel, H. P., Sander, J., & Xu, X. (1996, August). A density-based algorithm for discovering clusters in large spatial databases with noise. In KDD (Vol. 96, pp. 226-231).
[8]. Carson, C., Belongie, S., Greenspan, H., & Malik, J. (2002). Blobworld: Image segmentation using expectation-maximization and its application to image querying. Pattern Analysis and Machine Intelligence, IEEE Transactions on, 24(8), 1026-1038.
[9]. Alzahrani, S., & Salim, N. (2010). Fuzzy semantic-based string similarity for extrinsic plagiarism detection. Braschler and Harman.
[10]. Kummamuru, K., Lotlikar, R., Roy, S., Singal, K., & Krishnapuram, R. (2004, May). A hierarchical monothetic document clustering algorithm for summarization and browsing search results. In Proceedings of the 13th international conference on World Wide Web (pp. 658-665). ACM.Chicago
[11]. Andrews, N. O., & Fox, E. A. (2007). Recent developments in document clustering. Computer Science, Virginia Tech, Tech Rep.
[12]. Willett, P. (1988). Recent trends in hierarchic document clustering: a critical review. Information Processing & Management, 24(5), 577-597.
[13]. Hinneburg, A., & Keim, D. A. (1998, August). An efficient approach to clustering in large multimedia databases with noise. In KDD (Vol. 98, pp. 58-65).
[14]. Chim, H., & Deng, X. (2008). Efficient phrase-based document similarity for clustering. Knowledge and Data Engineering, IEEE Transactions on, 20(9), 1217-1229. [15]. Karypis, G., Aggarwal, R., Kumar, V., & Shekhar, S.
(1999). Multilevel hypergraph partitioning: applications in VLSI domain. Very Large Scale Integration (VLSI) Systems, IEEE Transactions on, 7(1), 69-79.Chicago [16]. Tamayo, P., Slonim, D., Mesirov, J., Zhu, Q., Kitareewan,
S., Dmitrovsky, E., ... & Golub, T. R. (1999). Interpreting patterns of gene expression with self-organizing maps: methods and application to hematopoietic differentiation. Proceedings of the National Academy of Sciences, 96(6), 2907-2912.
[17]. Engels, S., Lakshmanan, V., & Craig, M. (2007, March). Plagiarism detection using feature-based neural networks. In ACM SIGCSE Bulletin (Vol. 39, No. 1, pp. 34-38). ACM.
[18]. Singhe, S., & Tweedie, F. J. (1995, June). Neural networks and disputed authorship: New challenges. In Artificial Neural Networks, 1995., Fourth International Conference on (pp. 24-28). IET.
[19]. Riska, A., Diev, V., & Smirni, E. (2004). An EM-based technique for approximating long-tailed data sets with PH distributions. Performance Evaluation, 55(1), 147-164. [20]. Chow, T. W., & Rahman, M. K. M. (2009). Multilayer som
with tree-structured data for efficient document retrieval and plagiarism detection. Neural Networks, IEEE Transactions on, 20(9), 1385-1402.
[21]. Chiu, S. L. (1994). Fuzzy model identification based on cluster estimation. Journal of intelligent and Fuzzy systems, 2(3), 267-278.
[22]. Ahmed, M. N., Yamany, S. M., Mohamed, N., Farag, A. A., & Moriarty, T. (2002). A modified fuzzy c-means algorithm for bias field estimation and segmentation of MRI data. Medical Imaging, IEEE Transactions on, 21(3), 193-199.
[23]. Siyal, M. Y., & Yu, L. (2005). An intelligent modified fuzzy< i> c</i>-means based algorithm for bias estimation and segmentation of brain MRI. Pattern Recognition Letters, 26(13), 2052-2062.
[24]. Bezdek, J. C., Ehrlich, R., & Full, W. (1984). FCM: The fuzzy< i> c</i>-means clustering algorithm. Computers & Geosciences, 10(2), 191-203.
[25]. Tang, J., Chen, Z., Fu, A. W. C., & Cheung, D. (2001). A robust outlier detection scheme for large data sets. In In 6th Pacific-Asia Conf. on Knowledge Discovery and Data Mining.
[26]. Kishida, K. (2010). High speed rough clustering for very large document collections. Journal of the American Society for Information Science and Technology, 61(6), 1092-1104.
[27]. Godden, J. W., Xue, L., & Bajorath, J. (2000). Combinatorial preferences affect molecular similarity/diversity calculations using binary fingerprints and Tanimoto coefficients. Journal of Chemical Information and Computer Sciences, 40(1), 163-166. [28]. Lipkus, A. H. (1999). A proof of the triangle inequality for
the Tanimoto distance. Journal of Mathematical Chemistry, 26(1-3), 263-265.
[29]. Karp, R. M., Vazirani, U. V., & Vazirani, V. V. (1990, April). An optimal algorithm for on-line bipartite matching. In Proceedings of the twenty-second annual ACM symposium on Theory of computing (pp. 352-358). ACM. [30]. Bay, S. D., Kibler, D., Pazzani, M. J., & Smyth, P. (2000).