Tanaffos (2005) 4(14), 19-23
©2005 NRITLD, National Research Institute of Tuberculosis and Lung Disease, Iran
Reference Values for Maximal Respiratory Pressures
Babak Amra, Hassan salehi, Sohrab Salimi, Mohammad Golshan
Department of Pulmonary Medicine, Isfahan University of Medical Sciences and Health Services, ISFAHAN-IRAN.
ABSTRACT
Background: Maximal respiratory pressures are suitable for non –invasive evaluation of respiratory muscle function
A variety of methods for subject selection and test procedures have been used for the determination of normal values and
referenceequations for maximal respiratory pressure (MRP).
Materials and Methods: we analyzed a well-defined,healthy subgroup of 224 men and 211 women with a wide age range
(20 to 82 yr), using multiple linear regression, for the purposeof determining the effect of age, other correlates, normal
values,and gender-specific reference equations on MRP.
Results: Mean values of maximal inspiratory pressure (MIP) were 9.78 kPa for men and 7.61 kPa for women. Mean values
of maximal expiratory pressure (MEP) were 13.11kPa for men and 10.21 kPa for women.
Conclusion: Prediction equations and mean value normally resulted from a cohort study of healthy 20-82 yrs subjects are
given and are recommended to be used by pulmonary function laboratories in IRAN.(Tanaffos 2005; 4(14): 19-23)
Key words: PImax; PEmax; Respiratory muscle; Reference values
INTRODUCTION
Measurement of maximal respiratory pressure (MRP) is a simple, quick and noninvasive clinical procedure for determining inspiratory and expiratory muscle strength both in healthy subjects and in patients with pulmonary or neuromuscular diseases (1). In the latter group, MRP is both indicative of ventilatory capacity,a good predictor of development of respiratory insufficiency (2), as well as a useful value in assessing the degree of abnormality and monitoringinspiratory muscle weakness in individual patients over the time (3). MRP is also helpful in
Correspondence to: Amra B
Address:Isfahan, P.O.Box: 81655/755
Email address: [email protected]
conflicting in local population lacking native values (9).
Applicable normal values for PImax and PEmax are not available for the Iranian population.
In this study we measured MRP in a general population in Isfahan-Iran, and developed prediction equations to predict reference values for PImax and PEmax.
MATERIALS AND METHODS
The Institutional Review Board for medical ethics at Isfahan Medical School approved the research protocol. During a 12-month period from Feb. 2004 to Feb 2005, a population of 892 healthy subjects, mainly relatives of patients in a pulmonary clinic in Isfahan, and some randomly selected school children and teachers were invited to take part in the study, including a meticulous medical history, physical examination and pulmonary function testing; of whom 712 subjects or guardians, agreed to be enrolled (response rate= 80%). The exclusion criteria were: current respiratory complaints, history of ever smoking regularly, history of serious pulmonary, cardiac, and/or neuromuscular diseases, physical findings suggesting cardiopulmonary disease and evident chest deformity or neuromuscular deficit. Subjects were included in the study if they did not meet any of the exclusion criteria. Height was measured to the nearest centimeter. Subjects were measured without shoes, standing against the wall (buttocks, back, and head against the wall) with their head erect in the Frankfort horizontal plane. Their backs against the wall and arms spread in a straight line parallel to the floor. A carpenter's square was placed against the wall and head, the subject was asked to step away from the wall, and height was measured from the floor to the bottom of the square with a metal rule attached to the wall.
Age was obtained by asking the subjects. In most cases, insurance cards, or identity documents were
checked and confirmed the accuracy of the stated age.
MIP, MEP and Spirometric Measurements
MIP and MEP measurements were performed, using a body plethysmography machine (ZAN 500 body II), with software,which allowed visualization of real-time and pressure-time measurements. A single experienced technician performed all the measurements. The subjects were instructed to exhale to residual volume (RV) or inhale to total lung capacity (TLC) before attempting to inhale or exhale maximally against an occluded mouthpiece to obtain PImax and PEmax, respectively. Inspiratory or expiratory effort was sustained for at least one second. As these tests were representing maximal respiratory muscle functions, the highest measured pressures were recorded. After appropriate coaching, the best of three technically acceptable attempts was recorded in kilopascal.
further maneuvers were obtained until the reproducibility criteria were satisfied or 8 maneuvers were obtained. The instrument met the accuracy criteria of the ATS (11) and, as reported earlier, reproducibility criteria were met when the second largest FEV1 and FVC were within5% of the largest
values. Predicted FEV1% was calculatedby dividing
the observed FEV1 by the corresponding predicted
FEV1values.
RESULTS
Five hundred and thirty-two healthy adults, aged 20-60 yrs fulfilled the criteria to be enrolled in the study.
Cross-sectional analysis of the data was performed with SPSS software (Spss Inc, Chicago, IL, USA). Stepwise multiple regressionmodels were constructed, using MIP as the dependent variable. Independent candidate predictors were based on data from previous studies and on plausibility (12). Candidate predictors included age, height, weight, Body Mass Index (BMI), FEV1, FVC, peak expiratory flow (PEF),andthe interaction of gender stepwise multiple regression models were constructed, using MIP and MEP as the dependent variables.
MIP and MEP results for the entire cohort (n= 435) were analyzed separately by gender (Table 1). Moreover, MIP and MEP, in absoluteterms, are smaller in women than men in all age groups.
Separate regression analyses for men and women were conducted to determine the correlates of MIP among the samples.
Regression analyses of the data showed that age was a very strong negative predictor of MIP and MEP. Height and weight were positive predictors of MIP and MEP.
Reference equations were constructed separately by gender, using the two sets of healthy men and healthy women, respectively.
Table 1. Anthropometric characteristics of the population
Men(n=224) Women(n=211) Mean ± SD Mean ± SD
PI max(kpa) 9.78 ± 3.36 7.61± 2.32
PE max(kpa) 4.44±13.11 10.21± 3.10
Age(year ) 40.08 ±16.77 36.67±12.65
Height(cm) 172.12 ± 6.02 158.34± 5.62
Weight(kg) 74.86±10.82 64.81 ± 11.16
BMI 25.28 ±3.51 25.89 ±4.49
FVC 4.71± 0.70 3.42 ± 0.55
FEV1 3.97± 0.64 2.94± 0.49
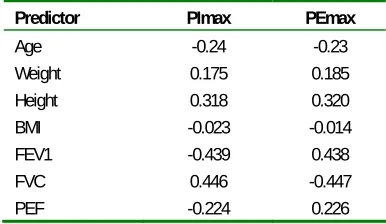
Table 2. Correlation factors between PEmax, PImax and various
predictor parameters
Predictor PImax PEmax
Age -0.24 -0.23
Weight 0.175 0.185
Height 0.318 0.320
BMI -0.023 -0.014
FEV1 -0.439 0.438
FVC 0.446 -0.447
PEF -0.224 0.226
* Correlation factors have been included if significant at P<0.05 using two tailed
test
Table 3. Prediction equations
Parameter equation r2 † SEE ‡
Males
PImax 0.065*age+12.369 0.16 3.7
PImax LLN -0.090*age + 12.369
PEmax -0.109*age+17.150 0.112 4.8 PEmax LLN -0.159*age+17.150
Females
PImax -0.070*age+0.132*BMI+6.781 0.077 2.49 PImax LLN -0.097*age+0.132*BMI+6.781
PEmax -0.063*age+0.230*BMI+6.509 0.069 3.3 PEmax LLN -0.104*age+0.230*BMI+6.509
† r2=coefficient of determination
DISCUSSION
MIP is an indicator of inspiratory muscle strength and a major determinant of vital capacity(13). Decline in inspiratory muscle strength,if severe, can lead to impaired airway clearance and inadequate ventilation (14). MIP is known to be decreased in pulmonary diseases such as COPD (15), degenerative neuromuscular diseases(16), congestive heart failure (5), and during long-term corticosteroid treatment (17). Because of the widely varying techniques of measuring MIP and/or MEP used in the published studies (7) and differences in population selection (12), and also racial differences (9); we believe that it is importantto establish local reference equations for MIP for a well-defined, healthypopulation spanning a wide range of ages.
Since MIP and MEP values are affected by great inter-subject variability (18), the standard deviations are relatively wide with a resultant decrement of the coefficient of determination (r2), and increment of the standard error of the estimate (SEE). Most of the previously reported prediction equations are affected by such a problem (19), revealing the fact that the MIP and MEP values have to be interpreted cautiously (19).
The measured MIP values in our series were markedly less than those reported in American and European studies (1), however the values were comparable to Asian reports (9). Our results demonstrated a very strong gender effect, which is consistent with all previous findingsreported in the literature (19). In one study, MIP in men was about 30% higherthan in women (13). This later report is rather consistent with our results.
Our results showed the importance of age as a significant negative predictor of MIP for both men and women, a finding consistent with most of the previous reports, including: Harik-Khan and colleagues (12) and Vincken et al (6). Both of the latter studies used population groups with wideage
ranges. Enright and coworkers (4) had also reported similar results in elderly subjects.
In our series weight is a significant positive predictor of MIP in healthy women and with lesser strength in healthy men, a finding consistent with thatof Leech’s study (13).The positive effect of body weight on MIP may be due in part tothe relationship between weight and the isometric length of different muscle groups (20), and to the fact that alterations in body weight have been shown to affect the diaphragm muscle mass (21).Schoenberg et al. (22) called the improvement in lung function that accompanied minimal weight increases, the "muscularity effect," and speculated that it is attributable to increased respiratorymuscle force.
In summary, we measured MIP in a healthy subgroup of subjects, using a standardized electronic procedure. In addition to showing a strong gender effect, MIP decreased with age in both men and women. The decline in men was larger than that of women. The reference equations derived from this study are useful in assessing the strength of inspiratory muscles.
REFERENCES
1. Wohlgemuth M, van der Kooi EL, Hendriks JC, Padberg GW, Folgering HT. Face mask spirometry and respiratory pressures in normal subjects. Eur Respir J 2003; 22 (6): 1001- 6.
2. Hart N, Polkey MI, Sharshar T, Falaize L, Fauroux B, Raphael JC, et al. Limitations of sniff nasal pressure in patients with severe neuromuscular weakness. J Neurol Neurosurg Psychiatry 2003; 74 (12): 1685- 7.
3. McElvaney G, Blackie S, Morrison NJ, Wilcox PG, Fairbarn MS, Pardy RL. Maximal static respiratory pressures in the normal elderly. Am Rev Respir Dis 1989; 139 (1): 277- 81. 4. Enright PL, Kronmal RA, Manolio TA, Schenker MB, Hyatt
Group. Am J Respir Crit Care Med 1994; 149 (2 Pt 1): 430-8.
5. van der Palen J, Rea TD, Manolio TA, Lumley T, Newman AB, Tracy RP, et al. Respiratory muscle strength and the risk of incident cardiovascular events. Thorax 2004; 59 (12): 1063- 7.
6. Vincken W, Ghezzo H, Cosio MG. Maximal static respiratory pressures in adults: normal values and their relationship to determinants of respiratory function. Bull Eur Physiopathol Respir 1987; 23 (5): 435- 9.
7. American Thoracic Society/European Respiratory Society. ATS/ERS Statement on respiratory muscle testing. Am J Respir Crit Care Med 2002; 166 (4): 518- 624.
8. Hautmann H, Hefele S, Schotten K, Huber RM. Maximal inspiratory mouth pressures (PImax) in healthy subjects--what is the lower limit of normal? Respir Med 2000; 94 (7): 689- 93.
9. Johan A, Chan CC, Chia HP, Chan OY, Wang YT. Maximal respiratory pressures in adult Chinese, Malays and Indians. Eur Respir J 1997; 10 (12): 2825- 8.
10.Golshan M, Nematbakhsh M, Amra B, Crapo RO. Spirometric reference values in a large Middle Eastern population. Eur Respir J 2003; 22 (3): 529- 34. Erratum in: Eur Respir J 2004; 23 (2): 356.
11.Gardner RM, Hankinson JL, West BJ. Evaluating commercially available spirometers. Am Rev Respir Dis 1980; 121 (1): 73- 82.
12.Harik-Khan RI, Wise RA, Fozard JL. Determinants of maximal inspiratory pressure. The Baltimore Longitudinal Study of Aging. Am J Respir Crit Care Med 1998; 158 (5 Pt 1): 1459- 64.
13.Leech JA, Ghezzo H, Stevens D, Becklake MR. Respiratory pressures and function in young adults. Am Rev Respir Dis 1983; 128 (1): 17- 23.
14.Berry JK, Vitalo CA, Larson JL, Patel M, Kim MJ. Respiratory muscle strength in older adults. Nurs Res 1996; 45 (3): 154- 9.
15.Nishimura Y, Tsutsumi M, Nakata H, Tsunenari T, Maeda H, Yokoyama M. Relationship between respiratory muscle
strength and lean body mass in men with COPD. Chest 1995; 107 (5): 1232- 6.
16.Foglio K, Clini E, Facchetti D, Vitacca M, Marangoni S, Bonomelli M, et al. Respiratory muscle function and exercise capacity in multiple sclerosis. Eur Respir J 1994; 7 (1): 23- 8.
17.Perez T, Becquart LA, Stach B, Wallaert B, Tonnel AB. Inspiratory muscle strength and endurance in steroid-dependent asthma. Am J Respir Crit Care Med 1996; 153 (2): 610- 5.
18.Smyth RJ, Chapman KR, Rebuck AS. Maximal inspiratory and expiratory pressures in adolescents. Normal values. Chest 1984; 86 (4): 568- 72.
19.Windisch W, Hennings E, Sorichter S, Hamm H, Criee CP. Peak or plateau maximal inspiratory mouth pressure: which is best? Eur Respir J 2004; 23 (5): 708- 13.
20.Tornvall, G... Assessment of physical capabilities. Acta Physiol. Scand 1963 201(Suppl.): 1- 102 .
21.Arora NS, Rochester DF. Effect of body weight and muscularity on human diaphragm muscle mass, thickness, and area. J Appl Physiol 1982; 52 (1): 64- 70.