2016 Joint International Conference on Artificial Intelligence and Computer Engineering (AICE 2016) and International Conference on Network and Communication Security (NCS 2016)
ISBN: 978-1-60595-362-5
Pedestrian Re-identification by Graph Clustering
Hai-Sheng CHEN
1,a, Dan TU
2,b,*, Jun LEI
3,cCollege of Information System and Management, National University of Defense Technology, Changsha, Hunan, China
[email protected] *Corresponding author
Keywords: Pedestrian, Graph Partitioning, Multi-camera.
Abstract. Matching people in multi-camera views, known as pedestrian re-identification problem, is a challenge task. Searching a designated pedestrian at the entire monitoring scene has been achieved in previous work. However, the existing results only return a sequence of pedestrian images ranked by the similarity with the input image, rather than matched images. In this paper, we use graph partitioning methods to solve the pedestrian re-identification problem. We first get a similarity matrix by calculating the similarity between each image and others. Then we consider the matrix as an undirected graph and use graph partitioning methods to partition it. The result of graph partitioning corresponds to the classification of pedestrian images. The main contributions of this paper include 1) we estimate the number of pedestrians on the multi-camera views, 2) we label a same object ID for sample images of the same pedestrian.
Introduction
We capture pedestrian sample images through the pedestrian detection technology from the camera surveillance network, and achieve the aim of automatic classification for these sample images, labeling a same object ID for sample images of the same pedestrian.
In the previous work [1], researchers consider a pedestrian image as the probe image, and then search images which are more similar with the probe image according to the similarity index (the images of the same person are usually more similar). At last, they rank the results and return the first t images. However, this kind of methods, especially the selection of the threshold t, neither
guarantee to return all the captured images belonging to the selected pedestrian, nor guarantee that all the returned images belong to the probe pedestrian. In this paper, we return all the captured images for an arbitrary pedestrian though the number of captured images of each pedestrian is unknown and not equal, leading to the threshold t useless.
We consider the person re-identification task as a clustering problem instead of searching and ranking. Specifically, in a surveillance network consisting ofncameras, each camera capturesNi pedestrian images, denotingNsum N N( ,1 2,Nn)as the number of all the captured sample images, and supposempedestrians appear in the images. According to [2], we know those images
from the same pedestrian are more similar in many features performance such as color, texture et al. Therefore, we classify the N pedestrian images into m clusters ( , , ,p p1 2 pm) according to similarities, and each cluster corresponds to each person. Then, we get the sequence of appearances for each pedestrian in the camera monitoring scene, and each sequence includes a person’s images captured at different time and place by an arbitrarily camera.
is high. In fact, dColorSIFT [1] describes the feature of a pedestrian image with a10 dimensional 6
vector, which products expensive computation cost.
The optimum solution for the graph clustering problem is a NP hard problem, and the different relaxation conditions correspond to several different common graph partitioning methods: SymNMF [3], a method based on the non-negative decomposition of binary graph; Spectral clustering method (SC) [4 5], consider the orthogonality but ignore non negative and discrete of the final solution, and is same with SymNMF when consider strictly orthogonality constraints; CAC [6], consistent approximate graph clustering (CAC), keep strictly non negative and effectively orthogonality.
[image:2.612.80.536.295.423.2]All of the above methods need to set the clusters number before starting graph partitioning. However, the number of clustering is unknown in the real circumstance. Considering the modulity concept proposed in GN algorithm [7]—a classical algorithm for the network community partition problem, we consider the pedestrian similarity graph partitioning problem as a kind of network community division problem, and estimate the cluster number by using the modulity curve. In the community division problem, a community represents a person, and the number of different communities corresponds to different modularity value. Usually, the max value of modularity corresponds to the most likely number of communities.
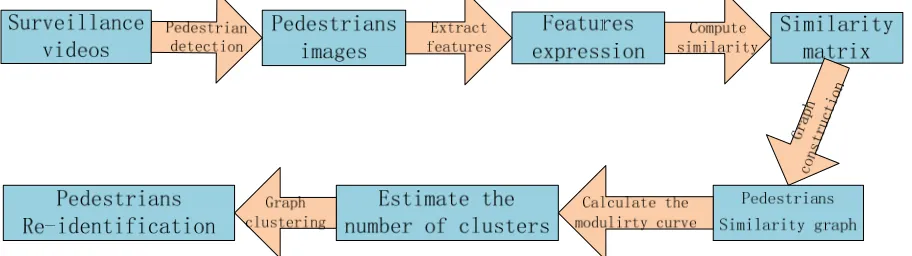
Figure 1. The whole process of pedestrian re-identification.
The whole process of the pedestrian re-identification task is showed in Fig.1. Firstly, we randomly select some pedestrians’ images from the ETHZ dataset [8] to construct similarity graph, and then use three graph partitioning methods to solve the graph clustering problem. We use the clustering accuracy (AC) and the standard mutual information (MI) to evaluate the clustering
results [9]. All the three methods have a good performance in the experiment.
The rest of this paper is organized as follows. Section 2 introduces the feature representation of pedestrian images and similarity graph construction. In Section 3, we introduce several typical graph partitioning methods. Experimental results are presented in Section 4. Finally, conclusions are drawn in Section 5.
Graph Construction
When we cope with the pedestrian clustering problem in the multi-video surveillance scene, we first extract features of pedestrian images, and then construct the similarity graph.
Features Representation of Pedestrian Samples
In the experiment, all the pedestrian images are normalized to32 64 , and patches of size 10×10 pixels are sampled on a dense grid with a grid step size 4; 32-bin color histograms are computed in L, A, B channels respectively, and in each channel, 3 levels of downsampling are used with scaling factors 0.5, 0.75 and 1; SIFT features are also extracted in 3 color channels and thus produces a 128×3 feature vector for each patch. In a summary, each patch is finally represented by a discriminative descriptor vector with length 32×3×3 + 128×3 = 672. We denote the combined feature vector as dColorSIFT.
Graph Construction
Rui Zhao et al. [1] design an ingenious function to measure similarity, and we use this similarity function to calculate the similarity matrix. Then we usep-nearest neighbor method to convert the
similarity matrix to p-nearest neighbor graph [10]. In the N N similarity matrix, w i j( , )
represents the similarity between the image iand image j. ( , )w i j is retained if image vertexjis
among the p-nearest neighbors of vertexiand we can adopt the symmetrisation process to obtain a
symmetric graph. Retain or discard each ( , )w i j as follows:
( , ), ( ( , )) ( , )
0,
w i j rank w i j P w i j
otherwise
. (1)
Whererank w i j( ( , )) is the location of ( , )w i j in the rank sequence of all the pairwise similarities
between imageiand others.
Graph Partitioning
The graph clustering problem is usually formalized as the graph cut or partitioning problem [15]. The common partition criteria include Minimum cut [16], RadioCut [12], Average cut [17], normalized cut (Ncut) [11] and so on. These criteria will lead to discrete optimization problems, finding the optimal solution of the graph cut is NP-hard. Some relax conditions are considered when solving this problem and lead to several typical graph partitioning methods, and we use the methods to partition the graph respectively in our experiments.
Several Graph Partitioning Methods Comparison
Methods Comparison. One of the famous relaxations is discarding the discreteness condition and instead allowing solution vector to take arbitrary values in R, which leads to spectral clustering (SC) methods [5, 12]. SC uses eigenvectors of the adjacency matrix derived from the data for partitioning of graphs, which is a well-established framework for graph clustering. In fact, SC considers the orthogonality but ignores the non-negativity and the discreteness of the final solution.
Therefore, the ideal relaxation should consider the non-negative constraints, the orthogonality constraints and the discreteness constraints. As a result, non-negative aplacian embedding [21] and Sym non-negative matrix factorization (NMF) [19, 20] (SymNMF is equal to SC under strict orthogonality constraints) can retain the non-negativity rigorously and enforce the orthogonality approximately at the same time.
A novel method named congruent approximate graph clustering (CAC) is proposed. CAC can retain the non-negativity rigorously and can enforce the orthogonality efficiently. In addition, it is closer to the optimal solution.
Measure Index. We use clustering accuracy (AC) and normalized mutual information (MI)
measure the clustering results [23]. ACis defined as:
* 1 ( , ).
N i i
i l l
AC
N
( , )x y
is a delta function, the value is 1 whenx y,otherwise is 0. liis the true class label of xi,
*
i
l is the assigned label by graph clustering methods.
The MI metric of two sets of clustersCandC' is defined as follows
, ' '
( , ')
( , ') ( , ') log .
( ) ( ')
i j
i j i j
c C c C i j
p c c MI C C p c c
p c p c
(3)where p c( )i and p c( ')j are the probabilities that a sample belongs to the clusterci andcj' respectively, and ( , ')p c ci j is the joint probability. The normalized MIas follows
( , ')
( , ') .
max( ( ), ( '))
MI C C MI C C
H C H C
(4)
where ( )H C and ( ')H C are the entropies ofCandC'.
Estimate the Number of Clusters
The number of pedestrians is required when we use the graph partitioning methods mentioned in section 3.1.1. However, the number of pedestrians is unknown in the pedestrian similarity graph. So we need to estimate the number of pedestrian according to the similarity graph. In this work, we use the modulity concept proposed in GN algorithm to make the estimation.
GN algorithm [24] is a classical algorithm for Network community Division problem. The concept of betweenness is used in graph partitioning, the betweenness is defined: number of shortest paths from all vertices to all others that pass through that edge. The GN algorithm is as follows: remove the edges with the maximum betweenness from the network iteratively until the network is decomposed into each leaf node. In order to find the most likely number of communities the network conclude, modulity is proposed.
Modulity is defined as follows: If the network is divided intongroups, then we define n n
symmetric matrixe, the elementeijrepresents the ratio between the number of edges linking nodes
in communityiand j and the number of all the edges in the whole network. Tre= ii
ie
represents the ratio between the number of edges in the internal community and the number of all the edges in the whole network. The sum of rows(or cols) i ijj
a
e represents the ration between the numberof edges in the communityiand the number of all the edges in the network. According to the
definitions, we can get eij ai aj. So modulity function is defined as:
2 2
( ii i)
i
Q
e a Tre e . (5)2
e is the matrix norm ofe2, namely, the sum of all elements ine2.
We consider the graph partitioning problem as a kind of Network community Division problem, where each community represents a pedestrian. With the number of communities increasing, the modulity value increases at first and then decrease after the peak. Therefore, we draw the modulity curve according to the similarity graph and consider the community number corresponding to the maximum value in the modulity curve as the estimate number of pedestrians.
Experiment
We use a part of ETHZ dataset [25] to conduct experiments, because the ETHZ is too large. In
this section, we randomly select pedestrians’ images from the ETHZ dataset for experiments, and
Dataset1:146 sample images from 146 pedestrians, and we increase the number of samples of
each pedestrian to get an expanded version, the larger one consists of 1440 images.
Dataset2:146 sample images from 11 pedestrians, and the number of samples of each pedestrian
is not exactly same but the difference is not large.
Dataset3:837 sample images from 11 pedestrians, the number of samples of each pedestrian is
not the same and the difference is large. The 11 pedestrians is the same with the last one, and the bigger number of one pedestrian reach 182, 353 while the smaller as 7, 10.
For each selected dataset, we get the similarity matrix by calculating the similarities between each image and others, and then use p-nearest neighbor method to construct a graph. Denoting sparse_p as the value of p, we derive multiple graphs from similarity matrix by using different sparse_p. Then we partition these graphs and evaluate the results by ACand MI.
Visualize the Graph
We get the similarity matrix by calculating the pairwise similarities of those pedestrians’ images, then we construct the p-nearest neighbor graph based on the matrix of different dataset.
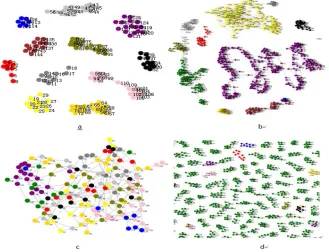
In the undirected graph, each vertex represents an image, and the weight of edge represents the similarity. In order to represent the result more clearly, we put gravitation on similarity, which means the distance of nodes having greater similarity is closer, and vice versa. The visual layouts of these graphs are presented in Fig. 2.
Figure 2. (a) the visual layout of 146 images from 11 pedestrians (b) the visual layout of 837 images from 11 pedestrians (c) the visual layout of 146 images from 146 pedestrians (d) the visual layout of
1440 images from 146 pedestrians.
We can see the images describing the same pedestrian show a good aggregation property as presented in Fig. 2a and Fig. 2b. While the images from different pedestrian distribute messily as presented in Fig. 2c and show the aggregation property around the pedestrian when the images number of each pedestrian increase as presented in Fig. 2d.
Evaluate the Clusters
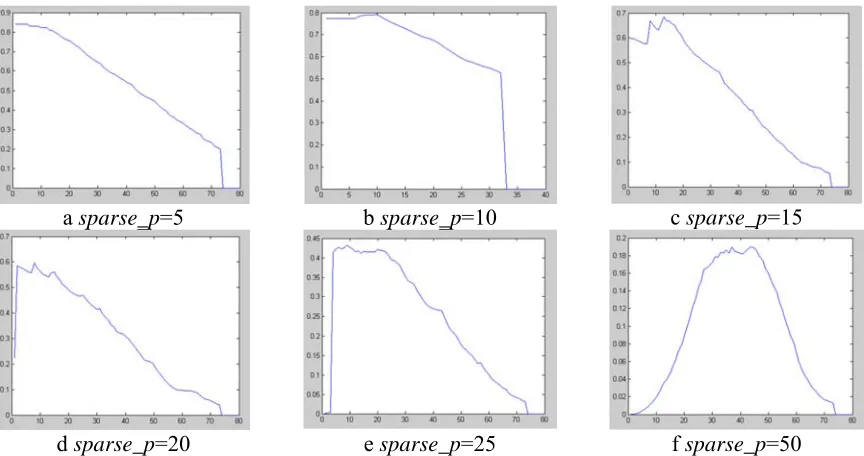
In terms of Dataset2, we derive multiple graphs from similarity matrix by using different values
ofsparse_ p, and then GN algorithm is used to compute the modulity curves which are showed in
[image:5.612.145.474.318.570.2]a sparse_p=5 b sparse_p=10 c sparse_p=15
[image:6.612.91.523.64.292.2]d sparse_p=20 e sparse_p=25 f sparse_p=50
Figure 3. The modulity curves of the similarity graph of 146 images from 11 pedestrians constructed in different sparse_ p values.
Denote max_modulity as the maximum value of the modulity, and num_community as the
corresponding number of communities. The results are showed in Table 1. The optimal number of communities got by the modulity curve is related to thesparse_ p value. When 7<sparse_ p<25,
the optimal number of communities is around 11.
Table 1. The maximum modulity value and the most probable communities number of each graph.
sparse_p 5 7 8 10 12 15 20 25 50
max_modulity 0.8395 0.8440 0.8212 0.8005 0.7915 0.6850 0.5972 0.4316 0.1899
num_community 6 10 11 11 11 14 9 10 45
Graph Partitioning
Experiment on Dataset2.Firstly, we display the visual layout of the 146 images which are from 11 pedestrians. These graphs clearly show the cluster property as shown in Fig. 4.
[image:6.612.173.441.520.716.2]It’s obvious that SC, CAC perform better than SymNMF and all the three methods perform well on Dataset2 as shown in Table 2. In this part, the p-nearest neighbor method is a good method to
construct an ideal graph to get an ideal clustering result.
Table 2. The graph clustering results of Dataset2.
Dataset3 AC MI
sparse_p SymNMF SC CAC SymNMF SC CAC
5 0.8411 0.9130 0.9389 0.4600 0.9559 0.9189
7 0.8767 0.8699 0.9904 0.6092 0.9625 0.9886
10 0.8219 0.8699 0.9781 0.7707 0.8804 0.9753
25 0.7055 0.7123 0.8808 0.9373 0.8371 0.9496
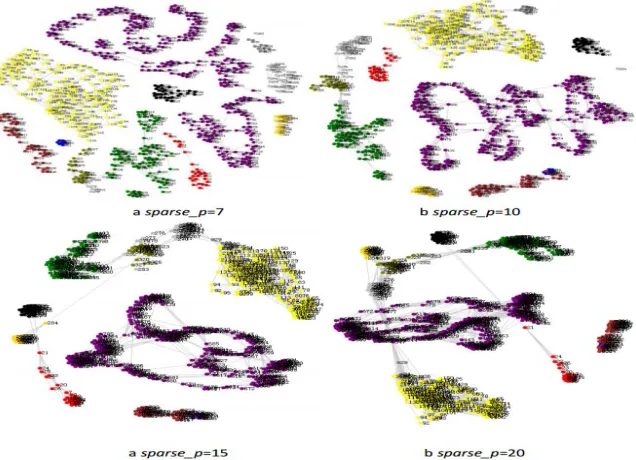
[image:7.612.148.466.268.498.2]Experiment on Dataset3. Firstly, we display the visual layout of the 837 images which are from 11 pedestrians. These graphs also show obvious cluster property as shown in Fig. 5.
Figure 5. The visual layout of the similarity graph of 837 images from 11 pedestrians constructed in different sparse_ p value.
The graph clustering results on Dataset3 are showed in Table 3. We can see SC, CAC perform
better than SymNMF and all the three methods perform relatively poor. In fact, the difference of the images number of each pedestrian is too large and p-nearest neighbor method is not able to
construct an ideal graph to get a good enough clustering result. But the current result is still inspiring and shows strong clustering ability.
Table 3. The graph clustering results of Dataset3.
Dataset3 AC MI
sparse_p SymNMF SC CAC SymNMF SC CAC
7 0.4516 0.7300 0.5642 0.1454 0.9251 0.6534
10 0.4576 0.6703 0.6351 0.2053 0.7304 0.6966
15 0.4758 0.5830 0.6569 0.2650 0.6953 0.7313
Conclusion and Future Work
We construct a new framework to achieve the task of person re-identification. We calculate the similarity matrix of the pedestrians’ images and construct the similarity graph, then GN algorithm is used to evaluate the number of clusters and partition the graph. The graph partitioning result corresponds to the pedestrians clustering results. Through analyzing each pedestrian clustering result in the experiments, we can see the appearance frequency and which cameras the input person appear in.
There are two aspects that can be explored in the future: First, p-nearest neighbor method is
simple and effective to construct a similarity graph when the samples number are almost equal, but it does not perform good any more when the samples number difference are significant. In this condition, we can use other graph construction methods such as LSR [28], l1 [27], LLE [26] to get better pedestrian similarity graph. Second, although GN algorithm usually have a good effect on evaluating the number of clusters, we also notice that its effects are relevant to graph construction. Therefore, it will be meaningful to try some eigenvalue heuristic methods [29].
References
[1] Zhao, Rui, Ouyang, Wanli, Wang, Xiaogang. Unsupervised Salience Learning for Person Re-identification [C]// 2013: 3586-3593.
[2] Wang X. Intelligent multi-camera video surveillance: A review [J]. Pattern Recognition Letters, 2013, 34(1): 3-19.
[3] Ding C.H.Q., He X. On the Equivalence of Nonnegative Matrix Factorization and Spectral Clustering. [C]// Siam International Conference on Data Mining. 2005.
[4] Dhillon I.S., Guan Y., Kulis B. Kernel k-means: spectral clustering and normalized cuts [C]// Tenth ACM SIGKDD International Conference on Knowledge Discovery and Data Mining. ACM, 2004: 551--556.
[5] Malik J., Shi J. Normalized cuts and image segmentation [J]. IEEE Trans.pattern Anal.mach.intell, 2000, 22(8): 888-905.
[6] Ren W., Li G., Tu D. Graph clustering by congruency approximation [J]. Iet Computer Vision, 2015, 9(6): 841-849.
[7] Hui D.U. Application of GN Algorithm in Product Module Partition [J]. International Journal of Digital Content Technology & Its Applications, 2012, 6(14): 236-245.
[8] Schwartz, W.R., Davis, L.S. Learning Discriminative Appearance-Based Models Using Partial Least Squares [C]// Xxii Brazilian Symposium on Computer Graphics and Image Processing. IEEE Computer Society, 2009: 322-329.
[9] Xu W., Liu X., Gong Y. Document clustering based on non-negative matrix factorization [C]// SIGIR 2003: Proceedings of the, International ACM SIGIR Conference on Research and Development in Information Retrieval, July 28 - August 1, 2003, Toronto, Canada. 2003: 267-273. [10] Dong W., Moses C., Li K. Efficient k-nearest neighbor graph construction for generic similarity measures [C]// International Conference on World Wide Web, WWW 2011, Hyderabad, India, March 28 - April. 2011: 577-586.
[11] Malik J., Shi J. Normalized cuts and image segmentation [J]. IEEE Trans.pattern Anal.mach.intell, 2000, 22(8): 888-905.
[12] Hagen, L., Kahng: Newspectralmethodsforratiocutpartitioningandclustering. IEEE Trans.
[13] Comaniciu D., Meer P. Mean shift: a robust approach toward feature space analysis [J]. IEEE Transactions on Pattern Analysis & Machine Intelligence, 2002, 24(5): 603-619.
[14] Wu K.L., Yang M.S. Mean shift-based clustering [J]. Pattern Recognition, 2007, 40(11): 3035–3052.
[15] Nascimento M.C.V., André C.P.L.F. de Carvalho. Spectral methods for graph clustering – A survey [J]. European Journal of Operational Research, 2011, 211(2): 221-231.
[16] Wu Z., Leahy R. An optimal graph theoretic approach to data clustering: theory and its application to image segmentation [J]. IEEE Transactions on Pattern Analysis & Machine Intelligence, 1993, 15(11): 1101-1113.
[17] Sarkar S., Soundararajan P. Supervised Learning of Large Perceptual Organization: Graph Spectral Partitioning and Learning Automata [J]. IEEE Transactions on Pattern Analysis & Machine Intelligence, 2000, 22(5): 504-525.
[18] Ng A.Y., Jordan M.I., Weiss Y. On Spectral Clustering: Analysis and an algorithm [J]. Proceedings of Advances in Neural Information Processing Systems, 2002, 14: 849--856.
[19] Ding C.H.Q., He X. On the Equivalence of Nonnegative Matrix Factorization and Spectral Clustering. [C]// Siam International Conference on Data Mining. 2005.
[20] Kuang D., Ding C., Park H. Symmetric Nonnegative Matrix Factorization for Graph Clustering [C]// 2012.
[21] Luo D., Ding C., Huang H., et al. Non-negative Laplacian Embedding [C]// Ninth IEEE International Conference on Data Mining. IEEE Computer Society, 2009: 337-346.
[22] Miller F.P., Vandome A.F., Mcbrewster J. Matrix Congruence [M]. Alphascript Publishing, 2010.
[23] Xu W., Liu X., Gong Y. Document clustering based on non-negative matrix factorization [C]// SIGIR 2003: Proceedings of the, International ACM SIGIR Conference on Research and Development in Information Retrieval, July 28 - August 1, 2003, Toronto, Canada. 2003: 267-273. [24] Girvan M., Newman M.E. Community structure in social and biological networks [J]. Proceedings of the National Academy of Sciences of the United States of America, 2002, 99(12): 7821-7826.
[25] Gray D., Brennan S., Tao H. Evaluating appearance models for recognition, reacquisition, and tracking [J]. 2007.
[26] Malik J., Shi J. Normalized cuts and image segmentation [J]. IEEE Trans.pattern Anal.mach.intell, 2000, 22(8): 888-905.
[27] Bin, Cheng, Jianchao, Yang, Shuicheng, Yan, et al. Learning with l1-graph for image analysis. [J]. IEEE Transactions on Image Processing, 2010, 19(4): 858-66.
[28] Lu C.Y., Min H., Zhao Z.Q., et al. Robust and Efficient Subspace Segmentation via Least Squares Regression [C]// European Conference on Computer Vision. Springer-Verlag, 2014: 347-360.