BIROn - Birkbeck Institutional Research Online
Sammons, P. and Sylva, K. and Siraj-Blatchford, I. and Taggart, B. and
Smees, R. and Melhuish, Edward C. (2008) Exploring pupils’ views of
primary school in Year 5. Project Report. Institute of Education, London,
UK.
Downloaded from:
Usage Guidelines:
Please refer to usage guidelines at or alternatively
Effective Pre-school and Primary Education
3-11 Project (EPPE 3-11)
A longitudinal study funded by the DfES
(2003 – 2008)
Exploring pupils’ views of primary school in Year 5
Address for correspondence:
EPPSE 3-14 Room G2
Institute of Education Tel: +44 (0)20 7612 6219
University of London Fax: +44 (0)20 7612 6230 / 0207 580 7568 15 Woburn Square Email: Brenda Taggart ([email protected])
London WC1H ONS EPPE website: www.ioe.ac.uk/projects/eppe
T
HE
EPPE
3-11
R
ESEARCH
T
EAM
Principal Investigators
Professor Kathy Sylva
Department of Education, University of Oxford
00 44 (0)1865 274 008 / email [email protected]
Professor Edward Melhuish
Institute for the Study of Children, Families and Social Issues Birkbeck University of London
00 44 (0)207 079 0834 / email [email protected]
Professor Pam Sammons
School of Education, University of Nottingham
00 44 (0)115 951 4434 / email [email protected]
Professor Iram Siraj-Blatchford
Institute of Education, University of London00 44 (0)207 612 6218 / email [email protected]
*Brenda Taggart
Institute of Education, University of London
00 44 (0)207 612 6219 / email [email protected]
Research Officers
Dr Stephen Hunt
Institute of Education, University of London 00 44 (0)207 612 6608 / email [email protected]
Dr Helena Jelicic
Institute of Education, University of London 00 44 (0)207 612 6608 / email [email protected]
Rebecca Smees
Institute of Education, University of London
00 44 (0)207 612 6608 / email [email protected]
Wesley Welcomme
Institute of Education, University of London
00 44 (0)207 612 6684 / email [email protected]
A
UTHORS
Pam Sammons
Kathy Sylva
Iram Siraj-Blatchford
Brenda Taggart
Rebecca Smees
Edward Melhuish
Acknowledgement
The EPPE 3-11 project is a major longitudinal study funded by the DCSF. The research would not be possible without the support and co-operation of the six Local Authorities (LAs) and the many pre-school centres, primary schools, children and parents participating in the research. We are particularly grateful to Wesley Welcomme for his contribution in preparing this report.
The views expressed in this report are the authors’ and do not necessarily reflect those of the Department for Education and Skills
Contents
Page number
Executive summary i
Introduction 1
Aims 1
Methods 1
Structure of Paper and Analyses 2
Section 1: Characteristics of the Sample at the end of Year 5 4
Section 2: Analysis of Pupils’ views of primary school 7
Pupils’ views of primary school at the end of Year 5 7
Multilevel estimates 9
Section 3: Links between child, family and home learning environment (HLE) characteristics
and pupils’ views of primary school at the end of Year 5 11
Differences in pupils’ views of primary school for different groups of pupils 11
3.1 Child Measures 11
Gender 11
Ethnic Groups 12
Special Education Needs (SEN) 13
3.2 Family measures 14
Eligibility for free school meals (FSM) 14
Mother’s qualification level 14
Father’s qualification 14
3.3 Home Learning Environment (HLE) 15
Early years Home Learning Environment (HLE) 15
Key Stage 1 (KS1) Home Learning Environment (HLE) 15
3.4 An overview of the pupils’ views of their primary school 16
3.5 Relationship between other outcomes and pupils’ views of primary school 16
Section 4: Pupils’ views of the primary school at the end of Year 5: The Impact of Pre-school
and Primary School 17
Testing the impact of different aspects of pre-school within the contextualised model 17
Pre-school provision versus no pre-school provision 17
The impact of Pre-school centre quality (ECERS-E, ECERS-R & CIS) 17
The Impact of Pre-school Centre Effectiveness 18
The Impact of Primary School Effectiveness 18
Section 5: The influence of pupils’ self-perceptions in Year 2: ‘Enjoyment of school’,
‘Academic self-image’ and ‘Behavioural self-image’ 19
Section 6: Summary and conclusions 20
The impact of attainment and Special Educational Needs (SEN) 21
Educational influences 21
The impact of year 2 self-perceptions on pupils’ views of primary school in Year 5 22
Overview and discussion of Findings 22
Implications 23
References 24
Appendix 1: The exploratory and confirmatory factor analyses of the Year 5 pupil
questionnaire: development of the factors 27
Appendix 2: Responses from the ‘All About Me and My School’ pupil questionnaire in Year 5 29
Appendix 3 Results of contextualised multilevel analyses 30
i
Executive summary
Key findings on pupils’ views of primary school in Year 5 primary schools
A range of information about pupils’ self-perceptions and views of their primary school
were collected as part of the Effective Provision of Pre-school and Primary Education
(EPPE 3-11) Project. The EPPE 3-11 study is funded by the Department for Children,
Schools and Families (DCSF) and has followed children’s development from pre-school
through to the end of primary school and explored evidence of educational influences in
pre-school and primary school, as well as the impact of child, family and home learning
environment (HLE) characteristics as predictors of pupils’ outcomes (attainment,
social/behavioural development and self-perceptions). In Year 5 the ‘All About Me and My
School’ questionnaire included information about pupils’ views of their primary school. A
range of statistical methods has been used to investigate results for 2528 pupils for whom
at least one pupils’ views of primary school outcome measure was collected in Year 5.
Three measures of pupils’ views of primary school were identified from exploratory and
confirmatory factor analysis of the questionnaire data and these measures have been
further analysed in relation to a range of child, family and home learning environment
(HLE) characteristics to explore whether certain groups of pupils have different views and
experiences. In addition, analyses have been conducted to see whether pupils’ views of
primary school are associated with variation in pupils’ other outcomes in Year 5.
Pupils’ views of primary school in Year 5
The first factor ‘Teacher’s support for pupils’ learning’ reflected the praise, encouragement
and feedback a pupil felt they received from their class teacher. The second factor
‘Headteacher qualities’ reflected the degree to which pupil’s felt that their Headteacher
was interested in the pupils in the school, interested in how much they learnt and how
much they appeared to care about good behaviour. The third factor ‘Positive social
environment’ measures how Year 5 pupils perceived all pupils in the school to behave in
terms of a) friendliness, b) the level of bullying and c) how safe they felt in the class and at
break times.
ii
Table E.1 Responses from the ‘All about Me and My School’ pupil questionnaire in Year 5 All of the time % Most of the time % Some of the time % Never % ‘Teacher’s support for pupils’ learning’
I am told by my teacher I can do well If I do well get praised
If I don’t understand my work someone will explain it to me I am told how I am getting on with my work by my teacher I am helped to do my best
Cronbach’s Alpha 0.68
34 27 48 32 46 47 37 34 41 36 17 28 16 24 16 2 8 2 4 3 ‘Headteacher qualities’
The head is interested in the children The head makes sure children behave well
The head is really interested in how much we learn at school
Cronbach’s Alpha 0.68 54 85 52 31 12 41 11 2 7 3 1 1 Agree a lot
Agree Disagree Disagree a lot ‘Positive social environment’
The children in this school are really friendly
There is not much bullying or name calling at this school I feel safe at lesson times
I feel safe at school during break and lunch times
Cronbach’s Alpha 0.69 39 23 27 48 37 45 37 34 21 27 28 16 3 5 8 2
Another EPPE 3-11 paper has investigated pupils’ self-perceptions in Year 5 of primary
school in terms of their ‘Enjoyment of school’, ‘Anxiety and Isolation’, ‘Behavioural
self-image’ and ‘Academic self-self-image’ (Sammons et al., 2008a). In general, pupils with
positive self-perceptions also had positive views of primary school. ‘Enjoyment of school’
had the strongest correlation with all the factors related to the views of primary school
(generally r=0.3-0.4). This shows that pupils who enjoy school more are also likely to be
more positive about their primary school. ‘Anxiety and Isolation’ displayed the weakest
relationship with ‘Teacher’s support for pupils’ learning’ and ‘Headteacher qualities’
(r=0.1-0.2), but the strongest relationship with the factor ‘Positive social environment’ (r=0.42).
This indicates that pupils who feel more anxious and isolated also tend to view their
primary school less favourably than other pupils.
There was also evidence of significant school level variation in EPPE 3-11 pupils’ views of
their experiences of the primary school. The most variation between pupils from different
schools was found for their views about the factor
‘
Headteacher qualities’, and least
variation for their views on the ‘Positive social environment’
measure. This finding was
further substantiated using additional data collected for all children in Year 5 classes for
125 case study primary schools. Again the results indicate that there are significant
differences between schools in how Year 5 pupils perceive their primary school.
Key findings on home, pre-school and primary school influences on pupils’ views
of their primary school in Year 5
iii
Pupil background
Girls were more positive in their views of ‘Headteacher qualities’ (ES=0.13) and of
‘Positive social environment’ (ES=0.15) than boys. This maybe due to the lower incidence
of poorer behaviour in their immediate social groups, as girls have been shown to have
more positive behaviour than boys generally. This is in line with research elsewhere on
school and class climate (Yates, 2001; Quek, Wong & Fraser, 2002).
There were some small differences found between minority ethnic groups and White UK
pupils in how they viewed the learning environment. Pupils of Black Caribbean heritage
had more positive views about ‘Headteacher qualities’ and pupils of Mixed heritage had
less favourable views about the ‘Positive Social Environment’
in the school than those of
White UK heritage.
Children’s birth position was also a predictor of how positive they were. Children who
were fifth born had less positive views than first born children about
‘
Headteacher
qualities’ (ES=-0.50) and had less favourable views about the ‘Positive Social
Environment’ in the school (ES=-0.67). It should be noted that this group were small so
findings should be treated with caution.
Family background
In line with findings on pupils’ self-perceptions (Sammons et al., 2008a), pupils entitled to
Free School Meals (FSM, a measure of family poverty) were not only more positive about
their ‘Enjoyment of School’, but also had higher ratings for the ‘Teacher’s support for
pupils’ learning’ factor (ES=0.14). Children whose mothers had vocational qualifications
were more negative about the ‘Teacher’s support for pupils’ learning’, ‘Headteacher
qualities’ and ‘Positive Social Environment’ than children whose mothers had no
qualifications. However, children from families with higher salaries tended to have more
favourable views for ‘Positive Social Environment’
factor.
Home learning environment (HLE)
A positive association was found between a pupil’s Early years home learning
environment (HLE) and their view of the ‘Positive Social Environment’
in the school.
Pupils in the lowest Early years HLE group (collected at pre-school) had less positive
views of school in terms of the ‘Positive Social Environment’
factor than pupils in the
highest Early years HLE group (ES=-0.22).
iv
Table E.2 Significant measures for the contextualised analysis
Factor Effect size Description
‘Teacher’s support for pupils’ learning’:
Free school meals (FSM) (Year 5) 0.14 Pupils entitled to FSM were more positive than
those not entitled FSM
Mother’s qualification -0.18
Pupils with mothers who had Vocational qualifications were less positive than those with mothers who had no qualifications
KS1 Home learning: computers -0.16 Pupils with low computer use were significantly less positive than those with very high usage
‘Headteacher qualities’:
Gender 0.13 Girls were more positive than boys
Ethnicity 0.24 Black Caribbean pupils were more positive than
White UK pupils
Birth position -0.50 5th born children were less positive than 1st born
Mother’s qualifications -0.24/-0.17 Pupils with mothers who had Vocational and 16 Academic level qualifications were less positive than those whose mothers had no qualifications ‘Positive Social Environment’:
Gender 0.15 Girls were more positive than boys
Ethnicity -0.21 Pupils of Mixed heritage were less positive than White UK pupils
Birth position -0.67 5th born children were less positive than 1st born
Mother’s qualifications -0.22 Pupils with mothers who had Vocational level qualifications were less positive than those whose mothers had no qualifications
Father’s qualifications +0.31 Pupils with fathers who had Higher degree level qualifications were more positive than those whose fathers had no qualifications
Early years Home learning environment
(HLE) -0.22 Pupils with the lowest Early years HLE score were less positive than pupils with the highest score
Salary 0.17/ 0.18
/0.34
Pupils whose family’s salary was £17,500-29,999, £37,500-67,499, £67,500-132,000+ were more positive than pupils whose family had no salary
Relationships with academic attainment
Pupils who had a higher attainment in Reading and Mathematics were found to view the
‘Positive Social Environment’
of the school more favourably (ES=0.22 combined Reading
and Mathematics attainment) and ‘Headteacher qualities’ (Reading=0.18, Mathematics
ES=0.13).
Relationships with Special Educational Needs (SEN)
Pupils who have ever had a Special Educational Need (SEN) were more negative in their
ratings of ‘Positive Social Environment’
in the school. When we looked at current SEN,
pupils on the SEN Code of practice had more negative views of ‘Positive Social
Environment’, but this was not the case for the smaller sub-group of pupils who had a
statement of SEN. Pupils who had a statement of SEN were also found to have more
positive views of ‘Teacher’s support for pupils’ learning’
than other pupils not on the SEN
Code of practice; this could be because they are entitled to more teacher support.
Pre-school effects
v
(‘home’ children). However, pupils who attended poor quality pre-schools did not show
more favourable views.
There was a stronger pre-school effect for views of the ‘Positive Social Environment’ for
pupils attending more effective pre-schools, especially when related to social/behavioural
effectiveness. Compared to ‘home’ children, pupils who had attended highly effective
pre-schools (for social/behavioural outcomes) showed more favourable ratings for the factor
‘Positive Social Environment’ in Year 5.
Primary school effects
The academic effectiveness of the primary school attended was not found to relate to
pupils’ views of primary school in Year 5. This is in contrast to analyses of pupils’
attainment where positive effects were found. An analysis of pupils’ self-perceptions
reported in a separate paper found one significant relationship, however, children from
more academically effective primary schools were more likely to have higher ‘Behavioural
self-image’ (Sammons et al., 2008a).
The influence of Year 2 self-perceptions
Pupils’ prior self-perceptions in Year 2 influenced their present views of primary school,
but did not reduce the differences that were found between schools.
Implications
These results indicate that some distinct dimensions relating to pupils’ views of primary
school in Year 5 can be identified. These measures provide evidence about children’s
experiences of the wider school context. Most pupils are found to have positive views of
primary school (for example 82% of pupils felt they were helped to do their best all or most
of the time).
There are only modest associations between pupils’ views of primary school and their
attainment; this is in line with another EPPE 3-11 paper looking at pupils’ self-perceptions
(Sammons et al., 2008a). Where significant associations were found they were positive,
indicating that pupils with better academic outcomes tended to be more positive about
their Headteacher and social environment.
Child, family and home learning environment (HLE) influences were much weaker for
pupils’ views of primary school than for their academic and social/behavioural outcomes in
Year 5 as well as their self-perceptions (‘Enjoyment of school’, ‘Academic self-image’,
‘Anxiety and Isolation’, ‘Behavioural self-image’). Overall, girls were more favourable
about their Headteacher and social environment, but not significantly different to boys in
how they viewed the teachers’ support of their learning. Pupils entitled to free school
meals (FSM) were more favourable about the teacher’s support for their learning, in line
with the finding reported in a separate paper (Sammons et al., 2008a) that these pupils
enjoyed school more. Very low HLE during the early years predicted less favourable
views of ‘Positive social environment’
in primary school in Year 5. Pupils from families
with higher salaries tended to be more favourable about ‘Positive social environment’.
These differences in views of school may also be influenced by pupils’ peer groups.
vi
and high quality pre-schools were more positive. The effectiveness of the pre-school
attended (for social/behavioural outcomes) continues to show a significant influence on
later views of ‘Positive social environment’, with pupils who had attended effective
pre-schools (both for cognitive and social/behavioural outcomes) being more positive about
‘Positive social environment’ in Year 5.
1
Introduction
This report presents the results of further analyses from the longitudinal Effective Pre-school and Primary Education 3-11 (EPPE 3-11) project. The study is funded by the Department for Children, Schools and Families (DCSF). The focus of this report is pupils’ views of primary school in Year 5 (age 10). Findings on pupils’ cognitive and social/behavioural development at this age are reported separately (Sammons et al., 2007a; 2007b). Another EPPE 3-11 report describes findings about pupils’ self-perceptions in terms of ‘Enjoyment of school’, ‘Academic self-image’, ‘Behavioural self-image’ and ‘Anxiety and Isolation’ (Sammons et al., 2008a). The original EPPE pre-school sample was recruited to the study at age 3 years plus and monitored to the end of Key Stage 1 (Year 2) in primary school. An additional sample of ‘home’ children (who had not attended a pre-school setting) was recruited when the pre-school sample started primary school. The EPPE 3-11 extension is following up the sample to the end of primary school (age 11 years in Key Stage 2). This extension to the research is designed to explore the influence of primary school on pupils’ educational outcomes, as well as to investigate any continuing pre-school effects.
EPPE 3-11 involves the collection and analysis of a wide range of data about pupils’ development; child, family and home learning environment (HLE) characteristics and the characteristics of the pre-schools attended. Additional ‘value added’ measures of primary school academic effectiveness have been derived from independent statistical analyses of National assessment data conducted for all primary schools in England over three years and separate cohorts, 2002-2004 (Melhuish et al., 2006). These school effectiveness measures have been incorporated into the EPPE 3-11 database to provide indicators of the academic effectiveness of the primary school a pupil attends to complement the measures collected earlier on the pre-school setting attended. Thus it is possible to explore both pre-school and primary school influences on pupils’ outcomes in Year 5 both separately and jointly.
Survey questionnaires (All about Me in Year 5 and All about Me and My School) were designed to explore pupils’ perceptions and views about school and classroom life and these provide self-report measures of pupils’ views of primary school in Year 5. A range of statistical methods has been used to investigate results for 2528 pupils for whom at least one view of primary school outcome measure was collected in Year 5.
Aims
The aims of the analyses were:
• To explore the relationships between child, parent and home learning environment (HLE) characteristics on pupils’ views of primary school at the end of Year 5.
• To investigate any continuing impact of pre-school, including any variations in pupils’ outcomes for those who attended different types of pre-school (and those who received no pre-school provision i.e. the ‘home’ children).
• To explore relationships between measures of pre-school processes (measures of quality and effectiveness) on pupils’ views of primary school.
• To investigate the influence of primary school academic effectiveness on pupils’ views of primary school (controlling for child, family and HLE characteristics).
• To investigate the combined effect of pre-school experience and primary school experience on pupils’ views of primary school in Year 5.
Methods
2
impact of child background characteristics (including child, family, HLE) and the impact of both the pre-school and the primary school attended (Year 5) on pupils’ views of primary school.
The paper focuses on four measures of pupils’ views of primary school assessed using self-report questionnaires administered at the end of Year 5. Multilevel models provide estimates of the impact of different child or primary school characteristics on pupil outcomes and can be used to explore institutional influences by partitioning variance into individual and higher levels (e.g. pre-school centre or pre-school) reflecting clustering in the sample.
Background information about child, parent and family characteristics, was obtained initially through parent interviews conducted soon after children were recruited to the EPPE study. The parent interviews were designed to obtain information about a child’s health and care history, details of family structure and parents’ own educational and occupational backgrounds as well as some indications of parent-child activities and routines. In most cases the parent interviews were conducted within 10 weeks of recruiting a child to the study and an excellent response rate (97%) was achieved. It should be noted that most interviews were with children’s mothers.
Subsequently parents were again asked to give some further information (via a questionnaire) about child, parent and family characteristics when the children were in Key Stage 1 of primary school (age approximately 6 years). Details were sought regarding any change in background information (in employment, family structure, number of siblings etc) as well as information on aspects of the HLE in Key Stage 1. The response rate was slightly lower than in the pre-school period (80.6 %)1.
Structure of Paper and Analyses
This report is divided into six sections. The first section gives details about the characteristics of the EPPE 3-11 sample. The second section gives details about how the baseline and outcome measures were created using exploratory and confirmatory analysis of the pupil self-report questionnaire items. The third section investigates whether particular groups of pupils show differences in their views of the primary school at the end of Year 5. This section also explores the predictive power of different child, family and home learning environment (HLE) background characteristics in accounting for variation in these pupils’ views. Further analyses are used to identify the unique (net) contribution of particular characteristics to variation in pupils’ outcomes, while other influences are controlled. For example, the impact of family Socio-Economic Status (SES) is established while taking into account the influence of other characteristics such as mother’s qualification levels, low income, ethnic group, birth weight, HLE etc. Results are reported in terms of effect sizes (ES); a statistical measure of the relative strength of predictive power. It is of policy interest to establish the nature and strength of such background influences individually and in total, because they are relevant to issues of equity and social inclusion. For example, EPPE 3-11 was commissioned by the Equalities Review (EPPE 3-11 Team, 2007) to provide information on such influences to inform the Cabinet Office Equalities Review (The Equalities Review, 2007).
In Section 4 pre-school and primary school influences on pupils’ views of primary school are investigated. The analyses of cognitive and social/behavioural outcomes at age 10 show that pre-school experience still gives pupils a significant boost in terms of higher cognitive attainments and improved social/behavioural outcomes (Sammons et al., 2007a; 2007b). In addition to the effects of pre-school attendance, measures quality of pre-school provision (measured by the ECERS-E scale, Sylva et al., 2006; Sylva, Siraj-Blatchford & Taggart, 2006) and centre effectiveness (measured by value added residual estimates based on cognitive and social behavioural progress during the pre-school period) are tested to explore any continuing effect of pre-school on pupils’ views of primary school at the end of Year 5.
1 Between the initial assessment at entry to pre-school and the Reception assessment 139 children dropped
3
Further analyses sought to establish the impact of primary school academic effectiveness (based on school effectiveness have been calculated independently using National Assessment data for all primary schools in England linking KS1 and KS2 results, Melhuish et al., 2006) on pupils’ views of primary school in Year 5. Section 5 explores the influence of pupils’ earlier (Year 2) self-perceptions on pupils’ views of primary school at the end of Year 5.
4
Section 1: Characteristics of the Sample at the end of Year 5
The educational effectiveness research design used for the original EPPE study is described in EPPE Technical Paper 1 (Sylva et al., 1999). Further discussion of the mixed methods approach is given by Sammons et al., 2005 and Siraj-Blatchford et al., 2006. In summary, six English Local Authorities (LAs), in five regions, participated in the research with children recruited from six main types of provision: nursery classes, playgroups, private day nurseries, local authority day nurseries, nursery schools and integrated centres (that combined care and education). In all, there were 2,857 children from 141 pre-school centres in the pre-school sample. An additional sample of 315 ‘home’ children (who had not attended a pre-school setting) was added at entry to primary school, for comparison with those who had attended a pre-school sample, bringing the total sample to 3,172.
EPPE 3-11 children were asked their views about school life at two time points: Year 2 (age 7) and Year 5 (age 10). This section provides descriptive statistics for the sample at the end of Year 5 for whom information on views had been obtained at age 10. Tables 1.1a to 1.1b provide a brief summary of the characteristics of the EPPE 3-11 sample at the end of Year 5 for whom at least one factor score of pupils’ views of primary school (created from individual survey items) was available (n=2528).
In all twenty-five per cent of pupils in the sample were not of White UK heritage and nine per cent of the pupils had English as a n additional language (EAL). With respect to family structure, sixteen per cent of pupils lived in large families with 3 or more siblings.
5
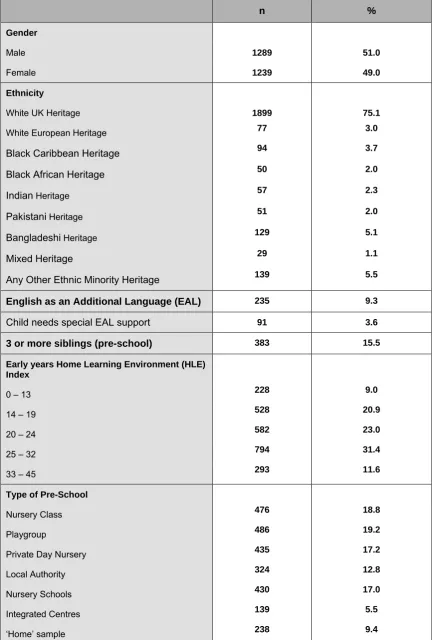
Table 1.1a: Selected characteristics of children who have valid data on the measure of their views of primary school at Year 5
Some figures do not include non-response to questions therefore the total is not always 2528 (100 %)
n %
Gender
Male 1289 51.0
Female 1239 49.0
Ethnicity
White UK Heritage 1899 75.1
White European Heritage 77 3.0
Black Caribbean Heritage 94 3.7
Black African Heritage 50 2.0
Indian Heritage 57 2.3
Pakistani Heritage 51 2.0
Bangladeshi Heritage 129 5.1
Mixed Heritage 29 1.1
Any Other Ethnic Minority Heritage 139 5.5
English as an Additional Language (EAL) 235 9.3
Child needs special EAL support 91 3.6
3 or more siblings (pre-school) 383 15.5
Early years Home Learning Environment (HLE) Index
0 – 13 228 9.0
14 – 19 528 20.9
20 – 24 582 23.0
25 – 32 794 31.4
33 – 45 293 11.6
Type of Pre-School
Nursery Class 476 18.8
Playgroup 486 19.2
Private Day Nursery 435 17.2
Local Authority 324 12.8
Nursery Schools 430 17.0
Integrated Centres 139 5.5
6
Table 1.1b shows that nearly a fifth (19.7%) of pupils were identified as eligible for free school meals (FSM), and approximately a third (21.3%) were growing up in families whose annual salary was reported to below (£17,500 or less) when they were in Key Stage 1 (age 6/7).
[image:18.595.59.494.209.582.2]An index of multiple disadvantage2 was created in the original EPPE research. Table 1.1b indicates that twenty-two per cent of the sample was recorded as low disadvantage on this whereas, thirteen per cent of the children were highly disadvantaged with a score of 4 or more factors identified as increasing the risk of low attainment.
Table 1.1b: Selected characteristics of children who have valid data on the measure of their views of primary school at Year 5
Some figures do not include non-response to questions therefore the total is not always 2528 (100 %)
n %
Income indicator:
Free School Meals (FSM)
(at Year 5 or earlier) 497 19.7
No Free school meals 2020 79.9
Salary of family during Key Stage 1
No salary 703 27.8
£2,500 – 17,499 538 21.3
£17,500 – 29,999 334 13.2
£30,000 – 37,499 220 8.7
£37,500 – 67,499 182 7.2
£67,500 – 132,000+ 151 6.0
Employment status of mother during pre-school period:
Not working 1208 47.8
Working part-time 753 29.8
Working full-time 390 15.4
Self-employed / Combination of part-time &
self-employed 115 4.5
Total Multiple Disadvantage Index
0 (low disadvantage) 554 21.9
1 652 25.8
2 506 20.0
3 290 11.5
4 185 7.3
5 plus (high disadvantage) 151 6.0
In general, only a small proportion of children had missing data (<5%) which is a result of the procedures for tracking children and good relations with primary schools as well as regular data quality checks of the EPPE 3-11 data-management team. Higher proportions of missing values occur for income-related variables like salary, socio-economic status or the eligibility of FSM, which is also an additional low income indicator, although the proportions remain small.
2 The index combines poor child, family and home learning environment (HLE) characteristics associated
7
Section 2: Analysis of Pupils’ views of primary school
Information about pupils’ views of their primary school was collected through a self-report questionnaire administered by class teachers in Year 5. The items were derived from a study of existing measures and adapted for use with this age group. Some questions were taken or adapted from The School Climate Assessment Instrument (Grosin & McNamara, 2001) and from Teddlie and Stringfield’s Louisiana ABC+ model (Teddlie et al., 1984; Teddlie and Stringfield, 1993, see Appendix 2).
Pupils’ views of primary school at the end of Year 5
Statistical analyses were used to explore the variation in pupils’ responses to the questionnaire items and to see whether robust measures of their views of primary school could be identified. The results revealed underlying dimensions (factors) that reflect patterns of associations amongst the questionnaire items. The responses of pupils for all the items in the survey are shown in Appendix 2. Three robust factors related to the views of primary school were revealed by the principle components analysis and confirmatory factor analysis (see Appendix 1 for details). The items are shown in Table 2.1 grouped by underlying factor, along with the percentage responses given by pupils to each item. As can be seen, pupils are generally positive about their primary school, with only a small minority giving very negative responses.
For the factor ‘Teachers’ support for pupils’ learning’, pupils gave relatively less positive responses when asked if they got praise when they do well, and being told how they were getting on (54% say they get praised all or most of the time when they do well, and 63% say they get told how they are getting on all or most of the time). The items linked to the factor ‘Headteacher qualities’ suggests that behaviour control was rated most strongly, more than interest in children and their learning (85% believe headteachers make sure children behave well all of the time compared to 52% believing the Headteacher is really interested in how much children learn), although pupils again were very positive for all areas. Pupil’s views of the ‘Positive social environment’ in the school were also generally positive, although twenty-four per cent of pupils didn’t think children were friendly, and thirty-two per cent expressed disagreement with the item ‘there is not much bullying or name calling, suggesting that bullying and name calling are experienced by a third of all pupils.
Table 2.1 Responses from the ‘All About Me and My School’ pupil questionnaire in Year 5 All of the time % Most of the time % Some of the time % Never % ‘Teachers’ support for pupils’ learning’
I am told by my teacher I can do well If I do well get praised
If I don’t understand my work someone will explain it to me I am told how I am getting on with my work by my teacher I am helped to do my best
Cronbach’s Alpha=0.68 34 27 48 32 46 47 37 34 41 36 17 28 16 24 16 2 8 2 4 3 ‘Headteacher qualities’
The head is interested in the children The head makes sure children behave well
The head is really interested in how much we learn at school Cronbach’s Alpha=0.68 54 85 52 31 12 41 11 2 7 3 1 1 Agree a
lot Agree Disagree
Disagree a lot ‘Positive social environment’
The children in this school are really friendly
There is not much bullying or name calling at this school I feel safe at lesson times
I feel safe at school during break and lunch times
8
[image:20.595.57.537.144.284.2]Three additional factors had too low Cronbach’s Alpha statistics: ‘Pupil’s external activities’ (Cronbach’s=0.55) and ‘Parental support’ (Cronbach’s=0.49), suggesting they were not robust conceptually, and therefore they were not included in any further analyses. The final factor related to ‘School Resources’ and had a strong Cronbach’s Alpha (0.74) and was created as an unweighted scale. The items and responses can be seen in Table 2.2.
Table 2.2 Responses from the ‘All about me at school’ pupil survey in Year 5 Agree a lot % Agree % Disagree % Disagree a lot % ‘School Resources’
Pupils have enough books,
The computers in school are good, The sports equipment are good, The toilets are well cared for, We have a good library,
The teachers in the school know their subjects well Cronbach’s Alpha=0.74 52 54 85 71 22 62 32 31 12 20 58 34 14 11 2 7 16 3 1 3 1 2 4 1
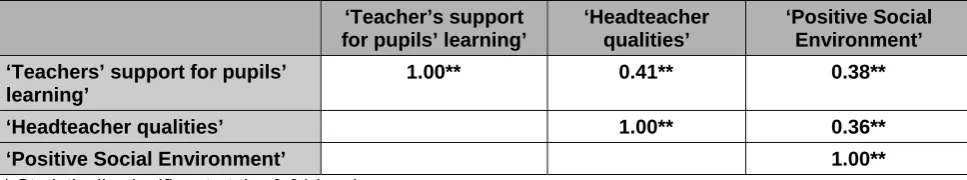
[image:20.595.60.544.393.483.2]Table 2.3 shows the correlations between the different factors of pupils’ views of primary school. All are highly statistically significant and the associations positive and moderate to moderately strong in size. The strongest association is between pupils’ views of ‘Teachers’ support for pupils’ learning’ and
‘
Headteacher qualities’ whilst the weakest correlation is between ‘Headteacher qualities’ and ‘Positive Social Environment’. These associations suggest that the different dimensions of school climate tend to be connected in pupils’ perceptions.Table 2.3 Correlations between the different factors of pupils’ views of primary school in Year 5 ‘Teacher’s support
for pupils’ learning’
‘Headteacher qualities’
‘Positive Social Environment’
‘Teachers’ support for pupils’ learning’
1.00** 0.41** 0.38**
‘Headteacher qualities’ 1.00** 0.36**
‘Positive Social Environment’ 1.00**
** Statistically significant at the 0.01 level
The association between the pupils’ self-perceptions (Sammons et al., 2008b) and their views of primary school was also tested. Self-reported ‘Enjoyment of school’ had the strongest correlation with all the views of primary school factors and ‘Anxiety and Isolation’ the weakest. This suggests that pupils’ views of their school and their level of ‘Enjoyment of school’ are connected, enjoyment being greater where views of primary school were rated more favourably. Similarly there is a positive association between pupils’ ‘Enjoyment of school’ and the level of ‘School Resources’. There was a moderately strong relationship between low ratings for ‘Anxiety and Isolation’ and more favourable views of the ‘Positive Social Environment’.
Table 2.4 Correlation between Year 5 factors of pupils’ self-perceptions and their views of primary school ‘Enjoyment of school’ ‘Anxiety & Isolation’ ‘Academic self-image’ ‘Behavioural self-image’ ‘Teachers’ support for pupils’ learning’ .40** .16** .34** .22** ‘Headteacher qualities’ .34** .13** .19** .26** ‘Positive Social Environment’ .34** .42** .23** .28**
‘School Resources’ .41** .20** .20** .25**
** p<0.01
9
[image:21.595.62.528.164.277.2]attainments were identified. This was not the case for their views of primary school, where few if any significant correlations were found (see Table 2.5). Pupils who had a more favourable view of the ‘Positive Social Environment’also tended to have better Reading and Mathematics attainment, although the correlations are weak. In addition, pupils were more likely to give positive ratings of their own behaviour if they attended an academically more effective primary school (Sammons et al, 2008a).
Table 2.5 Correlations between pupils’ views of primary school and attainment in Year 5
School factors Year 5 Reading score Year 5 Mathematics score
‘Teacher’s support for pupils’ learning’ ns ns
‘Headteacher qualities’ ns ns
‘Positive Social Environment’ 0.13** .14*
Other factors
‘School Resources’ ns ns
* Statistically significant at the 0.05 level ** Statistically significant at the 0.01 level
Multilevel estimates
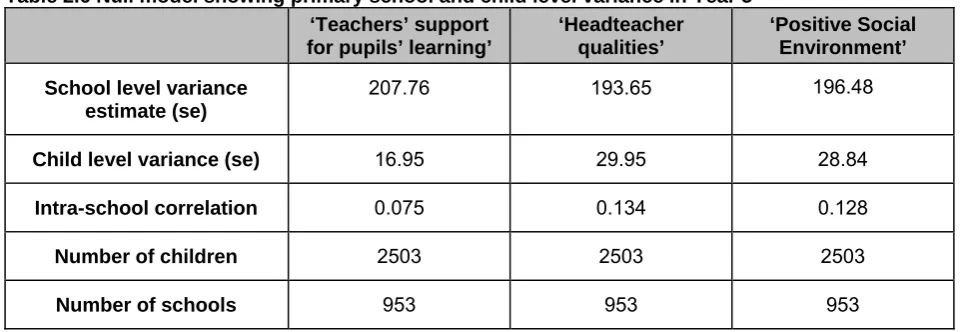
Multilevel models were used to explore possible variations between schools in pupils’ views of primary school. Table 2.6 shows the null models with no explanatory variables included for the three outcomes. The intra-school correlation measures the extent to which the scores of EPPE 11 pupils in the same primary school resemble each other as compared with those from EPPE 3-11 pupils at different schools. The intra-school correlations for ‘Headteacher qualities’ and ‘Positive social environment’ are the highest at approximately thirteen per cent. The factor ‘Teachers’ support for pupils’ learning’ has a relatively smaller intra-school correlation at approximately eight per cent. This suggests that there are moderately strong differences between schools in these measures of school climate.
Table 2.6 Null model showing primary school and child level variance in Year 5 ‘Teachers’ support
for pupils’ learning’
‘Headteacher qualities’
‘Positive Social Environment’
School level variance estimate (se)
207.76 193.65 196.48
Child level variance (se) 16.95 29.95 28.84
Intra-school correlation 0.075 0.134 0.128
Number of children 2503 2503 2503
Number of schools 953 953 953
[image:21.595.55.538.458.624.2]10
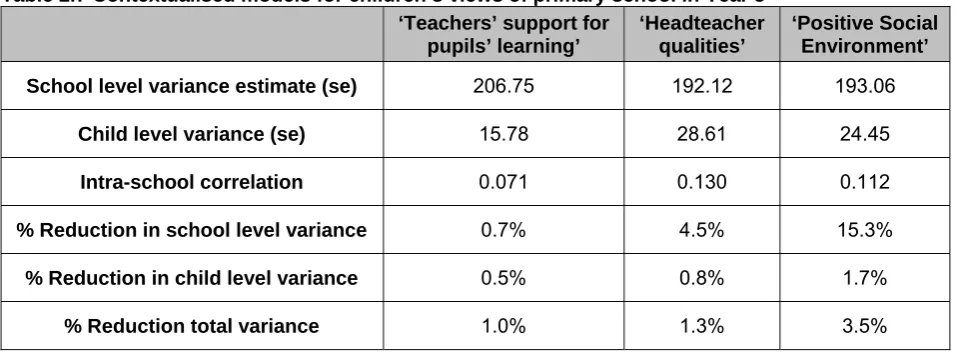
Table 2.7 Contextualised models for children’s views of primary school in Year 5 ‘Teachers’ support for
pupils’ learning’
‘Headteacher qualities’
‘Positive Social Environment’
School level variance estimate (se) 206.75 192.12 193.06
Child level variance (se) 15.78 28.61 24.45
Intra-school correlation 0.071 0.130 0.112
% Reduction in school level variance 0.7% 4.5% 15.3%
% Reduction in child level variance 0.5% 0.8% 1.7%
% Reduction total variance 1.0% 1.3% 3.5%
The intra-school correlations for ‘Headteacher qualities’ and ‘Positive Social Environment’ are somewhat higher than for ‘Teacher’s support for pupils’ learning’ after control for background factors, suggesting that these are aspects that may be more susceptible to school influences when account is taken of the influence of pupils’ background characteristics. However, the intra-school correlations for these models must be treated with caution as many of the primary schools just have one or two EPPE 3-11 pupils attending. An additional data collection of 125 case study schools provided questionnaire data for a whole class of non-EPPE peers per school and was analysed to see if similar intra-school correlations were found on a sample where the number of pupils per school was larger (mean=21.9). Multilevel models for the null model on the non-EPPE sample found similar intra-school correlations of 0.072 for ‘Teacher’s support for pupils’ learning’ and ‘‘Positive Social Environment’ (0.162) and a slightly larger intra-school correlation for
‘Headteacher qualities’ (0.190). This provides strong support for the conclusion that pupils from different schools or classes vary significantly in their views of the school, especially related to their perceptions of ‘Headteacher qualities’ and the ‘Positive Social Environment’. The existence of significant class/school level variation suggests that pupils’ perceptions share common elements and are not just unique to the child.
11
Section 3: Links between child, family and home learning
environment (HLE) characteristics and pupils’ views of primary
school at the end of Year 5
This section presents the results of a contextualised multilevel analysis establishing the pattern of relationships between child, family and home learning environment (HLE) characteristics and pupils’ views of primary school experiences at the end of year 5. The three Year 5 outcomes discussed in Section 2 are employed as outcomes. Background details about pupils’ earlier child care experiences, health, family and home learning environment (HLE) were obtained from parental interviews conducted when children entered the EPPE study as well as selected details from other time points.
Differences in pupils’ views of primary school for different groups of pupils
The contextualised models indicate that, for all three outcomes, a number of child, family and home learning environment (HLE) characteristics show statistically significant relationships with pupils’ views of their primary school at the end of Year 5. Net effect sizes (ES) for the single factors are given. An effect size is a statistical measure representing predictive power. An ES of 0.2 can be seen as representing a moderate influence while a relatively strong influence would be an ES of 0.5 plus.
Differences in raw scores are examined alongside differences in ‘net’ impact (effect sizes), showing the unique contribution of a given predictor to a pupil’s outcome once all other predictors are taken into account. The net effects of particular child, family and home learning environment (HLE) characteristics reported in this section were derived by contextualised multilevel analyses and therefore take into account any clustering related to the primary school attended. Due to the inter-relationship between the predictors some raw differences between sub-groups of pupils disappear and some become accentuated once the influences of other factors are partialled out. Presenting raw and net differences side by side helps to show how demographic factors taken together affect the relative strength of estimates of the unique influence of particular factors. The following measures were used in the analyses:
• Child characteristics (e.g. gender, birth weight, ethnicity, mother tongue,)
• Family characteristics (e.g. eligibility for free school meals [FSM], socio-economic status [SES], parent’s qualification, family earned income),
• Home Learning Environment (HLE) in the early years (how often parents read to the child, teach the child the alphabet, play with letters and numbers, teach songs and nursery rhymes, paint and draw etc.),
• Parental activities during Key Stage 1 (KS1) such as the frequency of reading to the child, taking the child out on educational visits, computing activities, play, etc.
3.1 Child Measures
Gender
12
Table 3.1 Gender differences in views of primary school at the end of Yr 5*
Male Female Total
‘Teachers’ support for pupils’ learning’ Mean 99.7 100.3 100.00
S.d. 15.5 14.5 15.00
Net Effects ns ns
‘Headteacher qualities’ Mean 99.0 101.0 100.00
S.d. 15.7 14.2 15.00
Net Effects 0.13 0
‘Positive Social Environment’ Mean 99.0 101.0 100.00
S.d. 15.4 14.5 15.00
Net Effects 0.15 0
Total N 1289 1239 2528
* ‘Female’ as the comparison category
Ethnic Groups
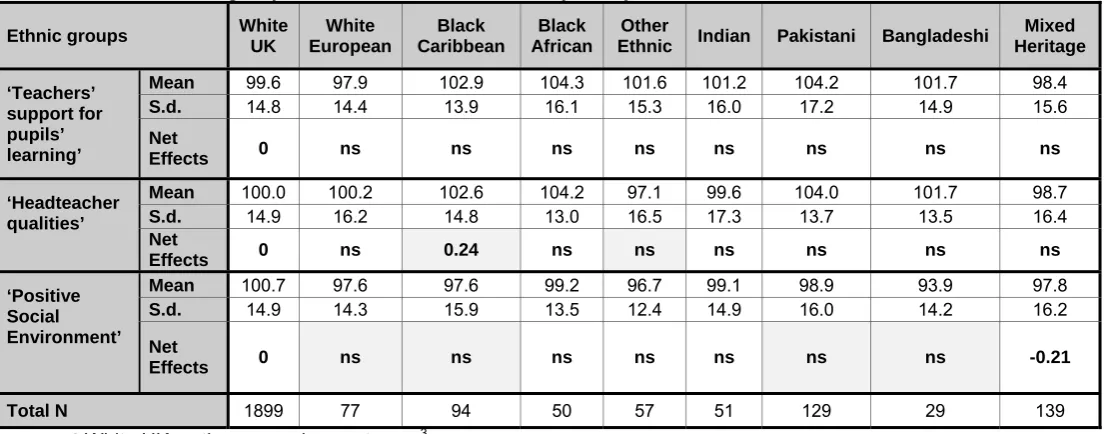
Some significant but statistically small differences in average scores occur for some ethnic groups. For perceptions of the learning environment, Black Caribbean pupils gave more positive reports of ‘Headteacher qualities’. Pupils of Mixed heritage also showed less positive perceptions of ‘Positive Social Environment’. It should be noted the differences should be interpreted with caution due to the small numbers of some ethnic minorities in the research.
Table 3.2 Ethnic groups and differences in views of primary school at the end of Yr 5*
Ethnic groups White
UK
White European
Black Caribbean
Black African
Other
Ethnic Indian Pakistani Bangladeshi
Mixed Heritage
‘Teachers’ support for pupils’ learning’
Mean 99.6 97.9 102.9 104.3 101.6 101.2 104.2 101.7 98.4
S.d. 14.8 14.4 13.9 16.1 15.3 16.0 17.2 14.9 15.6
Net
Effects 0 ns ns ns ns ns ns ns ns
‘Headteacher qualities’
Mean 100.0 100.2 102.6 104.2 97.1 99.6 104.0 101.7 98.7
S.d. 14.9 16.2 14.8 13.0 16.5 17.3 13.7 13.5 16.4
Net
Effects 0 ns 0.24 ns ns ns ns ns ns
‘Positive Social Environment’
Mean 100.7 97.6 97.6 99.2 96.7 99.1 98.9 93.9 97.8
S.d. 14.9 14.3 15.9 13.5 12.4 14.9 16.0 14.2 16.2
Net
Effects 0 ns ns ns ns ns ns ns -0.21
Total N 1899 77 94 50 57 51 129 29 139
* White UK as the comparison category3
3 Any category of a predictor variable can be used as a reference group. The overall calculations (e.g.
13
Special Education Needs (SEN)
EPPE 3-11 collected details for each pupil in the sample on whether their class teacher reported that they had been identified as having any form of special educational need (SEN) at any time and their special needs status at the end of Year 5. Pupils who had a statement of SEN had significantly more positive views of ‘Teachers’ support for pupils’ learning’ than other groups (ES=0.39). By contrast the larger group of pupils who have had a SEN at any point had significantly more negative views of the social environment in the school (see table 3.4). When we look at SEN stage in Year 5, pupils with School Action and School Action Plus had significantly more negative views about the ‘Positive Social Environment’, however this was not the case for pupils who had a statement of SEN.
Table 3.3 SEN and views of primary school at the end of Yr 5*
SEN Unknown School
Action
School Action Plus
Statement of SEN
Not on
COP Total
‘Teacher’s support for pupils’ learning’
Mean 100.3 100.2 101.3 105.3 99.7 100.0
S.d. 15.6 15.8 15.0 15.5 14.8 15.0
Net Effects ns ns ns 0.39 0
‘Headteacher qualities’
Mean 99.8 99.0 99.8 98.7 100.2 100.0
S.d. 15.4 16.7 16.2 16.7 14.5 15.0
Net Effects ns ns ns ns ns
‘Positive Social
Environment’
Mean 99.8 97.2 96.3 99.7 100.8 100.0
S.d. 15.5 16.0 15.3 18.4 14.5 15.0
Net Effects ns -0.18 -0.27 ns ns
Total N 152 312 133 66 1865 2528
* ‘Not on SEN register as the comparison category
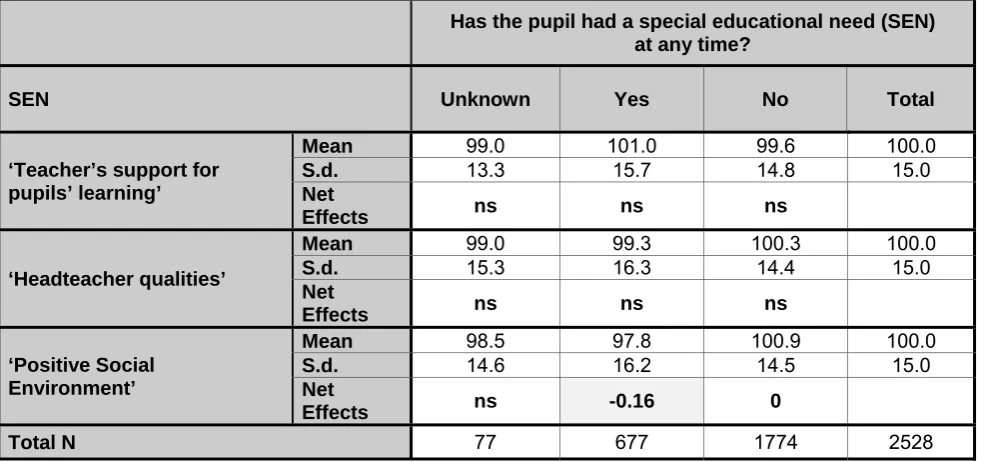
[image:25.595.54.547.526.757.2]Children identified by primary school records as having at least one special educational need in Year 5 or earlier in primary school were significantly more negative about their social environment in schoolalthough the ES is relatively weak (ES-0.16).
Table 3.4SEN and differences in views of primary school at the end of Year 5*
Has the pupil had a special educational need (SEN) at any time?
SEN Unknown Yes No Total
‘Teacher’s support for pupils’ learning’
Mean 99.0 101.0 99.6 100.0
S.d. 13.3 15.7 14.8 15.0
Net
Effects ns ns ns
‘Headteacher qualities’
Mean 99.0 99.3 100.3 100.0
S.d. 15.3 16.3 14.4 15.0
Net
Effects ns ns ns
‘Positive Social Environment’
Mean 98.5 97.8 100.9 100.0
S.d. 14.6 16.2 14.5 15.0
Net
Effects ns -0.16 0
Total N 77 677 1774 2528
14
3.2 Family measures
Eligibility for free school meals (FSM)
A pupil’s eligibility for free school meals (FSM) provides an indicator of low family income (although it is recognised that not all children take up their entitlement). Pupils who receive free school meals have were more positive about their teachers’ support for their learning although differences are small (ES=0.14).
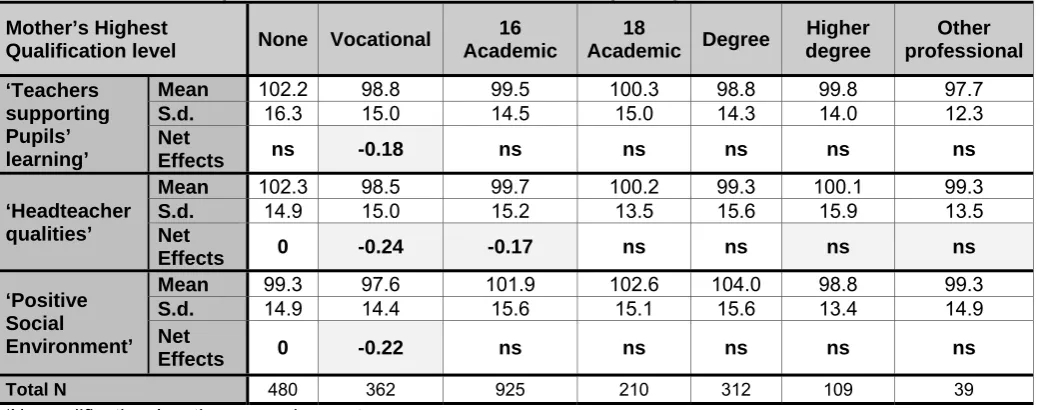
Mother’s qualification level
[image:26.595.40.561.252.457.2]There were no clear trends related to mother’s qualifications. Pupils whose mother’s who had vocational qualifications had more negative views for all factors than pupils whose mother’s had no qualifications and pupils whose mothers had 16 year academic qualifications were also less positive.
Table 3.5 Mother’s qualifications and differences in views of primary school at the end of Year 5*
Mother’s Highest
Qualification level None Vocational
16 Academic 18 Academic Degree Higher degree Other professional ‘Teachers supporting Pupils’ learning’
Mean 102.2 98.8 99.5 100.3 98.8 99.8 97.7
S.d. 16.3 15.0 14.5 15.0 14.3 14.0 12.3
Net
Effects ns -0.18 ns ns ns ns ns
‘Headteacher qualities’
Mean 102.3 98.5 99.7 100.2 99.3 100.1 99.3 S.d. 14.9 15.0 15.2 13.5 15.6 15.9 13.5 Net
Effects 0 -0.24 -0.17 ns ns ns ns
‘Positive Social
Environment’
Mean 99.3 97.6 101.9 102.6 104.0 98.8 99.3
S.d. 14.9 14.4 15.6 15.1 15.6 13.4 14.9
Net
Effects 0 -0.22 ns ns ns ns ns
Total N 480 362 925 210 312 109 39
* ‘No qualifications’ as the comparison category
Father’s qualification
Children whose fathers had a higher degree were more positive about ‘Positive social environment’than pupils whose fathers had no qualifications.
Table 3.6 Father’s qualifications and differences in views of primary school at the end of Year 5*
Father’s Highest
Qualification level None Vocational
16 Academic
18
Academic Degree
Higher degree Other professional Father absent ‘Teachers supporting Pupils’ learning’
Mean 100.5 98.1 99.4 100.5 99.1 100.4 94.8 101.3
S.d. 15.7 15.2 14.9 14.1 14.0 14.0 17.4 15.1
Net
Effects ns ns ns ns ns ns ns ns
‘Headteacher qualities’
Mean 99.6 98.4 100.2 100.5 99.8 99.3 98.3 101.3
S.d. 15.5 15.3 14.7 14.7 13.8 15.6 15.4 15.1
Net
Effects ns ns ns ns ns ns ns ns
‘‘Positive Social
Environment’
Mean 98.6 97.7 100.2 101.4 102.5 105.6 97.8 98.6
S.d. 14.7 14.7 15.0 12.9 14.8 15.9 15.9 14.7
Net
Effects ns ns ns ns ns 0.31 ns ns
Total N 391 288 556 187 315 130 23 571
[image:26.595.36.565.538.737.2]15
3.3 Home Learning Environment (HLE)
Early years Home Learning Environment (HLE)
A number of measures provide an indication of aspects of the Early years home learning environment (HLE). These are based on the frequency of specific activities involving the child, as reported by parents when children were recruited to the study (i.e. teaching the child the alphabet, teaching/playing with letters and numbers, library visits, reading to the child, teaching the child songs or nursery rhymes). These measures were combined to create an overall Early years HLE index with scores between 0 (Low Early years HLE) to 45 (High Early years HLE, see Melhuish et al., 2008).
Table 3.7 Early years HLE and differences in views of primary school at the end of Yr 5*
Early years Home Learning
Environment (HLE) 0-13 14-19 20-24 25-32 33-45 Unknown
‘Teachers supporting Pupils’ learning’
Mean 102.0 101.2 99.4 98.8 100.3 100.8 S.d. 15.6 15.6 15.4 14.4 13.3 16.9
ns ns ns ns ns ns
‘Headteacher qualities’
Mean 100.8 100.8 99.4 99.3 100.6 100.8 S.d. 14.6 15.2 15.4 14.9 14.0 16.1
ns ns ns ns ns ns
‘Positive Social Environment’
Mean 96.9 99.4 99.0 101.3 102.3 99.0 S.d. 15.3 15.1 15.0 14.3 16.0 14.9 Net
Effects -0.22 ns ns ns 0 ns
Total N 228 528 582 794 293 103
*High Early years HLE score (0-13) as comparison group
When the Early years HLE index was tested, only the lowest level of HLE (0-13) remains a predictor with a rather weak to modest effect (ES=-0.22) for ‘Positive Social Environment’ but not for the other outcomes. These findings are in contrast to those for pupils’ academic and social/behavioural outcomes and ‘Academic self-image’, which indicate significant Early years HLE influences even at age 10 years.
Key Stage 1 (KS1) Home Learning Environment (HLE)
Parents were again surveyed about their interactions at home with their EPPE 3-11 child via a parent questionnaire during KS1. They reported on activities such as the frequency of reading to the child, taking the child out on educational visits, computing activities, sport activities, dance, etc.
The individual measures have been aggregated to form four factors representing different activities during Key Stage 1 (KS1): ‘Home computing’, ‘One-to-one interaction’, ‘Enrichment outings’ and ‘Expressive Play’ (see Sammons et al., 2007a; 2007b). These factors were tested with respect to their influence on views of their primary school at the end of Year 5 (age 10)4. Only the amount of computer use in KS1 was a significant predictor of pupils’ views of ‘Teachers’ support for pupils’
4 KS1 HLE factors were not aggregated into a single HLE Index as was done with the Early years HLE since
16
learning, pupils with low computer use were significantly less positive in their views of this factor than pupils with very high usage (ES=0.16).
3.4 An overview of the pupils’ views of their primary school
[image:28.595.55.560.204.601.2]For all three outcomes, a number of child, family and home learning environment (HLE) characteristics show statistically significant but generally rather weak relationships with pupils’ views of primary school at the end of Year 5. The net influence of different child, family and HLE characteristics is illustrated in Table 3.8. An effect size is a statistical measure representing the strength of the single effect. An ES of 0.2 can be seen as representing a weak I influence while a relatively strong influence would be an ES of 0.5 plus.
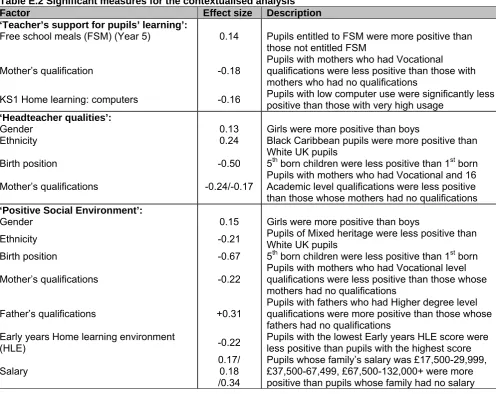
Table 3.8 Significant measures for the contextualised analysis
Factor Effect size Description
‘Teacher’s support for pupils’ learning’:
Free school meals (FSM) (Year 5) 0.14 Pupils entitled to FSM were more positive than
those not entitled FSM
Mother’s qualification -0.18 Pupils with mothers who had Vocational qualifications were less positive than those with
mothers who had no qualifications
KS1 Home learning: computers -0.16 Pupils with low computer use were significantly less positive than those with very high usage
‘Headteacher qualities’:
Gender 0.13 Girls were more positive than boys
Ethnicity 0.24 Black Caribbean pupils were more positive than
White UK pupils
Birth position -0.50 5th born children were less positive than 1st born
Mother’s qualifications -0.24/-0.17 Pupils with mothers who had Vocational and 16 Academic level qualifications were less positive than those whose mothers had no qualifications ‘Positive Social Environment’:
Gender 0.15 Girls were more positive than boys
Ethnicity -0.21 Pupils of Mixed heritage were less positive than White UK pupils
Birth position -0.67 5th born children were less positive than 1st born
Mother’s qualifications -0.22 Pupils with mothers who had Vocational level qualifications were less positive than those whose mothers had no qualifications
Father’s qualifications +0.31 Pupils with fathers who had Higher degree level qualifications were more positive than those whose fathers had no qualifications
Early years Home learning environment
(HLE) -0.22
Pupils with the lowest Early years HLE score were less positive than pupils with the highest score
Salary 0.17/ 0.18
/0.34
Pupils whose family’s salary was £17,500-29,999, £37,500-67,499, £67,500-132,000+ were more positive than pupils whose family had no salary
3.5 Relationship between other outcomes and pupils’ views of primary school
17
Section 4: Pupils’ views of the primary school at the end of
Year 5: The Impact of Pre-school and Primary School
One important aim of the EPPE3-11 research is to explore continuing pre-school influences on pupils as they move through primary school. In this section analyses test whether any features of the pre-school setting a child attended continued to be associated with pupils’ later views of the class and school environment at the end of Year 5. In addition, whether children who had not attended pre-school (‘home’ children) had significantly different views of school at the end of Year 5 in comparison to those who had attended pre-school.
For each of the three outcomes, the possible influence of a number of measures related to pre-school experience were tested.
Testing the impact of different aspects of pre-school within the contextualised
model
The contextualised models described in Section 3, took account of the impact of child, family and home learning environment (HLE) characteristics. By testing for the impact of the pre-school after these characteristics had been taken into account, differences in intake to different pre-school settings could be separated from the pre-school effects.
Pre-school provision versus no pre-school provision
Children who had attended pre-school had a more positive view of the primary school ‘Positive Social Environment’ in Year 5 than pupils who did not attend pre-school (ES=0.18). Pupils attending 7 or more sessions of pre-school a week also had more favourable views of ‘Teachers’ support for pupils’ learning’ (ES=0.27) and the ‘Positive Social Environment’ (ES=0.25) than ‘home’ children (children attending 1-3 sessions a week also had more favourable views of ‘Positive Social Environment’ than ‘home’ children).
The impact of Pre-school centre quality (ECERS-E, ECERS-R & CIS)
The quality of pre-school was originally assessed through observations of the setting using the ECERS-R ECERS-E, and CIS instruments. The ECERS-R (Harms et al., 1998) looked at many of the process and structural aspects of the Pre-school setting such as ‘Space and furnishings’ and ‘Activities’5. ECERS-E supplemented these areas to cover Literacy, Mathematics, Science and
environment and Diversity (Sylva et al., 2006; Sylva, Siraj-Blatchford & Taggart, 2006). The CIS instrument observed the interaction between children and staff in more detail (Arnett, 1989)6.
When pre-school quality (ECERS-E) was tested as a continuous variable (‘home’ children omitted), no significant effects were found for any outcome. When split into low, medium and high quality (compared to ‘home’ children), significant effects were found for ‘Positive Social Environment’ (children who had attended medium quality pre-school showed significantly better views of the ‘Positive Social Environment’, ES=0.20, and high quality was nearly significant and positive, p=0.068, ES=0.18). This is in line with findings for various outcomes; children who attended low quality pre-school fair little better than ‘home’ children, but those who went to medium or high quality pre-school tend to have better outcomes in several areas.
Pre-school Centre Quality was also collected in terms of the ECERS-R. When tested as a continuous variable, no significant effects were found for any outcome. When split into low, medium and high quality (compared to ‘home’ children), significant effects were found for ‘Positive
5 ECERS-R collected information on the following areas: Space and furnishings, Language reasoning,
Personal care routines, Activities, Interaction, Programme structure, Parents and staff.
6 The CIS observation looked at the following areas: Detachment, Positive relationships, Permissiveness,