1655
CORRELATES OF SUCCESS IN JAVA PROGRAMMING:
PREDICTING THE PERFORMANCE OF STUDENTS IN A
JAVA COURSE FROM THE RESULTS OF LOWER LEVEL
COURSES
1BASHIR S GALADANCI, 2MARYAM I MUKHTAR, 3SANAH A MUAZ
1, 2, 3 Department of Software Engineering, Bayero University Kano, Nigeria
E-mail: 1[email protected], 2[email protected] 3 [email protected].
ABSTRACT
Over the years, a number of factors that could determine success in programming have been investigated; yet computer programming is still challenging to most students. This paper is aimed at determining the relationship among students’ results of a third year Java Workshop Course with those of lower level courses taken in year one and year two and then developing predictive models based on this relationship. The examination results in 20 courses for a total of 109 students of Bayero University Kano that enrolled for BSc Computer Science course in the 2012/2013 session are analyzed using correlation and linear regression. The correlation results revealed that out of the 20 selected courses, the strongest correlation occurs in the course ((CSC2251: Analysis of Algorithms) (r= 0.756), p<0.001). Some programming courses, Computer Science theory courses (CSC) and Mathematics courses were also found to have strong correlations with the Java performance. The regression results revealed that a regression module, based upon the linear combination of (CSC 2203(VB), CSC2212 (C++), (CSC2251 (Analysis of Algorithms), CSC2202 (Data Structures) and CSC 1303(Introduction to Computer Science)) which is statistically significant at, F_ (5, 103) = 47.09, p = .000 accounts for 70% variance in the Java Programming results.
Keywords: Predicting Performance, Java Programming, Correlation, Regression, Students
1. INTRODUCTION
Predicting the future academic performance of students is very vital for higher institutions as it gives room for admitting the right types of students and identifying, after their entry, those that are likely to finish their programs with flying colors and those that need to put more efforts. As explained in [1] and [2], such academic performance prediction is useful because admitting non eligible students into a program constitutes a major misuse of resources, while failure to enroll eligible students weakens a discipline in the long run. For courses such as Computer Science, where special skill sets such as those for programming are required, it is useful to ensure that students admitted would likely do well. One would expect that admission criteria being used at entry points to admit students into a particular program are sufficient enough for them to perform well but a study carried out by [3] revealed that irrespective of the level at which students are introduced to computer programming, it still becomes a problem for learners. In fact learning to
program poses a significant problem for students up to their third level in the program [4].
1656 courses that would normally be thought as not significant predictors to be related to programming success. For example [1] and [12] found a non-programming CSC course as the most significant predictor of success in Java, [11] found Islamic studies and accounting courses to be significant predictors of programming courses, and [9] found English to be a significant factor for predicting programming courses.
With these diverse findings, there is no clear answer as to whether a course will be a significant predictor of success in Java or not; neither are there explanations for these diversities. Besides, conclusions or comparisons based on previous findings are challenging as these studies are generally conducted with different parameters [4] and datasets.
Our main contribution in this paper is to develop a predictive model for a third year Java Workshop course and to determine the relationship between the course and other programming and non-programming courses taken at lower levels. As explained in [11] accurate prediction of student performance is generally possible without consideration to socio-economic or demographic factors.
2. LITERATURE REVIEW
The correlation between the results of students of Computer Science in programming and non-programming courses has been an area of interest for researchers since the advent of programming as an academic discipline. Wilson and Shrock [5] inspected 12 factors such as gender, programming and non-programming experience, Mathematics, comfort level and games playing. They concluded that comfort level, Mathematics background and formal classes in programming were positive predictive factors of success while game playing and luck were negative predictors. On their part, Byrne and Lyons[10] investigated the effects of academic performance, gender, learning style and previous computing experience on the success of a first year programming course but their results showed that there was no significant difference in performance between males and females in the programming course and that those with converger learning styles were the best overall students. [13] examined the performance of students in an introductory Physics course and found out that the Genetic Algorithm improves the accuracy of the combined classifier performance more than non-Genetic Algorithm
1657 investigated the academic performance of students in an Engineering Dynamics course using four mathematical models namely the multiple linear regression model, the multilayer perception network model, the radial basis function network model and the support vector machine model. Cumulative GPA, Physics, Calculus II, Calculus I, Statistics and scores on mid-term exams were used as predictor variables in their study. Their findings revealed that class academic performance average was better predicted using the multiple linear regression model, with the cumulative GPA of students as a predictor variable while for predicting the individual academic performance of students, the support vector machine model with Cumulative GPA, Physics, Statistics, Calculus II, and Calculus I, as the inputs gave more accurate predictions. [19] predicted students' final performance in a Massive Open Online Course (MOOC) using the performance of students in the Week 1 assignment and social interaction in the course. Logistic regression was used to predict the probability of earning MOOC completion certificate by students and the probable certificate type. Their findings revealed that the Week 1 assignment was a strong predictor for achieving distinction and that average quiz scores strongly predicted whether students got normal certificate or not. [20] predicted students’ performance in using an Artificial Neural Network (ANN) with the Cuckoo Optimization Algorithm (COA) and Cuckoo Search (CS). Factors such as gender, university entrance exams, graduation exams in high school and high school location were used as their input variables. Their findings revealed that ANN-COA had slightly better results when predicting academic performance of students than ANN-CS. So also exams, high school location and gender was found to predict student academic performance. [21] investigated the academic performance of medical students in Australia and, using linear regression models, socioeconomics factors, background, gender, age, entry scores and rural entry status were used as predictor variables. Their findings revealed that background, rural entry status, gender and age were related to GPA, Graduate Australian Medical School Admissions Test scores (GAMSAT) and interview scores. So also entry GPA and GAMSAT scores were found to be able to predict results early in the entry stages of the medical program and throughout the program. [22] investigated the effects of a mixed learning approach on performance of students in a
1658 linear regression model, an analysis of 81 variables was made and their findings revealed that performance in the undergraduate-level explained 54% of the variance in graduate-level performance. So also, it was found that the most significant variable in performance prediction was the third-year GPA. [27] predicted the performance of students in computing courses using programming behavior. The Normalized Programming State Model (NPSM) was used their research. Their findings revealed that the NSPM accounted for 41% variance in programming assignments given to students and 36% variance in students' final grades. Qian and Lehman [9] found out that Mathematics ability was strongly correlated with programming performance among middle school students and the best predictor of success in introductory programming was students' English ability. [28] predicted the academic performance of students using socio-demographic characteristics and type of school. Their data was collected from a British university and the relationships between school type, school performance, school grades, academic achievements, socio-economic deprivation, neighborhood participation and sex was examined. Their findings revealed that students with low entry grades were more likely to obtain higher degree classifications; students from good neighborhoods performed better than those from deprived areas; white students outperformed Asian students; and black and female students performed better than their male counterparts. [32] predicted the academic performance of 210 students in Pakistan and found out that courses that indicate high and low performance could be used to counsel low and good performing students. [33] developed a model for predicting secondary school students performance using K-Nearest Neighbors(KNN) and Naive Bayes. Their findings revealed that Naïve Bayes performs better than KNN as it has 93.6% prediction accuracy. [34] predicted the academic performance of students in a Calculus course using principal component regression and found out one-third of the semester has to be completed before the prediction can be made. [35] investigated the predictive power of secondary school exams and national exams on the performance of high school students. Their data is collected from high institutions located in Portugal. Their findings revealed that secondary school exams predict high school performance better than national exams. [36] predicted the early academic
performance of students in order to provide them with suitable assistance. In their research data was collected from students that register for a blended calculus course. Multiple linear regression combined with principal component analysis was then used to build predictive models for the final grade in the course. Their findings revealed that the model could obtain optimal predictions in the calculus final grades. [37] investigated the association between academic performance of students and their behavioral patterns. Data from 18,960 undergraduate students from University of Electronic Science and Technology of China (UESTC) was collected. The collected behavioral characteristics targeted were orderliness and diligence. Their findings revealed that there is a significant strong association between Grade Point Average (GPA) and orderliness, there is also a significant correlation between GPA and diligence. [38] evaluated the efficiency of two semi-supervised learning algorithms used for prediction of academic performance of students. Their findings revealed that semi-supervised methods significantly improve the accuracy of classification by exploiting the use of many unlabeled and few labeled data for reliable predictive model development.
From the papers reviewed, it can be seen that most of the studies have been conducted outside the African continent. Our work is a significant addition to validating the results in Africa. Also, a lot of the previous research has focused on predicting success in first year programming courses using variables such as high school Mathematics, English, science, gender, age as opposed to our work which is focused on predicting the academic performance of students in third year programming courses using year one and year two programming and non-programming courses as variables.Finally, afew of the studies are focused on predicting final year GPA as opposed to our work which is on determining courses that could predict success in a Java workshop course.
3. METHODOLOGY
1659 Table 1: Selected Programming and Non-Programming Courses Offered by B.Sc. (Computer Science) Students in Bayero University, Kano, Nigeria.
The data used in this research is from the examination results of level 1 and level 2 programming and non-programming courses taken by the 109 students of of Bayero University Kano that enrolled for the course in the 2012/2013 session.
A third-year programming course was selected so that there will be enough programming and non-programming courses to make comparisons with.
The non-programming courses were grouped into three categories namely; Computer Science theory courses (CSC), Mathematics courses and Physics courses as shown in Table 1.
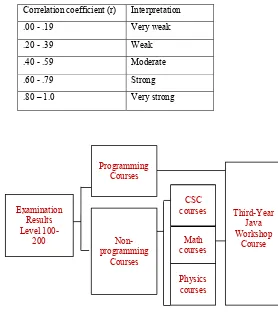
In this paper the study design is “ex post facto” where the variables cannot be manipulated as their manifestations have already occurred [29]. The data was then analyzed with SPSS version 20.0 statistical tool. A Pearson Product-Moment Correlation Coefficient (r) analysis was performed in order to find the relationship between academic performance in programming and non-programming courses. For analysis, the Pearson correlation coefficient (r) was given qualitative interpretation using Table 2. A Step-wise Linear Regression analysis was then performed to identify the important factors that predicted the students' Java course grade. Multiple Correlation Coefficient Squared ( r2 ) was used to
measure the predictive power of the predictive model. The methodology of the research is depicted in the research methodology flow of figure 1.
Table 2: Correlation coefficient interpretation
Figure 1: Research Methodology Flow Course Level Category
CST 3302: JAVA Workshop 3 Programming CSC 1226: Foundation of
Web Programming 1 Programming CSC 1302: Introduction to
Computer
Programming(Python)
1 Programming
CSC 2203: Visual Basic Workshop
2 Programming
CSC 2233: Web
Programming I 2 Programming CSC 2212: C++ Workshop 2 Programming CSC 1242: Programming
Methodology and Abstractions
1 CSC
CSC 1303: Introduction to Computer Science
1 CSC
CSC 2211: Computer System Theory
2 CSC
CSC 2231: Computer Architecture
2 CSC
CSC 2251: Analysis of
Algorithms 2 CSC
CSC 2224: System Analysis
and Design 2 CSC
CSC 2202: Data Structures 2 CSC CSC 2222: Computer
Scientist and Society
2 CSC
CST 1311: Introduction to
Probability 1 Math MTH 1301: Elementary
Mathematics I 1 Math MTH 1303:Elementary
Mathematics II 1 Math CSC 2321: Discrete
Mathematics
2 Math
CSC 2252: Elementary
Number Theory 2 Math PHY 1170: Physics Practical
I
1 Physics
PHY 1180: Physics Practical
II 1 Physics
PHY 1220: Electricity and
Magnetism 1 Physics PHY 1230: Behavior of
Matter 1 Physics
Correlation coefficient (r) Interpretation
.00 - .19 Very weak
.20 - .39 Weak
.40 - .59 Moderate
.60 - .79 Strong
.80 – 1.0 Very strong
Examination Results Level
100-200
Programming Courses
Non-programming
Courses
CSC courses
Math courses
Physics courses
Third-Year Java Workshop
1660
4. RESULTS
The results of the correlation and linear regression predictive models are given in the sub-sections below:
4.1 Correlation Results
[image:6.612.320.548.369.443.2]Correlation results for this study are presented in Tables 3, 4, 5, and 6 below. Table 3 gives the results for programming courses while Tables 4, 5, and 6 give the results for the CSC, Mathematics and Physics non-programming courses respectively. The calculated correlation coefficient (r) for each course and the Java workshop course was tested for significance using a significant level of p< 0.05 similar to the works of [30] and [31]. It is interesting to note that all the courses have moderate to strong correlations with the Java Workshop course. For the group of programming courses, the two level one courses have only moderate correlation while the remaining three, which are all level two courses, have strong correlation with the Java Workshop course. For the CSC non programming courses again, both level one courses have only moderate correlation with the Java course. However, four out of the six level two courses have strong correlation with the Java course while the remaining two have only moderate correlation. The Mathematics courses also exhibit a similar behavior with two of the three level one courses having only moderate correlation with the Java course but one of them having a strong correlation. The two level two courses, however, are both strongly related to the Java course. The courses in general with the lowest correlation are the Physics courses where one of the level one courses has a weak correlation with the Java course, two have moderate correlation and only one has a strong correlation.
Table 3: Relationship between Java Programming Performance and Programming Courses
CSC 1302
CSC 1226
CSC 2203
CSC 2233
CSC 2212
CSC3302 Pearson
Correlation .552** .455** .682** .681** .627**
N 109 109 109 109 109
**. Correlation is significant at the 0.01 level (2-tailed). *. Correlation is significant at the 0.05 level (2-tailed).
Table 4: Relationship between Java Programming
Performance and Non-programming (CSC) Courses
CSC
1303 CSC 1242 CSC 2211 CSC 2231 CSC 2251 CSC 2224 CSC 2202 CSC 2222
CSC3302 Pearson
Correlation .598** .571** .609** .623** .756** .587** .688** .579**
N 109 109 109 109 109 109 109 109
**. Correlation is significant at the 0.01 level (2-tailed).
Table 5: Relationship between Java programming Performance and Non-programming (Maths) Courses
MTH 1301
STA 1311
MTH 1303
CSC 2321
CSC 2252
CSC3302
Pearson
Correlation .644** .583** .591** .616** .664**
N 109 109 109 109 109
**. Correlation is significant at the 0.01 level (2-tailed).
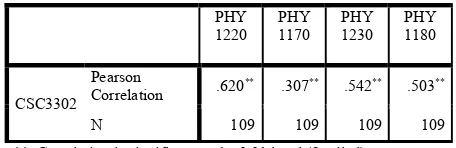
Table 6: Relationship between Java programming performance and Non-programming (Physics
Courses)
4.2 Linear Regression Results
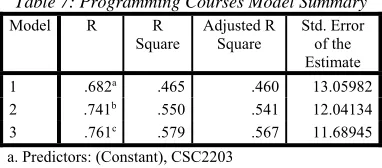
The regression results for this study are shown in Tables 7 8, 9 , 10 and 11. Only predictive models with r2 greater than or equal to 0.500 will be reported
similar to the work of [1]. In Table 7, the three predictive models for the Java course are given based on the programming courses taken by the students in level 1 and 2. The first is based on only one course with R2 = 0.465 while in the second one,
based on two courses, R 2 = .550, and was
statistically significant at, F_(2, 106) = 64.65, p = .000. In the third model, R 2 = .579, and was
statistically significant at, F_ (3, 105) = 48.23, p = .000.
PHY 1220
PHY 1170
PHY 1230
PHY 1180
CSC3302
Pearson
Correlation .620** .307** .542** .503**
N 109 109 109 109
[image:6.612.86.298.586.652.2]1661 Table 7: Programming Courses Model Summary
Model R R
Square
Adjusted R Square
Std. Error of the Estimate
1 .682a .465 .460 13.05982
2 .741b .550 .541 12.04134
3 .761c .579 .567 11.68945
a. Predictors: (Constant), CSC2203
b. Predictors: (Constant), CSC2203, CSC2212 c. Predictors: (Constant), CSC2203, CSC2212, CSC2233
For the non-programming courses, Tables 8, 9 , 10 and 11 display a summary for the predictive models. For the CSC courses, it can be seen from Table 8, that in Model 1, where there is a single predictor, R2
= .572, and was statistically significant at, F_ (1, 107) = 142.9, p = .000. In Model 2, R2 = .637, and
was statistically significant at, F_ (2, 106) = 92.91, p = .000 while in Model 3, R2 = .662, and was
statistically significant at, F_ (3, 105) = 68.65, p = .000. This implies that Model 1 can predict 57% variation in Java, Model 2 can predict 64% variation in Java and Model 3 can predict 66% variation in Java.
Table 8: Non-Programming Course (CSC) Model Summary
Model R R
Square
Adjusted R Square
Std. Error of the Estimate
1 .756a .572 .568 11.685
2 .798b .637 .630 10.813
3 .814c .662 .653 10.475
a. Predictors: (Constant), CSC2251
b. Predictors: (Constant), CSC2251, CSC2202
c. Predictors: (Constant), CSC2251, CSC2202, CSC1303
For the Mathematics courses, it can be seen from Table 9 that in Model 2, R2 = .507, and was
statistically significant at, F_ (2, 106) = 54.52, p = .000. For the Physics courses, however, as seen in Table 10, none of the models could predict up to 50% variation in the Java course.
Table 9: Non-Programming Course (Math) Model Summary
Model R R
Square Adjusted R Square Std. Error of the Estimate
1 .664a .441 .436 13.345
2 .712b .507 .498 12.596
a. Predictors: (Constant), CSC2252
[image:7.612.317.515.111.182.2]b. Predictors: (Constant), CSC2252, MTH1301
Table 10: Non-Programming Courses (Physics) Model Summary
Model R R
Square
Adjusted R Square
Std. Error of the Estimate
1 .620a .384 .378 14.013
2 .651b .424 .413 13.616
a. Predictors: (Constant), PHY1220
b. Predictors: (Constant), PHY1220, PHY1230
When the programming and non-programming courses are combined, as the results shown in Table 11 indicate, two new models emerge in addition to those earlier discussed. In Model 4, R2 = .683, and
was statistically significant at, F_ (4, 104) = 56.08, p = .000 while in Model 5, R2 = .696, and was
[image:7.612.318.516.345.446.2]statistically significant at, F_ (5, 103) = 47.09, p = .000.
Table 11: All Programming and Non-Programming Courses Model Summary
Model R R
Square
Adjusted R Square
Std. Error of the Estimate
1 .756a .572 .568 11.685
2 .798b .637 .630 10.813
3 .818c .669 .659 10.372
4 .827d .683 .671 10.194
5 .834e .696 .681 10.040
a. Predictors: (Constant), CSC2251
b. Predictors: (Constant), CSC2251, CSC2202
c. Predictors: (Constant), CSC2251, CSC2202, CSC2203 d. Predictors: (Constant), CSC2251, CSC2202, CSC2203, CSC2212
e. Predictors: (Constant), CSC2251, CSC2202, CSC2203, CSC2212, CSC1303
5. DISCUSSION OF RESULTS
1662 programming. In fact, there was one Physics course (PHY1170) that had a weak correlation (0.307) suggesting perhaps that its contents are not very relevant to Computer Science students. This finding is similar to [4] that found Physics to be moderately correlated to programming success and contrary to the findings of [11] that found Physics to be a significant predictor of programming success.
However, it is interesting to note that in between these Physics courses there is a level one web programming course (CSC 1226) which also has a very low correlation (r=0.455). This rather surprising result may be because web programming is markedly different in nature from real programming languages such as Java. It may also be an indication that it is not suitably placed as a level one course. Besides this finding is similar to [12] that also found an introductory programming course to have a low correlation (0.319) with overall student performance. It is also worth noting that the lower level programming courses are not the ones that are very strongly related to the Java course. This may be an indication that it is not only the programming courses that lead to a better understanding of Java; many of the other non-programming courses are also vital towards a solid background in Java.
Another observation worth noting is the fact that the level one courses, in general, have lower correlations than level two courses. This may be attributed to the fact that when students come fresh into the university, the courses they take are general introductory courses meant to give them a strong foundation to the entire discipline of Computer Science rather than to the specific field of programming but as they progress into Level 2, there is more focus on introducing them to programming languages. So also as explained in [11] courses nearer to the predicting variable are more likely to be predictors. It is particularly instructive to note that the course with the highest correlation (CSC2251) is not a programming course. This finding is similar to that of [1] and [12] that found the course "Data Structures and Analysis of Algorithms" to be a significant predictor of success in programming.A closer look at the course reveals the reason of its high correlation; it is a course on analysis of algorithms which clearly would assist students in writing good Java programs.
The results for the programming courses regression showed that the strongest model that can predict approximately 58% variation in Java comprises of the courses CSC2203, CSC2212 and CSC2233. This is not surprising because these are the three courses with the highest correlation value with the Java course. Besides, the finding is similar
to [1], [4], [5] that reported success in programming based on previous programming experience.
On the other hand, the results for the CSC courses regression showed that the strongest model which could predict 66% of variation in Java comprises of the courses CSC2251, CSC2202 and CSC1303, out of which the first two are the courses with the strongest correlation in non-programming while CSC1303 is 9th in correlation value amongst
non-programming courses. The findings of the two courses CSC2251, CSC2202 is similar to that of [1] and [12] that reported the same courses as predictors of success in programming. The emergence of CSC1303 rather than the other courses that have higher correlations is rather strange. However this is not shocking because CSC 1303 is a fundamental course which teaches students problem solving techniques and developing algorithms for different problems.
The results for the Mathematics courses regression showed that the strongest model which could predict 50% of variation in Java comprises of the courses CSC2252 and MTH1301. The appearance of CSC2252 (Number Theory) may probably be because computers deal extensively with numbers (especially 0s and 1s). Besides Mathematics courses in general have been reported as significant predictors of programming success [2], [4], [5], [6], [7],[8] [9].When all the selected programming and non-programming courses are used, the model with the strongest predictive power comprises of the courses CSC2251, CSC2202, CSC2203, CSC2212, and CSC1303. Out of these two are programming (CSC 2203(VB) and CSC2212 (C++)) and all the remaining three are non-programming CSC courses (CSC2251 (Analysis of algorithm), CSC2202 (Data Structures) and CSC 1303(Introduction to Computer Science)). These 5 courses become the determinants of success in Java Programming.
1663
Java course. Finally, this research could help in raising academic attainment and improving students' performance.
6. THREATS TO THE VALIDITY OF THE FINDINGS
One of the major challenges of this research is in the limited data set taken comprising only students that took the Java programming course. Therefore, the remaining set of students that failed or dropped before taking the Java course have not been considered in the research. Additionally, traditional research methods of surveys and written tests have not been utilized as they have been shown to be difficult to use to conclude and generalize on students' performance [28].
It is essential to take into account that these findings only represent students of Computer Science and not all the students of the university that take courses in Java (eg. Computer Engineering students). It would be interesting to repeat the same research for these other students. The findings are also only for a specific university underlying the need to have a larger dataset comprising the results of students from several universities.
8. DIFFERENCE FROM PRIOR WORKS
Some of the peculiar findings from this research based on our results include the appearance of CSC1303(Introduction to Programming) as a significant Java programming course predictor, the revelation that CSC1226 (Web Programming) had the second weakest correlation in all the courses and the fact that no Mathematics course appeared as a predictor when programming and non-programming courses are used.
7. CONCLUSIONS
This paper determines the relationship among students’ results of a third year Java Workshop Course with those of lower level courses taken in year one and year two and develops predictive models based on this relationship. Both correlation and regression analyses were used. The results showed strong correlations between several of the programming and non-programming courses and the Java programming course with the strongest correlation occurring in the course ((CSC2251: Analysis of Algorithms) (r= 0.756) and the weakest correlations coming from the three Physics courses PHY1230(r=0.542), PHY1180 (0.503) and PHY1170 (0.307) as well as CSC1226 (0.455).The
regression analysis came out with the strongest predictive model, comprising of the courses (CSC 2203(VB), CSC2212 (C++)), (CSC2251 (Analysis of Algorithms), CSC2202 (Data Structures) and CSC 1303 (Introduction to Computer Science)), able to account for 70% variance in the results of the Java programming course.
This study clearly illustrates that the performance of students in some lower level courses can be used to predict their results in the Java programming course. If, as has been found out in this study, some courses are determinants of success in programming for a student hoping to become an IT professional , it would be interesting to find out the determinant courses for success in other professional fields such as Accounting, Law, Medicine and Engineering. Future research work should therefore focus on creating a general model that can be used to reasonably predict students’ performance in higher level courses from lower level ones.
REFRENCES:
[1] A. T. Chamillard, “Using Student Performance Predictions in a Computer Science Curriculum,” ACM SIGCSE Bull.,
vol. 38, no. 3, pp. 260–264, 2006.
[2] J. C. F. DE Winter and D. Dodou, “Predicting Academic Performance in Engineering Using High School Exam Scores *,” Int. J. Eng. Educ., vol. 27, no. 6,
pp. 1343–1351, 2011.
[3] M. McCracken, V. Almstrum, D. Diaz, M. Guzdial, D. Hagan, Y. B. D. Kolikant, and T. Wilusz, “A national, multi-institutional study of assessment of programming skills of first-year CS students.,” ACM SIGCSE Bull., vol. 33, no.
4, pp. 125–180, 2001.
[4] S. Bergin and R. Reilly, “Predicting introductory programming performance : A multi-institutional multivariate study,”
Comput. Sci. Educ., vol. 16, no. 4, pp. 303–
323, 2006.
[5] B. C. Wilson and S. Shrock, “Contributing to Success in an Introductory Computer Science Course : A Study of Twelve Factors,” ACM SIGCSE Bull., vol. 33, no. 1,
pp. 184–188, 2001.
[6] J. Bennedsen and M. E. Caspersen, “An Investigation of Potential Success Factors for an Introductory Model-Driven Programming Course,” in In proceedings of the first international workshop on
1664 2005, pp. 155–163.
[7] S. Bergin and R. Reilly, “Programming : Factors that Influence Success,” ACM
SIGCSE Bull., vol. 37, no. 1, pp. 411–415,
2005.
[8] J. Zimmermann, K. H. Brodersen, H. R. Heinimann, and J. M. Buhmann, “A Model-Based Approach to Predicting Graduate-Level Performance Using Indicators of Performance,” JEDM-Journal Educ. Data Min., vol. 7, no. 3, pp. 151–176, 2015.
[9] Y. Qian and J. D. Lehman, “Correlates of Success in Introductory Programming : A Study with Middle School Students,” J.
Educ. Learn., vol. 5, no. 2, pp. 73–83, 2016.
[10] P. Byrne and G. Lyons, “The effect of student attributes on success in programming,” ACM SIGCSE Bull., vol. 33,
no. 3, pp. 49–52, 2001.
[11] R. Asif, A. Merceron, and M. K. Pathan, “Predicting Student Academic Performance at Degree Level : A Case Study,” Intell. Syst.
Appl., vol. 7, no. 1, pp. 49–61, 2014.
[12] P. Golding and O. Donaldson, “Predicting Academic Performance,” in Frontiers in
Education Conference 36th annual. IEEE,
2006, pp. 21–26.
[13] B. Minaei-bidgoli, D. A. Kashy, G. Kortemeyer, and W. F. Punch, “Predicting Student Performance : An Application of Data Mining Methods With The Educational Web-Based System LON-CAPA,” in
Frontiers in Education FIE 33rd annual,
2003, p. TZA-13.
[14] S. Wiedenbeck, D. LaBelle, and N. R. V. Kain, “Factors affecting course outcomes in introductory programming,” Proc. 16th
Work. Psychol. Program. Interes. Gr., no.
April, pp. 97–110, 2004.
[15] N. Schmitt, J. Keeney, F. L. Oswald, T. J. Pleskac, A. Q. Billington, R. Sinha, and M. Zorzie, “Prediction of 4-year college student performance using cognitive and noncognitive predictors and the impact on demographic status of admitted students.,”
J. Appl. Psychol., vol. 94, no. 6, pp. 1479–
1497, 2009.
[16] P. P. Shrestha and D. R. Shields, “Correlating Student Performance in Fundamental of Construction Science Course with Mathematics and Physics Grade Point Average,” 2009.
[17] D. M. Dunleavy, M. H. Kroopnick, K. W. Dowd, C. A. Searcy, and X. Zhao, “The Predictive Validity of the MCAT Exam in
Relation to Academic Performance Through Medical School: A National Cohort Study of 2001–2004 Matriculants,” Acad. Med., vol.
88, no. 5, pp. 666–671, 2013.
[18] S. Huang and N. Fang, “Computers & Education Predicting student academic performance in an engineering dynamics course : A comparison of four types of predictive mathematical models,” Comput.
Educ., vol. 61, pp. 133–145, 2013.
[19] S. Jiang, A. E. Williams, K. Schenke, M. Warschauer, and D. O. Dowd, “Predicting MOOC Performance with Week 1 Behavior,” in Proceedings of the 7th International Conference on Educational
Data Mining, 2014, pp. 273–275.
[20] J. Chen, H. Hsieh, and Q. H. Do, “Predicting Student Academic Performance: A Comparison of Two Meta-Heuristic Algorithms Inspired by Cuckoo Birds for Training Neural Networks,” Algorithms,
vol. 7, no. 4, pp. 538–553, 2014.
[21] I. B. Puddey and A. Mercer, “Predicting academic outcomes in an Australian graduate entry medical programme,” BMC
Med. Educ., vol. 14, no. 1, pp. 1–12, 2014.
[22] M. T. Kiviniemi, “Effects of a blended learning approach on student outcomes in a graduate-level public health course,” BMC
Med. Educ., vol. 14, no. 1, pp. 1–7, 2014.
[23] M. a. Al-Barrak and M. S. Al-Razgan, “Predicting students’ performance through classification: A case study,” J. Theor. Appl.
Inf. Technol., vol. 75, no. 2, pp. 167–175,
2015.
[24] I. T. L. Schwager, U. R. Hülsheger, B. Bridgeman, and J. W. B. Lang, “Graduate Student Selection : Graduate record examination , socioeconomic status , and undergraduate grade point average as predictors of study success in a western European University,” Int. J. Sel. Assess.,
vol. 23, no. 1, pp. 71–79, 2015.
[25] R. Wang, G. Harari, P. Hao, X. Zhou, and A. T. Campbell, “SmartGPA : How Smartphones Can Assess and Predict Academic Performance of College Students,” in Proceedings of the 2015 ACM International Joint Conference on Pervasive
and Ubiquitous Computing, 2015, pp. 295–
306, 2015.
1665
the 8th International Conference on
Educational Data Mining, 2015, pp. 392–
395.
[27] A. S. Carter, C. D. Hundhausen, and O. Adesope, “The Normalized Programming State Model : Predicting Student Performance in Computing Courses Based on Programming Behavior,” in Proceedings of the eleventh annual International Conference on International Computing
Education Research. ACM, 2015, pp. 141–
150.
[28] T. Thiele, A. Singleton, D. Pope, D. Stanistreet, T. Thiele, A. Singleton, and D. Pope, "Predicting students academic performance based on school and socio-demographic characteristics,” Stud. High.
Educ., vol. 41, no. 8, pp. 1424–1446, 2016.
[29] Psychology Glossary, “Ex Post Facto Research Design.” [Online]. Available: www.alleydog.com. [Accessed: 20-Apr-2016].
[30] G. S. Mohammad, “The Relationship Between Students’ Achievement in the Theoritical and Practical Aspects of Senior School Certificate Mock Examination in Chemistry,” University of Nigeria Nsukka (unn), 2011.
[31] C. N. Ebuoh, “Relationship Between Students ’ Performance in Essay and Practical Tests in Senior Secondary School Biology Examination,” Acad. Discource,
vol. 7, no. 1, pp. 1–10, 2014.
[32] R. Asif, A.Merceron, S.A.Ali, and N.G.Haider, “Analyzing undergraduate students' performance using educational data mining”,Computers & Education, vol 113,
pp. 177-194, 2017
[33] I.A.A. Amra and A.Y. Maghari, “Students Performance Prediction Using KNN and Naïve Bayesian”, in Information Technology (ICIT), 2017 8th International
Conference on (pp. 909-913). IEEE
[34] O. H. T. Lu, A. Y. Q. Huang, A. J. Q. Lin, H.Ogata, and S. J. H.Yang, “Applying Learning Analytics for the Early Prediction of Students’ Academic Performance in Blended Learning”, Educational
Technology & Society, vol. 21 , no.2, pp.
220–232, 2018
[35] J.M. Cerdeira, L.C. Nunes, A.B. Reis and C.Seabra, “Predictors of Student Success in Higher Education: Secondary School
Internal Scores versus National Exams”,
Higher Education Quarterly (2018).
[36] S.J.Yang, O.H. Lu, A.Y.Huang, J.C. Huang, H.Ogata, and A.J.Lin,
“
Predicting Students’ Academic Performance Using Multiple Linear Regression and Principal Component Analysis”. Journal ofInformation Processing, vol.26, pp.
170-176, 2018
[37] Y.Cao, J.Gao, D.Lian, Z.Rong, J.Shi, Q. Wang, W.Yifan, Y.Huaxiu, and T.Zhou, “Orderliness Predicts Academic Performance: behavioural analysis on campus lifestyle” Journal of the Royal
Society Interface, vol.15, no.146, 2018
[38] I.E. Livieris, K.Drakopoulou, V.T. Tampakas, T.A.Mikropoulos, and P.Pintelas. “Predicting Secondary School Student’s Performance Utilizing a Semi-Supervised Learning Approach”. Journal of