International Journal of Emerging Technology and Advanced Engineering
Website: www.ijetae.com (ISSN 2250-2459,ISO 9001:2008 Certified Journal, Volume 4, Issue 7, July 2014)
796
Effect of Image Size on Threshold Selection for Segmentation
of Dense Homogeneous Objects in Tomographic
Reconstructions
Komal Yamgar
1, Prof.B.V.Pawar
21M.E E&TC, Pune University, India
2E&TC Dept, PVPIT, Pune University, India
Abstract— Accurate image segmentation is required for obtaining correct localization, shape, size of tomographic image objects, but it is difficult to obtain, in particular if one needs to segment objects that are very detailed or very small with respect to the image resolution. This is especially true in tomography if the image on which the segmentation is based is polluted by reconstruction errors or artefacts. Segmentation errors generally occur at the edges of the object where a hard edge is usually blurred in the reconstruction image. Fortunately, tomography inherently provides a way to counter this problem as projection data is available that can be used to improve or optimize standard segmentation techniques. Simultaneous Iterative Reconstruction Technique (SIRT) is used for reconstruction of tomographic image and Statistical Region Merging method (SRM) is used for segmentation of dense homogeneous objects. This is finally used for Threshold Selection for Segmentation of Dense Homogeneous Objects in Tomographic Reconstructions.
Keywords— Thresholding, Segmentation, Computed Tomography, Reconstruction, Statistical Region Merging.
I. INTRODUCTION
Computed Tomography (CT) is an imaging technique that allows visualization of interior structures. With CT, an object can be virtually reconstructed based on multiple X-ray projection images which are recorded at different directions. Computed Tomography (CT scan) is a medical imaging procedure that uses computer-processed X-rays to produce tomographic images or 'slices' of specific areas of the body. These cross-sectional images are used for diagnostic and therapeutic purposes in various medical disciplines.
Dense objects are not clearly seen in images i.e. they are blurred images. We can process these objects using segmentation. The purpose of image segmentation is to partition an image into meaningful regions with respect to a particular application.The segmentation is based on measurements taken from the image and might be grey level, colour, texture, depth or motion.
Applications of image segmentation includes identifying objects in a scene for object-based measurements such as size and shape. The use of segmentation is to simplify and/or change the representation of an image into something that is more meaningful and easier to analyze .Image segmentation is typically used to locate objects and boundaries (lines, curves, etc.) in images.
More precisely, image segmentation is the process of assigning a label to every pixel in an image such that pixels with the same label share certain visual characteristics.
Statistical region merging (SRM) is one of the techniques used to segmentation [7] .A popular method to extract such objects from a tomogram is global Thresholding, in which the threshold value is determined from the image histogram. However, accurate threshold selection is not straightforward due to noise or artefacts in the reconstruction.
Without noise or artefacts in the CT reconstruction, segmentation of dense homogeneous objects would be trivial. Unfortunately in practice accurate separation of such objects from the surroundings within a tomographic reconstruction is a nontrivial task for several reasons as mentioned below
Limited number of projection images: In many cases,
the numbers of available projections are not sufficient to guarantee a unique reconstruction. So, the computed reconstruction most likely does not correspond entirely to the underlying or unknown object.
Noise or artefacts present in the measured projection data: Real world data is inevitably polluted by noise and artefacts for example caused by malfunctioning detector elements or scatter, leading to inaccuracies in the reconstruction.
Approximations in the reconstruction algorithm:
International Journal of Emerging Technology and Advanced Engineering
Website: www.ijetae.com (ISSN 2250-2459,ISO 9001:2008 Certified Journal, Volume 4, Issue 7, July 2014)
797 II. LITERATURE SURVEY
For dense object segmentation, it is a common choice to set a global threshold somewhere between the grey level of the pixels belonging to the object and those of the maximum value of the other pixels. Typically, this threshold is selected based on the histogram of the tomogram.If only a few materials are present and each of these correspond to a distinct grey level peak in the histogram, it is possible to accurately determine appropriate thresholds, for example by analyzing the concavity points on the convex hull of the histogram or by modeling the histogram as a mixture of a series of Gaussian distributions. The most popular global threshold selection method is the clustering method of Otsu [9].
It minimizes the weighted sum of intra-class variances of the different segmentation partitions.
Different approaches to segmentation of dense objects also exist, e.g., region-based algorithms such as region growing and watershed segmentation .These methods are also solely based on the reconstructed image and are therefore very susceptible to reconstruction artefacts. Recently, a new method was proposed for global [3] and local [4] threshold selection in tomograms, called projection distance minimization (PDM). This approach is based on the assumption that the scanned object contains a small number of different densities, which corresponds to a constant grey level in the reconstruction. To measure the quality of this segmentation, projections of the segmentation are computed and compared to the measured projection data. An optimal segmentation will result in maximal correspondence between the simulated projections and the measured dataset. However, this approach requires that the scanned object contains only a few different densities and does not allow for segmentation of objects with a constant grey level in a continuously varying surrounding.
SIRT is an Iterative X-ray computed tomography (CT) algorithms [9].It has the potential for producing high-quality images but is computationally very demanding. SIRT is well known in the literature as it has been applied to a rather diverse set of inverse problems in medicine and biology. Statistical region merging [7] explores a statistical basis for a process often described in computer vision: Image segmentation by region merging following a particular order in the choice of regions. This approach can be efficiently approximated in linear time/space leading to a fast segmentation algorithm. The conceptual simplicity of the approach makes it simple to modify and cope with hard noise corruption.
III. DEFINITIONS AND CONCEPTS
A. SIRT Reconstruction
For many years, there has been great interest in iterative X-ray computed tomography (CT) reconstruction algorithms due to their potential for producing high-quality images, even given projection data acquired under less than ideal circumstances. Simultaneous Iterative Reconstruction Technique (SIRT) which is well known in the literature as it has been applied to a rather diverse set of inverse problems in medicine and biology. In each SIRT iteration, image is reconstructed and value is updated. This parameter value is calculated by taking difference between current and previous results.
B. Statistical Region Merging
Statistical region merging (SRM) is an algorithm used for image segmentation. This algorithm is used to evaluate the values within a regional span and grouped together based on the merging criteria which results a smaller list. Creating a group of generations within a population or in image processing grouping a group of neighbouring pixels based on their shades that fall within a particular threshold (Qualification Criteria) would be Some useful examples.
Two important components in defining a region merging algorithm:
Merging predicate: it defines how to merge
to undetermined region.
Order in merging: it defines an order to
be followed to check the merging predicate.
C. Error Between Current and Previous Iteration
In each iteration of SIRT algorithm, error is calculated as follows,
Arrerr (k) = sum (sum ((F - Fk). ^2)) (1)
Where F is original image.
Fk is reconstructed image.
k is no. of iterations.
In each iteration, Step improvement is calculated. Then following condition is checked.
If ((k>2) && (Arrerr (k)>Arrerr (k-1)))
International Journal of Emerging Technology and Advanced Engineering
Website: www.ijetae.com (ISSN 2250-2459,ISO 9001:2008 Certified Journal, Volume 4, Issue 7, July 2014)
798 IV. BLOCK DIAGRAM
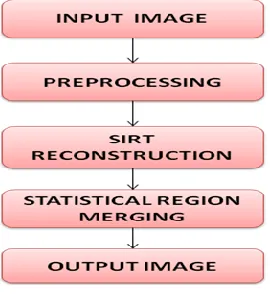
The block diagram of the present work is given in Fig .1.
Fig. 1.Block Diagram
Input image is preprocessed using different technigues.preprocessing improves the qualities of an image and image’s contrast and brightness characteristics. It also reduces noise content and sharpens the details. Preprocessed image is given as input to SIRT algorithm, which processes image to produce reconstructed image. In SIRT, image is reconstructed in each iteration, and parameter value is updated. This value is calculated by taking difference between current and previous results.SIRT output is given to SRM algorithm for segmentation to get final output.
V. EXPERIMENTAL WORK AND RESULTS
Development and implementation of software is done using MATLAB. Following results are obtained and are shown in Fig. 2 to Fig. 9.The input image (Fig.2) is processed for the different operations (Fig.3 to Fig.8).The sinogram of extracted binary image (Fig. 4) is obtained (Fig. 5).here, the noise is added in sinogram, its reconstructed image is obtained shown in Fig.7 then the output image (Fig. 9) is obtained after selecting proper threshold for segmentation. The software is tested to obtain the correct results under noisy condition. Then the Error vs. No of iterations graph is plotted shown in Fig. 10.this Graph shows that the error decreases as the number of iterations increases.
Input Image
50 100 150 200 250
50
100
150
200
250
Enhanced Image
50 100 150 200 250
50
100
150
200
[image:3.612.327.541.134.692.2]250
Fig. 2 Input Image Fig. 3 Enhanced Image
EXTRACTED BINARY IMAGE
50 100 150 200 250 50
100
150
200
250
Sinogram
50 100 150 50
100
150
200
250
300
350
Fig. 4 Extracted Binary Image Fig. 5 Sinogram
Noisy image
50 100 150 200 250
50
100
150
200
250
Fk
50 100 150 200 250
50
100
150
200
250
[image:3.612.109.244.175.322.2]International Journal of Emerging Technology and Advanced Engineering
Website: www.ijetae.com (ISSN 2250-2459,ISO 9001:2008 Certified Journal, Volume 4, Issue 7, July 2014)
799
Segmented Image
50 100 150 200 250
50
100
150
200
250
Output Image
50 100 150 200 250
50
100
150
200
250
Fig. 8 Segmented Image Fig. 9 Output Image
0 10 20 30 40 50 60 70 80 90 100
2000 3000 4000 5000 6000 7000 8000 9000
Arrerr
no of iterations
e
rr
o
r
data 1 y min y max
Fig. 10 Error plot
Four Tomographic images Fig.11 (a)-(d) are considered for study and their enhanced image, contrast adjusted image, extracted feature image, extracted binary image and sinogram are obtained.Moreover,By adding Poisson noise in the images, their reconstructed images, segmented images and output images are obtained.
(a) (b)
(c) (d)
Fig. 11.Fig (a)-(d) Four Tomographic Images
A. Images resized to 256*256
The results obtained are compiled and given in TABLE 1.
TABLE 1
Comparision of the Error for Five Images
IMAGE SIZE RESIZE THRES HOLD
ERROR
Min Max
Fig.1 512*512 256*256 0.3804 2529 9000
Fig. 10-(a) 300*300 256*256 0.3882 1613 7418
Fig. 10-(b) 512*212 256*256 0.4039 2545 9249
Fig. 10-(c) 512*512 256*256 0.4588 1252 7808
Fig. 10-(d) 512*512 256*256 0.4235 2384 9225
It is concluded from the above table that, for different images resized to 256*256, the optimal threshold obtained, is in the range 0.3804 to 0.4588, and the minimum error in the range 1252 to 2545, and the maximum error in the range 7418 to 9249.
B. Image resized to 128*128
International Journal of Emerging Technology and Advanced Engineering
Website: www.ijetae.com (ISSN 2250-2459,ISO 9001:2008 Certified Journal, Volume 4, Issue 7, July 2014)
800
TABLE II
Results for Five Different Images Resized to 128*128
IMAGE SIZE RESIZE THRESHOLD
ERROR
Min Max
Fig.1 512*512 128*128 0.3725 479 2195
Fig. 10-(a) 300*300 128*128 0.3804 345 1857
Fig. 10-(b) 512*512 128*128 0.3691 512 2267
Fig. 10-(c) 512*512 128*128 0.4549 320 1958
Fig. 10-(d) 512*512 128*128 0.4196 474 2277
For the different images, resized to the size 128*128, it is observed that threshold is in the range 0.3691 to 0.4549, where as the minimum error in the range 320 to 479 and maximum error range 1857 to 2277.
It is concluded from the TABLE 1 and TABLE 2 that, for all given images, when the images are resized to 128*128 and 256*256, it is observed that the minimum error and maximum error increases. Hence, for obtaining the threshold for the images resized to smaller value is desirable
.
C. Execution Time
TABLE III gives the execution time for the different images when resized to 256*256 under study.
TABLE III Execution Time
IMAGE SIZE EXECUTION TIME
(SEC)
Fig.1 512*512 202.0057
Fig. 10-(a) 300*300 208.1677
Fig. 10-(b) 512*512 222.1454
Fig. 10-(c) 512*512 233.6115
Fig. 10-(d) 512*512 231.7863
It is observed that, the execution time for same sized images is approximately same and in the range of 202.0057 to 233.6115 sec.
VI. CONCLUSIONS
The software developed and implemented for “Effect of Image Size on Threshold Selection for Segmentation of Dense Homogeneous Objects in Tomographic Reconstructions” works satisfactorily and the following conclusions are drawn.
It is observed in all input images, the error in reconstructed images goes on decreasing as the number of iterations goes on increasing. However, execution time for all input images approximately remains same.
Threshold magnitude decreases with the decrease in the size of resized image.
The error magnitude (minimum and maximum) also goes on decreasing with decrease in size of resized image.
Thus, developed software works satisfactorily to obtain dense homogeneous objects in tomographic reconstructions by selecting proper threshold for segmentation, which helps the doctor to obtain quantitative information about an object from its tomographic data.
REFERENCES
[1] Wim van Aarle*, Kees Joost Batenburg, and Jan Sijbers,“Optimal Threshold Selection for Segmentation of Dense Homogeneous Objects in Tomographic Reconstructions” IEEE Trans.Med. Imag., vol. 30, no. 4, April 2011.
[2] Sigurdur Helgason, Integral geometry and Radon
transforms,Springer, New York, xiv+301 pp., ISBN 978-1-4419-6054-2, hardcover, 2010.
[3] K. J. Batenburg and J. Sijbers, “Optimal threshold selection for tomogram segmentation by projection distance minimization,” IEEE Trans.Med. Imag, vol. 28, no. 5, pp. 676–686, May 2009.
[4] K. J. Batenburg and J. Sijbers, “Adaptive thresholding of tomograms by projection distance minimization,” Patt. Recognit., vol. 42, no. 10, pp. 2297–2305, 2009.
[5] W. van Aarle, J. Batenburg, and J. Sijbers, “Threshold selection for segmentation of dense objects in tomograms,” in Int. Symp. Visual Computing,Ser. Lecture Notes Comput. Sci., G. Bebis, Ed., Berlin, Germany, vol. 5358, pp. 700–709, Dec. 2008.
[6] Richard Nock and Frank Nielsen, “Statistical Region Merging”
IEEE Trans.on Pattern Analysis and Machine Intelligence , vol. 26, no. 11, November 2004.
[7] Jens Gregor* and Thomas Benson,“Computational Analysis and Improvement of SIRT”, IEEE Trans.Med. Imag., vol. 27, no. 7, July 2008.
[8] A.B.M. Faruquzzaman Nafize Rabbani Paiker Jahidul Arafat M. Ameer Ali, “A Survey Report on Image Segmentation Based on Split and Merge Algorithm”, IETECH Journal of Advanced Computations, Vol: 2, No: 2, 086 - 101© IETECH Publications, 2008.