International Journal of Emerging Technology and Advanced Engineering
Website: www.ijetae.com (ISSN 2250-2459,ISO 9001:2008 Certified Journal, Volume 5, Issue 4, April 2015)
95
Observation and Cloud Storage of Crop Leaf Area Index Using
Wireless Sensor Network
A. Ahamed Meeran Mydeen
1, A. Balasubramanian
2, V. Mahalakshmi
3, P. K. Dhal
41,2
M.Tech Student, Department of Electrical and Electronics Engineering & Vel Tech Dr. RR & Dr. SR Technical University, Chennai, India
3Technical Instructor, Department of Electronics and Communication Engineering & Vel Tech Engineering College (Owned by
RS Trust), Chennai, India
4
Professor, Department of Electrical and Electronics Engineering & Vel Tech Dr. RR & Dr. SR Technical University, Chennai, India
Abstract— With the growing population and the ever growing demand for rain, the scientists and researchers across the globe are busy trying to find innovative ways to meet these ever surging demands in deforestation. This paper deals with the growth of forest by measuring Leaf area index (LAI). The collection of ground measurements for validating remotely sensed crop leaf area index (LAI) is labor and time intensive. This paper deals with an automatic measuring system that is designed based on a wireless sensor network (WSN) and the samples collected were examined on cloud. In order to distribute and to handle large number of data’s makes the concept of cloud computing to implement in various domains which enables limitless, usefulness on demand network access on computing resources placed at various places. The advantages like simple and effective solutions to the computing and data sharing makes the developers to apply the concept of cloud computing in their field.
Keywords— Leaf Area Index, Wireless Sensor Network, Cloud Computing
I. INTRODUCTION
Leaf area index (LAI) is one key driver of crop productivity. Leaf area index is directly related to many of the factors that farmers view as production reducers such as lack of moisture or too much moisture, soil nutrients, hail damage and pests. Understanding LAI can help reveal fields or a portion of fields that may be under-producing says Madsen. The LAI-2200C overcomes many of the traditional problems associated with measuring LAI, allowing easier and more accurate measurements in daylight situations. The LAI-2200C employs the gap fraction technique - a powerful and practical tool available for indirect sensing of plant canopy structure[1]-[2]. While other types of LAI measurements such as ceptometry may be less effective or an inaccurate for row crops and non-uniform canopies. The LAI-2200C provides the ability to restrict the field of view (both azimuth and zenith), making it ideal for certain agricultural situations.
The data were analyzed in three ways: (1) a comparison with LAI-2000 (2) a daily and 5-day aggregated time series analysis (3) a comparison with a Moderate Resolution Imaging Spectra radiometer (MODIS) LAI using both a ground LAI Net LAI and a scaled-up LAI through inversion of Advanced Space borne Thermal Emission and Reflection radiometer (ASTER) data.
II. LAIMETHODOLOGY
There are two main categories to estimate LAI: direct and indirect methods .The former group consists of methods measuring leaf area in a direct way, while the latter group consists of methods where LAI is derived from more easily measurable parameters.
A. Direct LAI Measurement
Direct methods are the most precise but it has disadvantage of being extremely time-consuming and as a consequence making large-scale implementation only marginally feasible. Precision problems may in this case result from the definition of LAI, the scaling-up method or from the error accumulation due to frequently repeated measurements [3].
B. Indirect LAI Determination
Indirect methods in which leaf area is inferred from observations of another variable which are generally faster, amendable to automation and thereby allow for a larger spatial sample to be obtained [4]. For reasons of convenience when compared to the direct methods, they are becoming more and more important. Indirect methods of estimating LAI in-situ can be divided in two categories: (1) indirect contact LAI measurements and (2) indirect
non-contact measurements. These are ground-based
International Journal of Emerging Technology and Advanced Engineering
Website: www.ijetae.com (ISSN 2250-2459,ISO 9001:2008 Certified Journal, Volume 5, Issue 4, April 2015)
96 .
max
(1
)
i c LAI
P
P
e
(1)Where
max
P
= Maximum crop productioni
C
= ith crop growth coefficientIII. EXISTING SYSTEM OF CROP LEAF AREA INDEX
LAI ground validation methods are classified as either direct or indirect. The direct method is considered to be the most reliable for LAI ground truth. However due to its low efficiency, the direct method can only be used to obtain the ground LAI reference values which are used to calibrate other indirect measuring instruments [5]. In the field of earth observations, a new method based on wireless sensor network (WSN) technology which is called the earth observation sensor web (EOSW).The EOSW has been preliminarily applied in many research fields such as sea ice, soil moisture and environmental monitoring. Currently, in terms of vegetation WSN monitoring, a significant amount of work has been performed to measure the environmental parameters (such as temperature and moisture) of vegetation growth. However few studies have evaluated the automatic measurement system of vegetation LAI Compared to the newly emerging EOSW technique over the past 20 years. The ground-based LAI measurements have developed relatively slowly.
The automatic LAI measurements which can be used for large areas which are critical for ground validation experiments of remote sensing surface parameters. These systems should be designed to save energy and to make simultaneous observations of a large number of measured points in space and to ensure continuous observation over time [6]. Based on the direct light transmittance algorithm for measuring the LAI, it is developed an LAI measurement system: LAINet. LAINet is a low-cost LAI network measurement system based on WSN technology.
IV. PROPOSED SYSTEM OF CROP LEAF AREA INDEX
In the field of earth observations, a new method based on wireless sensor network (WSN) technology, which is called the earth observation sensor web (EOSW), has gained an increasing attention. This system deploys an optical sensor under the canopy to capture the vegetation canopy transmittance and calculates the LAI based on the Beer–Lambert law [7]. However, due to the heterogeneity of canopies, the transmittance obtained from a single sensor is not enough to represent the transmittance of the entire canopy.
This paper has the following aims:
1)To develop a WSN system to take automatic LAI
measurements that is suitable for validating the remotely sensed products;
2)To validate the performance of the newly developed canopy structure measurement system and conduct a comparative analysis of the commonly used LAI measurement instruments; and
3)To compare the LAI measured from developed WSNs
with MODIS products and analyze their time variation characteristics.
4)To validate the data’s collected and compared were examined under cloud computing technique.
Figure1. Block diagram of crop leaf area index system A. Cloud Storage System
Cloud storage is nothing a stockpile of data’s hooked up in the cloud in which point for a company’s data is gathered and saved in and accessible from various distributed and connected assets that compromise a cloud. Some of the merit of cloud storage is easy accessibility and loyalty, hasty stationing, firm protection and disaster recovery purposes [8]. Basically the cloud storage is divided into four categories. They are as follows
1. Personal cloud storage 2. Public cloud storage 3. Private cloud storage 4. Hybrid cloud storage.
International Journal of Emerging Technology and Advanced Engineering
Website: www.ijetae.com (ISSN 2250-2459,ISO 9001:2008 Certified Journal, Volume 5, Issue 4, April 2015)
97
The cloud storage provider fully manages the enterprise's public cloud storage. Private cloud storage helps resolve the potential for security and performance concerns while still offering the advantages of cloud storage. Hybrid cloud storage is a combination of public and private cloud storage where some critical data resides in the enterprise's private cloud while other data is stored and accessible from a public cloud storage provider. The cloud storage is mainly accessed over by a service provider in the market to store the data.
B. Sensors
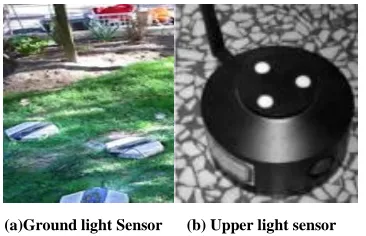
Fig 1 illustrates the block diagram of the proposed system. In which the purpose of using sensor is to measure the intensity of light falling on the research area. Basically the sensors can be operated in two modes 1.Light mode 2. Dark mode. When the intensity of light is more the signal produced by the sensor is high whereas the light intensity becomes low the signal produced by the sensor is also low as shown in figure2.
(a)Ground light Sensor (b) Upper light sensor Figure 2 (a) sensor placed above the canopy (b) The sensors placed
below the canopy. C. Humidity Sensor
The purpose of using sensor is to measure the intensity of light falling on the research area. Basically the sensors can be operated in two modes 1.Light mode 2. Dark mode. When the intensity of light is more the signal produced by the sensor is high whereas when the light intensity becomes low the signal produced by the sensor is also low [9] as shown in figure 3.
(a) Humidity sensor (b) intelligent humidity Sensor Figure 3 (a) Block diagram of humidity sensor.
(b) Intelligent Humidity Sensor.
[image:3.612.352.551.137.290.2]The purpose of humidity sensor is to determine the moisture content. The measurement of humidity is common and essential in various field named as agriculture, forest growth, food and electronic industries etc., The humidity sensor employed in this paper monitors the moisture content in the soil based on the information provided by the sensor according to the data collected from the sensor the growth factor is determined and evaluated using the comparison graph as shown in figure 4.
Figure 4 series test performance
[image:3.612.85.268.368.486.2] [image:3.612.332.553.409.548.2]International Journal of Emerging Technology and Advanced Engineering
Website: www.ijetae.com (ISSN 2250-2459,ISO 9001:2008 Certified Journal, Volume 5, Issue 4, April 2015)
98
D. Data Processing
The Main element of data processing unit is controller. The use of controller eliminates the usage of an additional block of ADC, improves the storage capability and also the controller has a devoted input and often the output can be viewed using LED or LCD display. The controller forced to receive input from the device it is controlling and also sending signals controls the device. The controller employed receives the data from sensors i.e. in the form of analog and the controller is programmed in such a way that the received analog signal is converted to digital as per the digitized data the calculation for leaf area index (LAI) is calculated and the result is transmitted to cloud through GPRS[10].
E. Cloud Computing Concept
In the growing and consideration as the technology the cloud compute concept which provide a services in a very same and user friendly at a very low cost. The main term of ―cloud computing concept‖ refers to that the user does not need to know about services provider the user hits all the technologies from the services provider. The main fact lies on the cloud is the user can availed the data in whenever and wherever they need .it also offer an zero maintenances and less manpower[11]. Cloud computing has four models namely private, community, public and hybrid. Figure 5 shows the architecture of cloud computing.
Figure5. Architecture of Cloud Computing F. Software as a Service(SaaS)
This model offers a T tools such as software, web applications etc., without the need to buy and install them in specific c machines.
Another feature of this model is that the users are billed as per the uses basis, unlike the traditional way of paying for the software to purchase it.
G. Platform as a Service (PaaS)
In this particular model the end-users are offered the computing platform for designing and developing specific c applications without the need to buy the license or the product. PaaS also takes care of hosting those applications without much concern about hardware and data storage requirement. It mainly guarantees the availability of the platforms and their security.
H. Infrastructure as a Service(IaaS)
This form of cloud computing usually includes components that are used in availing ICT services, such as virtual computers, data centers, traffic monitoring and redirecting, basic network components etc. This is the most outstanding benefit of cloud computing as the organizations invest themost in establishing the infrastructure[12].These delivery models form the core of the cloud and they exhibit certain characteristics like on demand self- service, broad network access, resource pooling, measured service and rapid elasticity.
V. CALCULATION OF PROPOSED SYSTEM
A. Multi Angle Transmittance (MAT)
The samples collected from the research area through the WSN between January and February 2015.the data collected from the sensor placed above the canopy and below the canopy. The sensor placed above the canopy (Three nodes) receives the radiation throughout a day is matched with the sensor placed below the canopy level and it is assumed that the radiation is distributed uniformly on the sensor placed above the canopy [13]-[14]. From the samples collected throughout a day is matching with the two sensors in a point and the multi angle transmittance is calculated. The following step shows the calculation of MAT (Multi angle transmittance),
Based on the latitude, longitude and measurement
period the solar elevation angle is calculated.
The overlapping time of the two nodes were
calculated from the sensors placed above and below the canopy throughout a day.
To calculate the MAT (Multi angle transmittance)
the ratio between the samples obtained from the sensors placed above and below the canopy.
1
2 ADC MAT
ADC
International Journal of Emerging Technology and Advanced Engineering
Website: www.ijetae.com (ISSN 2250-2459,ISO 9001:2008 Certified Journal, Volume 5, Issue 4, April 2015)
99
B. LAI Calculation
Leaf Area Index (LAI) measures the amount of leaf material in an ecosystem, which imposes important controls on photosynthesis, respiration, rain interception, and other processes that link vegetation to climate. When ADC1 < ADC2, the L i isobtained using the Fredholm
equation. LAI can be obtained by using
M
i i
LAI
L
(3)
L
i= Light emission
Figure 6 (a) Detector ring Figure 6(b) View angle
Each detector ring views a different portion of the canopy or sky centered on one of the five view angles as shown in figure 6. The fraction of diffuse incident radiation that passes through a plant canopy, for each view angle, can be expressed as
int
( )
int
Diffuse
ensitybelowthecanopyofviewangle
T
Diffuse
ensityabovethecanopyofviewangle
( )
T
is the probability of diffuse non interceptance for a given view angle called the gap fractionC. Comparison of LAI with MODIS and ASTER Data
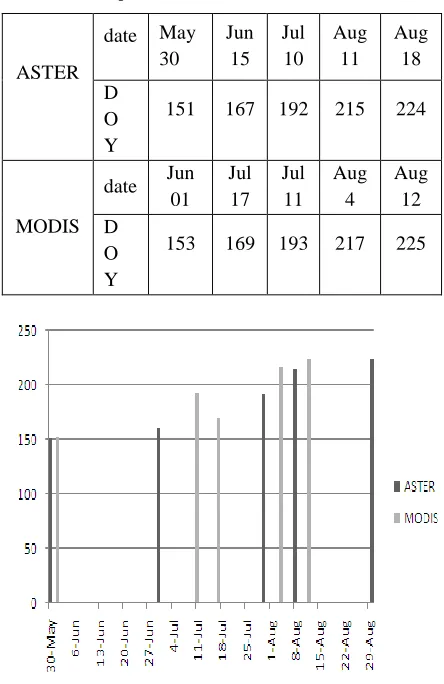
[image:5.612.330.552.153.495.2]The LAI data from the Lai net was compared with the data in MODIS average data was obtained and (ASTER) Advanced Space borne Thermal Emission and Reflection Radiometer time range and product covering rate were obtained. LAI NET produce the data output which fail to provide an image from ASTER and MODIS. The observation from the satellite date was translated as (DOY) date of year.
Table 1
Comparison of ASTER and MODIS Data
ASTER
date May 30
Jun 15
Jul 10
Aug 11
Aug 18
D O Y
151 167 192 215 224
MODIS
date Jun
01 Jul
17 Jul
11 Aug
4
Aug 12 D
O Y
153 169 193 217 225
Figure 7: Performance Chart for ASTER and MODIS Table 1 shows the data’s collected from MODIS and ASTER satellites data of LAI Measurements and the two data’s were correlated followed by a performance chart in figure7.
VI. SIMULATION AND DISCUSSION
[image:5.612.52.284.228.393.2]International Journal of Emerging Technology and Advanced Engineering
Website: www.ijetae.com (ISSN 2250-2459,ISO 9001:2008 Certified Journal, Volume 5, Issue 4, April 2015)
100
It provides the technique of sending the data via network. But through by using a wireless sensor network (WSN). The data can be prudently access and with the product were potential similarly validated in the remote sensing area by which the main aim and work of this paper which begin with the cloud computing techniques. If the data has to be periodically examined over a certain period of time separate server has to be maintained and the collected data has to be accessed from the server. In the server the data was examined and from the server the client can view the data, it needs the main process of server system to collect and store the data.
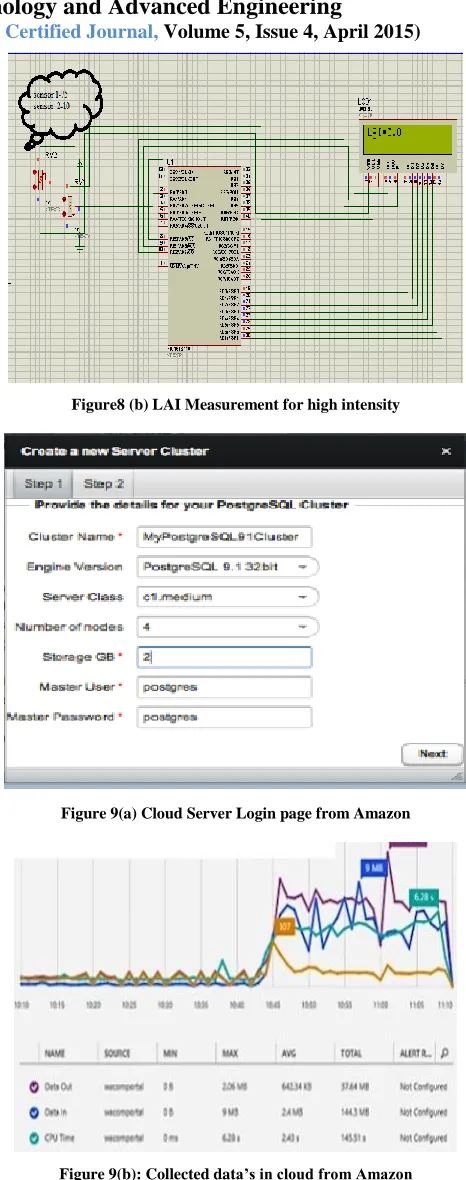
The real time data storing strategy which may causes preventing the data cost in case of server does work properly. So through by new technology of cloud the user can be provided with public access or private access. The data which collected from the GPRS module which can be access over by either can see all through by public access or to see and view through simple user can be accessed via over by private access whenever and wherever. The work which examined in this paper to store the huge data’s of the measurement of leaf area index in far flung areas using the advanced technique of cloud computing and to retrieve the data’s as it is needed. The simulations were performed using PORTEUS working environment and the program were loaded into the controller. Fig 8(a) illustrates the snapshot of the screen PORTEUS working environment. Based on the intensity falling on the sensor the Leaf area index value varies. In figure 8(b) the leaf index area of the floras is displayed as 1.3 and this value is obtained by adjusting the sensors S1 and S2. Similarly by adjusting the sensors value the LAI= 3.0 is obtained. It reveals that the vegetation growth is good when the LAI value is least.
Figure8 (a) LAI Measurement for low intensity
Figure8 (b) LAI Measurement for high intensity
Figure 9(a) Cloud Server Login page from Amazon
[image:6.612.326.559.109.699.2] [image:6.612.55.282.519.698.2]International Journal of Emerging Technology and Advanced Engineering
Website: www.ijetae.com (ISSN 2250-2459,ISO 9001:2008 Certified Journal, Volume 5, Issue 4, April 2015)
101
VII. CONCLUSION
The automatic measurement of the floras LAI with WSN techniques was flourished in this paper. The continuous time series LAI was observed and analyzed between the different measurement and data obtained from ASTER and MODIS. The sensor network technology which is mainly used for collecting the data and transmitting the far flung data’s which can improve the data salvage and reduce human breach. In this paper the method to measure the LAI has the potential to support the ground validation which obtained by the remote sensing. As per the discussion above on the paper which has advantages of LAI net has an ability to provide the continuous observation of the growth process. The LAI net include is calculated with the satellite data from the two accepted method by which direct and scaled up method. The Luminous dispersion which mainly affects the LAI Net values the many observations instruments which lay to obtain the proportion of the luminous dispersion. The plan is to solve the proportion of light and inverse of the precision in LAI net method.
REFERENCES
[1] Methods for Leaf Area Index Determination part-I: Theories, Techniques and Instruments.
[2] Jonckheere, I., Fleck, S., Nackaerts, K., Muysa, B., Coppin, P., Weiss, M., and Baret, F.,― Review of methods for in situ leaf area index determination Part I. Theories, sensors and hemispherical photography. Agricultural and Forest Meteorology’’, 121: 19–35. 2004
[3] Yonghua Qu, Yeqing Zhu, Wenchao Han, Jindi Wang, and Mingguo Ma,― Crop Leaf Area Index Observations with a Wireless Sensor Network and Its Potential for Validating Remote Sensing Products’’, IEEE journal of selected topics in applied earth observations and remote sensing, vol. 7, no. 2, february 2014
[4] D. Liping, K. Moe, and T. L. van Zyl, ―Earth observation sensor web: An overview,‖ IEEE J. Sel. Top. Appl. Earth Obs. Remote Sens., vol. 3, no. 4, pp. 415–417, Dec. 2010.
[5] P. M. Teillet, ―Sensor webs: A geostrategic technology for integrated earth sensing,‖ IEEE J. Sel. Top. Appl. Earth Obs. Remote Sens., vol. 3, no. 4, pp. 473–480, Dec. 2010.
[6] M. Moghaddam, D. Entekhabi, Y. Goykhman, L. Ke, L. Mingyan, A. Mahajan, A. Nayyar, D. Shuman, and D. Teneketzis, ―A wireless soilmoisture smart sensor web using physics-based optimal control: Conceptand initial demonstrations,‖ IEEE J. Sel. Top. Appl. Earth Obs. RemoteSens., vol. 3, no. 4, pp. 522–535, Dec. 2010.
[7] Y. Qu, J. Wang, J. Dong, and F. Jiang, ―Design and experiment of crop structural parameters automatic measurement system,‖ Trans. CSAE, vol. 28, pp. 160–165, 2012 (in Chinese with English abstract).
[8] Hamid Farahani 1, Rahman Wagiran 1 and Mohd Nizar Hamidon 2, ―Humidity Sensors Principle, Mechanism, and Fabrication Technologies: A Comprehensive Review’’.
[9] Dr. G Sahoo, Dr. Shabana Mehfuz and Rashmi Rai,― Applications of Cloud Computing for Agriculture Sector’’,CSI Communications |November 2013 | 10 www.csi-india.org.
[10] LI-COR Improves Measurements of Leaf Area Index toIdentifyCropProductivityChangesinAgriculture.(http://cloudcompu ting.tmcnet.com/news/214/7/14/7921760.html)
[11] Weiss M., Baret, F., Smith, G.J., Jonckheere, I., and Coppin, P. 2004. Review of methods for in situ leaf area index (LAI) determination. Part II. Estimation of LAI, errors and sampling. Agricultural and Forest Meteorology 121: 37–53.
[12] AgroMobile: A Cloud-Based Framework for Agriculturists on Mobile Platform Shitala Prasad1, Sateesh K. Peddoju2 and Debashis Ghosh3 1, 2 Department of Computer Science and Engineering, 3Department of Electronics and Communication Engineering, IIT Roorkee.
[13] Yanxin Zhu 1,2, Di Wu2 and Sujian Li1,― Cloud Computing and Agricultural Development of China:Theory and Practice’’, IJCSI International Journal of Computer Science Issues, Vol. 10, Issue 1, No 1, January 2013.