comm
en
t
re
v
ie
w
s
re
ports
de
p
o
si
te
d r
e
se
a
rch
refer
e
e
d
re
sear
ch
interacti
o
ns
inf
o
rmation
New genes in the evolution of the neural crest differentiation
program
Juan-Ramon Martinez-Morales
¤
, Thorsten Henrich
¤
, Mirana Ramialison
¤
and Joachim Wittbrodt
Address: Developmental Biology Unit, EMBL, Meyerhofstraße, 69117 Heidelberg, Germany.
¤ These authors contributed equally to this work.
Correspondence: Joachim Wittbrodt. Email: [email protected], Juan-Ramon Martinez-Morales. E-mail: [email protected]
© 2007 Martinez-Morales et al.; licensee BioMed Central Ltd.
This is an open access article distributed under the terms of the Creative Commons Attribution License (http://creativecommons.org/licenses/by/2.0), which permits unrestricted use, distribution, and reproduction in any medium, provided the original work is properly cited.
Gene emergence in neural crest evolution
<p>The phylogenetic classification of genes that are ontologically associated with neural crest development reveals that neural crest evo-lution is associated with the emergence of new signalling peptides.</p>
Abstract
Background: Development of the vertebrate head depends on the multipotency and migratory behavior of neural crest derivatives. This cell population is considered a vertebrate innovation and, accordingly, chordate ancestors lacked neural crest counterparts. The identification of neural crest specification genes expressed in the neural plate of basal chordates, in addition to the discovery of pigmented migratory cells in ascidians, has challenged this hypothesis. These new findings revive the debate on what is new and what is ancient in the genetic program that controls neural crest formation.
Results: To determine the origin of neural crest genes, we analyzed Phenotype Ontology annotations to select genes that control the development of this tissue. Using a sequential blast pipeline, we phylogenetically classified these genes, as well as those associated with other tissues, in order to define tissue-specific profiles of gene emergence. Of neural crest genes, 9% are vertebrate innovations. Our comparative analyses show that, among different tissues, the neural crest exhibits a particularly high rate of gene emergence during vertebrate evolution. A remarkable proportion of the new neural crest genes encode soluble ligands that control neural crest precursor specification into each cell lineage, including pigmented, neural, glial, and skeletal derivatives.
Conclusion: We propose that the evolution of the neural crest is linked not only to the recruitment of ancestral regulatory genes but also to the emergence of signaling peptides that control the increasingly complex lineage diversification of this plastic cell population.
Background
As first proposed by Gans and Northcutt [1,2], the major evo-lutionary innovation of the vertebrate body plan relies on elaboration of a new head at the anterior end of an ancestral
chordate trunk. The three existing groups of the phylum Chordata, namely urochordates (ascidians), cephalochor-dates (amphioxus), and craniates (including vertebrates and agnates), share many characteristics. These include a Published: 12 March 2007
Genome Biology 2007, 8:R36 (doi:10.1186/gb-2007-8-3-r36)
Received: 15 September 2006 Revised: 4 January 2007 Accepted: 12 March 2007 The electronic version of this article is the complete one and can be
notochord, segmented trunk muscles, and a dorsal nerve cord. Molecular data have further confirmed these anatomic descriptions, revealing a conserved patterning mechanism along the anterior-posterior and dorso-ventral axes of the neural tube [3]. Resting on this archetypal chordate body plan, unique populations of cells, the neural crest and the ectodermal placodes, evolved in craniates (referred to here as 'vertebrates' for simplicity). The emergence of these pluripo-tent cells is linked to the evolution of more sophisticated sen-sory and predatory organs (for instance, jaws). These new organs, in conjunction with an increasingly complex brain, allowed the shift from a filter-feeding style of life toward active predatory strategies [2,4].
The neural crest is a transient population of embryonic cells that originate at the boundary between neural plate and dor-sal ectoderm. Secreted from neighboring tissues, signaling molecules of the Wnt, Fgf, and Bmp families cooperate to activate a distinct combination of transcription factors at the neural plate border. Among those are members of the Pax, Zic, Snail, Sox, and Msx families, which constitute the neural crest specification network [5,6]. Shortly after their dorsal specification, neural crest cells undergo an epithelial-to-mes-enchymal transition, migrate, and finally, upon arrival at their destination, they give rise to a variety of cell types. These include peripheral neurons, glial and Schwann cells, pigment cells, endocrine cells, cartilage, and bone [7,8]. This large diversity of derivatives arises through a complex mechanism of lineage restriction, which operates both early, on the pluripotent precursors at the dorsal neural tube [9], and later, during the migration and differentiation of precursors already committed to different degrees [10,11]. Environmen-tal cues found throughout neural crest migratory routes play a fundamental role not only in instructing the precursor's dif-ferentiation into particular phenotypes, but also in control-ling their proliferation and survival [7]. Among these extracellular cues, classical signaling molecules such as Fgfs, Wnts, Bmps and transforming growth factor (TGF)-βs, in conjunction with locally produced cytokines such as neuro-tropins, endothelins, glial-derived neurotropic factor (GDNF), neuregulin and cKit, have been shown to influence precursor fate and survival [12,13].
The neural crest has traditionally been considered the key structure acquired very early by craniate pioneers. The pres-ence of cartilage first and biomineralized material later in the head of the earliest craniate fossils supports this view [14,15]. Because of their particular nature, the evolution of cartilage and bone elements can easily be traced in the large collection of Cambrian fossils. Many fossil fish exhibit neural crest derived exoskeletal coverings of dermal bone that extend par-tially over the trunk, with no trace of mesenchymal endoskel-eton [16]. These paleontologic records indicate that in early vertebrates cartilage and bones arose first in the context of the cephalic neural crest, and that only later was this genetic program co-opted by the para-axial sclerotome [17].
The existence of an ancestral population of cells in early chor-dates that give rise to vertebrate neural crest on the one hand and to basal chordate dorsal derivatives on the other has been proposed several times [2,18-20]. This hypothesis is sup-ported by the conservation of many components of the neural crest specification network in chordates [6]. Furthermore, migratory cells that express neural crest markers and differ-entiate as pigmented cells have recently been identified in the urochordate Ecteinascidia turbinate [21]. These data rein-force the hypothesis of pan-chordate 'precursors' behaving similarly and expressing a set of genes homologous to the modern neural crest. According to this view, the innovative drive impelling neural crest evolution stems from the evolu-tion of their cis-regulatory elements - a process facilitated by the ancestral duplication of the vertebrate genome. The dupli-cation of key developmental genes would have released enough evolutionary pressure to facilitate their divergence and hence the evolution of new functions [17]. Although the existence of pan-chordate 'precursors' offers a satisfactory answer to the evolutionary origin of the neural crest, it fails to account for the acquisition of fundamental properties of this tissue. These include the pluripotency of the neural crest pre-cursors that now give rise to novel cell types that are present neither in basal chordates nor in other metazoans.
comm
en
t
re
v
ie
w
s
re
ports
refer
e
e
d
re
sear
ch
de
p
o
si
te
d r
e
se
a
rch
interacti
o
ns
inf
o
rmation
simple cell population, in the dorsal neural tube of ancestral chordates, toward the lineage complexity of the vertebrate neural crest.
Results and discussion
How animal body plans are modified in relation to the evolu-tion of their genome is an intricate issue. Acquisievolu-tion of novel properties in a particular cell type, or even innovative changes in tissues and organs, can very often be attributed to modifi-cations in the wiring of pre-existing gene networks [24]. However, a fundamental process in genome evolution is also the emergence of new genes. Several molecular mechanisms, including exon shuffling, gene duplication and fusion, trans-position, fast sequence divergence, and entire de novo origin, have been proposed to serve as sources for gene innovation [25]. In this work we explore the phylogeny of the genes that are involved in neural crest development to gain insight into the evolution of neural crest properties. We aimed to deter-mine which components of the vertebrate neural crest gene program are ancient, and hence have been recruited to per-form a function in this tissue, and which components evolved only recently.
Determining the origin of vertebrate proteins through a sequential blast pipeline
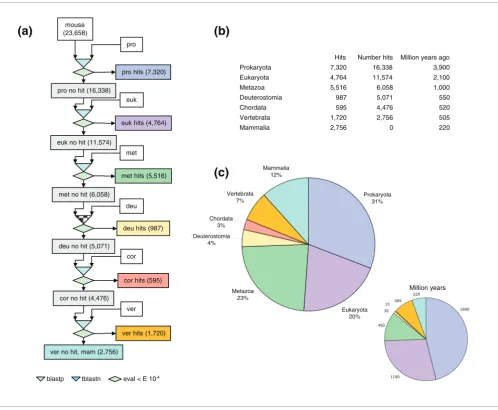
As a first step in determining when neural crest genes evolved, we filtered mouse proteins through a sequential blast pipeline. All 23,658 known mouse protein sequences (EnsEMBL v31) were consecutively blasted against available genomes grouped into seven different evolutionary categories (prokaryota, eukaryota, metazoa, deuterostomia, chordata, vertebrata, and mammalia) using a relaxed threshold of E = 10-4, as established in similar studies [26,27]. Proteins exhib-iting homology when blasted against the prokaryotic genomes were classified as ancient. The remaining genes were subsequently blasted against eukaryotic genomes and the procedure was repeated until all genes were classified (Figure 1a). According to our definition, 'new genes' in each category are those encoding proteins that did not exhibit any significant homology in previous categories, either because they have diverged extensively from a former protein or because they have evolved de novo.
A direct comparison of the percentage of genes appearing in each category with an estimation of their respective age in millions of years [28] indicated that the frequency of gene emergence is higher for late categories (specifically, metazo-ans to mammals; Figure 1b,c). This higher frequency of inno-vation correlates with the reported obserinno-vation that the rate of evolution for proteins (calculated as the ratio between non-synonymous and non-synonymous amino acid substitutions) is also higher for more recent categories [26].
To elucidate whether 'new proteins', because of their diver-gent amino acid sequences, correlate with the emergence of
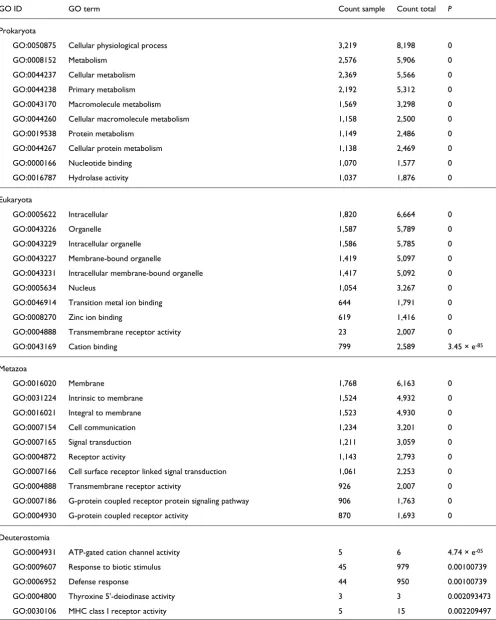
novel molecular functions, we performed a GO analysis [29]. For each evolutionary category we identified the GO terms that are statistically over-represented compared with all of the known mouse proteins. The 10 most significantly over-represented GO terms for each of the seven different catego-ries are listed in Table 1 (also see Additional data file 1 for a full list of over-represented GO terms). Our analysis shows that, within a large evolutionary window, innovations are associated with the emergence of 'new genes'. Although the first category, prokaryota, is enriched in genes that are involved in general cell metabolism, GO terms of genes appearing first in eukaryotes demonstrate their function in the newly evolved subcellular organelles. In metazoans we find the GO terms 'cell communication', 'signal transduction', and 'receptor activity' to be highly over-represented, which is in accordance with a de novo requirement for cell-cell com-munication and tissue subspecialization in the context of multicellularity. Interestingly, the collection of genes appear-ing first in vertebrates and mammals is enriched in terms such as 'hormone activity', 'receptor binding', 'extracellular space', and 'cytokine response', suggesting that diversifica-tion of receptor ligands is linked to vertebrate evoludiversifica-tion. In summary, our sequential blast pipeline reliably classifies genes according to their first appearance within the phyloge-netic tree.
Assignment of neural crest genes based on phenotypic data
In order to investigate when neural crest genes arose during evolution, it was necessary to build a comprehensive list of genes involved in the development of this tissue. A large number of studies, in particular the phenotypic analysis of mutations in mice, generated by either mutagenesis or genetic engineering, have led to the identification of many genes that are involved in neural crest development [7]. The Mammalian Phenotype Browser, at MGI [23], provides a comprehensive resource of phenotypic information derived from mouse mutant studies [22]. Because phenotypic analy-sis annotations offer the most reliable read out of gene func-tion, we took advantage of this large collection of mouse mutants in our study. The collection includes more than 14,000 genotype records associated with a total of 6,442 genes (27% of the total mouse transcriptome), and further-more it includes the majority of the genes demonstrated to play a bona fide role in neural crest development. In the MGI database each mutation is annotated by a controlled vocabu-lary of phenotypic terms that describe the effect of a genetic variation on different tissues, organs, or systems. We selected the Mammalian Phenotype Ontology for terms associated with mutations affecting both neural crest precursors and its derivative cell types and tissues.
included in this definition. However, when we took pheno-types associated with the development of neural crest deriva-tives into account, we retrieved a comprehensive list of 615 genes. In our analysis we considered three main groups of neural crest derivatives: pigmented cells, skeletal compo-nents, and elements of the peripheral nervous system. The 'pigmentation derivatives phenotype' is completely covered by a single term, namely 'pigmentation phenotype' (MP:0001186). The 'bone derivatives phenotype' terms con-sist of 'craniofacial phenotype' (MP:0005382) and 'skeleton phenotype' (MP:0005390). At this point, it could be argued that vertebrate neural crest cells only give rise to cranial skel-eton and teeth, whereas the axial skelskel-eton has a mesodermal origin. As already mentioned, however, paleontologic records indicate that skeletal elements evolved within the context of
the neural crest and only later was this genetic program co-opted by the sclerotome [17]. The 'peripheral nervous system derivatives phenotype' consists of 'abnormal autonomic nerv-ous system morphology' (MP:0002751), 'abnormal periph-eral nervous system glia' (MP:0001105), 'abnormal somatic sensory system morphology' (MP:0000959), and 'peripheral nervous system degeneration' (MP:0000958). We grouped these three categories under the general term 'neural crest derivatives phenotype'.
Determining the origin of the neural crest gene set: gene emergence rate plots
The sequential blast pipeline provides a list of genes that emerge along the evolutionary tree in each of the seven defined categories, whereas the phenotypic annotation
[image:4.612.58.556.85.495.2]Gene phylogeny was explored using a sequential blast pipeline
Figure 1
Gene phylogeny was explored using a sequential blast pipeline. (a) All known mouse proteins were sequentially blasted (cutoff value E = 10-4) against available databases and then classified according to their appearance into seven different categories: prokaryota (pro), eukaryota (euk), metazoa (met), deuterostomia (deu), chordata (cor), vertebrata (ver), and mammalia (mam). (b) The table shows the number of mouse genes assigned to each category compared with their estimated age in millions of years. (c) Graphical representation of the global gene phylogeny.
eval < E 10-4
(a)
(b)
(c)
blastp tblastn
mouse (23,658)
pro
met pro no hit (16,338)
pro hits (7,320)
euk
euk no hit (11,574)
euk hits (4,764)
met no hit (6,058)
met hits (5,516)
deu no hit (5,071)
deu hits (987)
cor
cor hits (595) deu
ver no hit, mam (2,756)
ver hits (1,720) ver cor no hit (4,476)
Hits Number hits Million years ago
Prokaryota 7,320 16,338 3,900
Eukaryota 4,764 11,574 2,100
Metazoa 5,516 6,058 1,000
Deuterostomia 987 5,071 550
Chordata 595 4,476 520
Vertebrata 1,720 2,756 505
Mammalia 2,756 0 220
Million years Prokaryota
31%
Eukaryota 20% Metazoa
23% Deuterostomia
4% Chordata
3% Vertebrata
7%
comm
en
t
re
v
ie
w
s
re
ports
refer
e
e
d
re
sear
ch
de
p
o
si
te
d r
e
se
a
rch
interacti
o
ns
inf
o
[image:5.612.56.552.124.744.2]rmation
Table 1
Frequency of GO terms for each group of 'new genes'
GO ID GO term Count sample Count total P
Prokaryota
GO:0050875 Cellular physiological process 3,219 8,198 0
GO:0008152 Metabolism 2,576 5,906 0
GO:0044237 Cellular metabolism 2,369 5,566 0
GO:0044238 Primary metabolism 2,192 5,312 0
GO:0043170 Macromolecule metabolism 1,569 3,298 0
GO:0044260 Cellular macromolecule metabolism 1,158 2,500 0
GO:0019538 Protein metabolism 1,149 2,486 0
GO:0044267 Cellular protein metabolism 1,138 2,469 0
GO:0000166 Nucleotide binding 1,070 1,577 0
GO:0016787 Hydrolase activity 1,037 1,876 0
Eukaryota
GO:0005622 Intracellular 1,820 6,664 0
GO:0043226 Organelle 1,587 5,789 0
GO:0043229 Intracellular organelle 1,586 5,785 0
GO:0043227 Membrane-bound organelle 1,419 5,097 0
GO:0043231 Intracellular membrane-bound organelle 1,417 5,092 0
GO:0005634 Nucleus 1,054 3,267 0
GO:0046914 Transition metal ion binding 644 1,791 0
GO:0008270 Zinc ion binding 619 1,416 0
GO:0004888 Transmembrane receptor activity 23 2,007 0
GO:0043169 Cation binding 799 2,589 3.45 × e-85
Metazoa
GO:0016020 Membrane 1,768 6,163 0
GO:0031224 Intrinsic to membrane 1,524 4,932 0
GO:0016021 Integral to membrane 1,523 4,930 0
GO:0007154 Cell communication 1,234 3,201 0
GO:0007165 Signal transduction 1,211 3,059 0
GO:0004872 Receptor activity 1,143 2,793 0
GO:0007166 Cell surface receptor linked signal transduction 1,061 2,253 0
GO:0004888 Transmembrane receptor activity 926 2,007 0
GO:0007186 G-protein coupled receptor protein signaling pathway 906 1,763 0
GO:0004930 G-protein coupled receptor activity 870 1,693 0
Deuterostomia
GO:0004931 ATP-gated cation channel activity 5 6 4.74 × e-05
GO:0009607 Response to biotic stimulus 45 979 0.00100739
GO:0006952 Defense response 44 950 0.00100739
GO:0004800 Thyroxine 5'-deiodinase activity 3 3 0.002093473
GO:0006955 Immune response 35 736 0.002495027
GO:0030178 Negative regulation of Wnt receptor signaling pathway 4 9 0.003585659
GO:0042981 Regulation of apoptosis 16 246 0.003971402
GO:0008430 Selenium binding 6 29 0.004113225
GO:0008517 Folic acid transporter activity 3 4 0.004113225
Chordata
GO:0005911 Intercellular junction 38 131 5.96 × e-33
GO:0005921 Gap junction 20 24 1.97 × e-29
GO:0030054 Cell junction 38 164 2.28 × e-29
GO:0005922 Connexon complex 17 18 2.57 × e-27
GO:0005243 Gap-junction forming channel activity 17 18 2.57 × e-27
GO:0015285 Connexon channel activity 17 18 2.57 × e-27
GO:0005923 Tight junction 17 60 2.44 × e-14
GO:0016327 Apicolateral plasma membrane 17 76 1.45 × e-12
GO:0043296 Apical junction complex 17 76 1.45 × e-12
GO:0005615 Extracellular space 74 2,021 7.43 × e-10
Vertebrata
GO:0005102 Receptor binding 130 507 0
GO:0016503 Pheromone receptor activity 59 111 0
GO:0005179 Hormone activity 53 115 0
GO:0042221 Response to chemical stimulus 90 329 9.81 × e-79
GO:0009628 Response to abiotic stimulus 92 414 2.94 × e-59
GO:0005615 Extracellular space 230 2,021 1.24 × e-45
GO:0005550 Pheromone binding 50 94 1.49 × e-38
GO:0005125 Cytokine activity 52 212 5.02 × e-38
GO:0005549 Odorant binding 50 99 3.45 × e-37
GO:0001664 G-protein-coupled receptor binding 36 47 3.23 × e-36
Mammalia
GO:0005615 Extracellular space 198 2,021 6.14 × e-53
GO:0005102 Receptor binding 80 507 1.79 × e-46
GO:0005125 Cytokine activity 48 212 1.79 × e-46
GO:0009607 Response to biotic stimulus 104 979 1.03 × e-30
GO:0006952 Defense response 102 950 1.03 × e-30
GO:0042742 Defense response to bacteria 34 70 2.51 × e-28
GO:0009617 Response to bacteria 34 78 2.22 × e-26
GO:0005126 Hematopoietin/interferon-class (D200-domain) cytokine receptor binding 20 33 6.10 × e-19
GO:0008083 Growth factor activity 26 141 2.98 × e-18
GO:0051707 Response to other organism 60 594 1.67 × e-15
[image:6.612.60.557.113.702.2]The table summarizes the 10 most statistically overrepresented Gene Ontology (GO) annotations for genes belonging to each of the seven categories. We only considered GO terms for which P > 0.001 and count sample was above 15.
Table 1 (Continued)
comm
en
t
re
v
ie
w
s
re
ports
refer
e
e
d
re
sear
ch
de
p
o
si
te
d r
e
se
a
rch
interacti
o
ns
inf
o
rmation
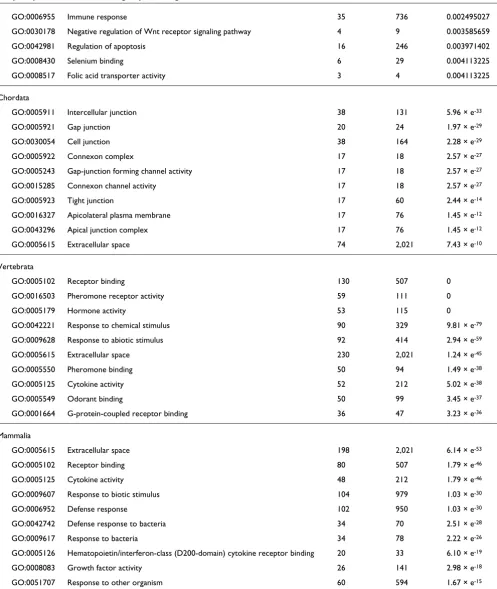
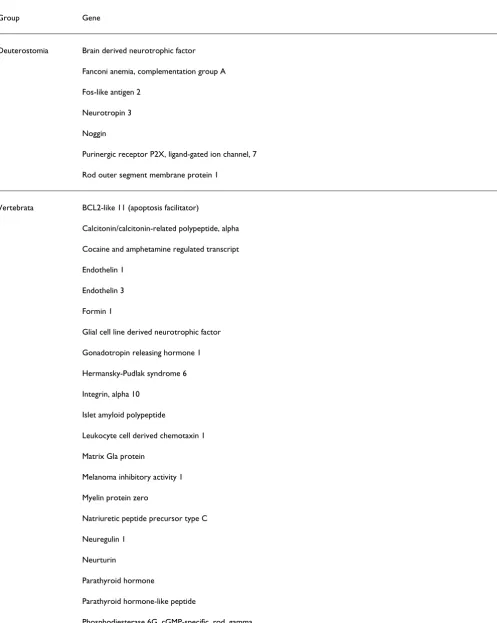
provides a functional link for each of these genes. Combining both, we determined in which category each of the 615 neural crest genes emerged (see Additional data file 2 for the full dataset). Previous studies had promoted the idea that gene co-option was the driving force for neural crest invention [6]. Our data strongly support this view because the majority (91%) of genes involved in neural crest development was already present in basal metazoans or even before. Thus, key transcription factors acting as both 'neural plate border spec-ifiers' (such as Pax3, Dlx5, Zic, and Msx1/2) and 'neural crest specifiers' (such as FoxD, Snail/Slug, Sox9/10, Twist, and AP-2) can be traced back to our category 'metazoans' or 'eukary-otes'. Similarly, the Fgf, Wnt, and Bmp signaling pathways involved in induction of the neural plate border are ancestral. Although their corresponding ligands can be traced back to basal metazoans, the kinase activity of their receptors was already present in prokaryotes. Altogether, these data con-firm the idea that gene recruitment played an important role during neural crest evolution.
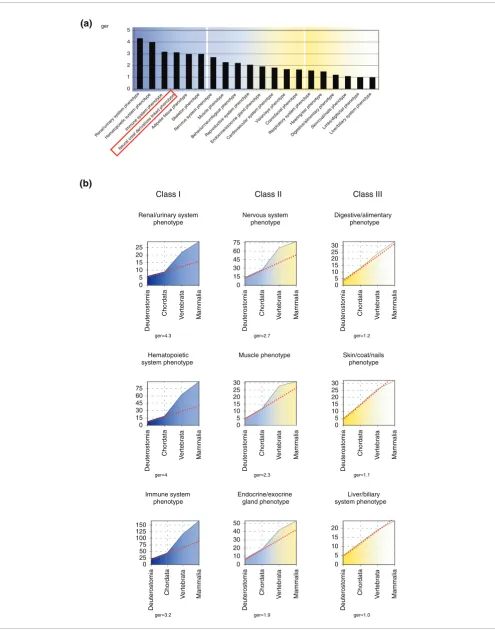
However, we found that a substantial percentage of the genes (9%, listed in Table 2) involved in neural crest development evolved in deuterostomes during the past 550 million years. To determine, within this evolutionary window, how the rate of gene emergence in the neural crest relates to the rate of innovation in other tissues, we plotted the cumulative number of genes appearing in each category. In these graphs, the tissue-specific evolutionary profile of gene emergence is depicted (Figure 2). In order to quantify the profile of the graphs we calculated 'gene emergence rate' (ger) values, as a numeric representation of the gene innovation rate from an earlier category to a later one (see Materials and methods for a description of the formula). A ger value of 1 indicates a con-stant profile of gene innovation. Higher ger values indicate increased appearance of new genes in a particular tissue.
For each of the tissue-specific gene programs studied, we ordered the ger values at the chordate-vertebrate transition (Figure 2a). Notably, tissues/systems ontogenetically derived from ventral mesoderm, and hence considered modern verte-brate innovations [2,17,30,31], such as the hematopoietic, immune, or renal/urinary system, exhibit graphs that peak at the chordate-vertebrate transition (Figure 2b). In contrast, other tissues already present in all chordates, namely the epi-dermis or endodermal derivatives such as liver, respiratory, and digestive systems, have a flat profile, with lower ger val-ues (Figure 2b). Both the profile of the neural crest gene emergence plot (Figure 3) and its ger value (3.1) indicate that the neural crest is among the most innovative vertebrate tis-sues (Figure 2a). This concept can be extended to each individual neural crest lineage, in particular to pigmented or bone derivatives, as deduced from their respective gene emer-gence plots (Figure 3). Interestingly, compared with the other crest derivatives, the ger value of the gene set associated with the peripheral nervous system derivatives is lower (1.6). This may best be explained by co-option from the ancestral
pro-gram of neural development. In summary, our gene emer-gence plots that reliably reflect evolutionary innovation highlight the novelty of neural crest as a tissue.
Emergence of neural crest molecules defining novel cellular functions
The notion of neural crest as a tissue with a high rate of gene innovation apparently contradicts our finding that all known neural crest specifiers can be traced back at least to metazo-ans. To further address this point, we focused on the collec-tion of neural crest 'new genes' to gain insight into their molecular nature and function.
Neural crest has been postulated as a fourth germ layer [32]. This concept builds on neural crest pluripotency and the fact that in vertebrates it gives rise to novel cell types such as the skeletal derivatives or the specialized melanocytes [11]. Con-sistently, in the collection of vertebrate/mammalian new genes, we found molecules defining the physiology of these novel cell types. This is the case for the genes Ru (Hermansky-Pudlak syndrome 6) and silver, which encode components of the specialized melanocyte lysosomes, the melanosomes. Similarly, several new genes encode extracellular proteins that constitute part of the bone matrix (for example, bone gla protein and the phosphoglycoprotein mepe) and enamel, the outermost covering of teeth and the hardest tissue in the body (for example, ameloblastin and amelogenin).
Emergence of ligands for neural crest lineage specification
Strikingly, 50% of neural crest genes appearing first in verte-brates encode extracellular ligands. This remarkable enrich-ment (confirmed by exploring GO term frequency; see Additional data file 3) is in accordance with our previous whole-transcriptome GO analysis (Table 1). It suggests that diversification of receptor ligands played an important role during vertebrate evolution in general and neural crest evolution in particular. Individual analysis of the function of these peptides during the development of the neural crest demonstrates that they control the commitment of precur-sors to the different lineages.
neuro-Table 2
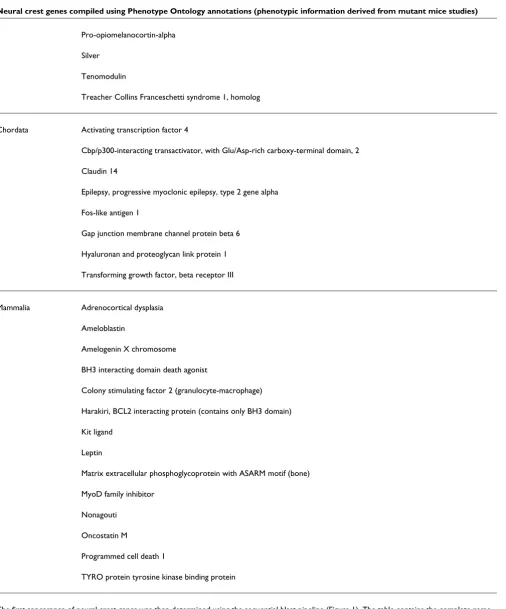
Neural crest genes compiled using Phenotype Ontology annotations (phenotypic information derived from mutant mice studies)
Group Gene
Deuterostomia Brain derived neurotrophic factor
Fanconi anemia, complementation group A
Fos-like antigen 2
Neurotropin 3
Noggin
Purinergic receptor P2X, ligand-gated ion channel, 7
Rod outer segment membrane protein 1
Vertebrata BCL2-like 11 (apoptosis facilitator)
Calcitonin/calcitonin-related polypeptide, alpha
Cocaine and amphetamine regulated transcript
Endothelin 1
Endothelin 3
Formin 1
Glial cell line derived neurotrophic factor
Gonadotropin releasing hormone 1
Hermansky-Pudlak syndrome 6
Integrin, alpha 10
Islet amyloid polypeptide
Leukocyte cell derived chemotaxin 1
Matrix Gla protein
Melanoma inhibitory activity 1
Myelin protein zero
Natriuretic peptide precursor type C
Neuregulin 1
Neurturin
Parathyroid hormone
Parathyroid hormone-like peptide
[image:8.612.60.557.118.741.2]comm
en
t
re
v
ie
w
s
re
ports
refer
e
e
d
re
sear
ch
de
p
o
si
te
d r
e
se
a
rch
interacti
o
ns
inf
o
rmation
Pro-opiomelanocortin-alpha
Silver
Tenomodulin
Treacher Collins Franceschetti syndrome 1, homolog
Chordata Activating transcription factor 4
Cbp/p300-interacting transactivator, with Glu/Asp-rich carboxy-terminal domain, 2
Claudin 14
Epilepsy, progressive myoclonic epilepsy, type 2 gene alpha
Fos-like antigen 1
Gap junction membrane channel protein beta 6
Hyaluronan and proteoglycan link protein 1
Transforming growth factor, beta receptor III
Mammalia Adrenocortical dysplasia
Ameloblastin
Amelogenin X chromosome
BH3 interacting domain death agonist
Colony stimulating factor 2 (granulocyte-macrophage)
Harakiri, BCL2 interacting protein (contains only BH3 domain)
Kit ligand
Leptin
Matrix extracellular phosphoglycoprotein with ASARM motif (bone)
MyoD family inhibitor
Nonagouti
Oncostatin M
Programmed cell death 1
TYRO protein tyrosine kinase binding protein
[image:9.612.58.564.98.707.2]The first appearance of neural crest genes was then determined using the sequential blast pipeline (Figure 1). The table contains the complete name of neural crest genes emerging in deuterostomia, chordata, vertebrata and mammalia.
Table 2 (Continued)
Figure 2 (see legend on next page)
(a)
(b)
Class I Class II Class III
Renal/urinary system phenotype
0 5 10 15 20 25
Deuterostomia
Chordata
V
ertebrata Mammalia
Nervous system phenotype
0 15 30 45 60 75
Deuterostomia
Chordata
V
ertebrata Mammalia
Digestive/alimentary phenotype
0 5 10 15 20 25 30
Deuterostomia
Chordata
V
ertebrata Mammalia
Skin/coat/nails phenotype
0 5 10 15 20 25 30
Deuterostomia
Chordata Vertebrata Mammalia
Muscle phenotype
0 5 10 15 20 25 30
Deuterostomia
Chordata Vertebrata Mammalia
Hematopoietic system phenotype
0 15 30 45 60 75
Deuterostomia
Chordata Vertebrata Mammalia
Immune system phenotype
0 25 50 75 100 125 150
Deuterostomia
Chordata
V
ertebrata Mammalia
Endocrine/exocrine gland phenotype
0 10 20 30 40 50
Deuterostomia
Chordata
V
ertebrata Mammalia
Liver/biliary system phenotype
0 5 10 15 20
Deuterostomia
Chordata
V
ertebrata Mammalia
ger=4.3 ger=2.7 ger=1.2
ger=4 ger=2.3 ger=1.1
ger=3.2 ger=1.9 ger=1.0 ger
0 1 2 3 4 5
Renal/urinary system phenotyp e
Hematopoietic syste m phenotype
Immune system phe notype
Neural crest derivatives linked phenotype Adipose tissue phenotype
Skeleton phenotype Nervous system phenotype
Muscle phenotype
Behavior/neurological phenotyp e
Reproductive system phenotyp e
Endocrine/exocrine gland phenotypeCardiovascular system phenotype Vision/eye phe
notype
Craniofacial phenotype Respiratory system phenotyp
e
Hearing/ear phenotype Digestive/alime
ntary phenotype Skin/coat/nails phenotypeLimbs/digits/tail phenotyp
e
comm
en
t
re
v
ie
w
s
re
ports
refer
e
e
d
re
sear
ch
de
p
o
si
te
d r
e
se
a
rch
interacti
o
ns
inf
o
rmation
thropins (brain-derived neurotropic factor, neurothropin-3, and neurothropin-4) and GDNF family members (GDNF and neurturin) [39,40]; and, finally, the differentiation of the skeletal lineage is specified by endothelin-1 [41]. Our sequen-tial blast pipeline analysis shows that the vast majority (9/11) of the above-mentioned cell fate specification ligands emerged in vertebrates or, to a lesser extent (steel factor and nonagouti), in mammals.
Interestingly, the blast pipeline uncovered a positive hit in the echinoderm Strongylocentrotus purpuratus genome for the neurotropin family members brain-derived neurotropic fac-tor and neurothropin-3. Because it has been proposed that neurotropins constitute a vertebrate innovation [42], we per-formed a ClustalX alignment [43] of mouse neurotropins against the echinoderm sequence (Additional data file 4). This revealed that the particular array of cysteines conserved in all neurotropins, the so-called 'cysteine knot' [44], is also present in the echinoderm sequence and therefore identifies it as a putative growth factor. However, the limited amino acid identity (33%) and the lack of conservation in critical residues required for neu-rotropin binding to Trk receptors indicate that the echinoderm neurotropin-related protein cannot be considered a bona fide neurotropin. This suggests that neurotropins evolved from divergent ligands present in ancestral chordates. In fact, the example of neurotropins may be just part of a more general
mechanism because other 'new cytokines' can be related to pre-existing growth factors. Supporting this view, GDNF and neur-turin are divergent members of the TGF-b superfamily of lig-ands, as indicated by their particular cysteine knot and hence folding [44]. Similarly, despite their limited homology, neuregu-lins belong to the epidermal growth factor superfamily of ligands [45].
Taken together, our data show that the cytokine network act-ing in neural crest cell fate specification is mainly a vertebrate innovation (Figure 4). Furthermore, these analyses indicate that an important proportion of the 'new ligands' are derived from fast evolving growth factors.
Phylogenetic analysis of the emergence of Pfam domains
The comparative analysis of gene emergence plots highlights a high rate of gene innovation for the neural crest during ver-tebrate evolution. In fact, there are reasons to believe that our estimation on the rate of gene emergence may be conserva-tive. In the sequential blast pipeline analysis, the presence of an ancestral conserved domain will shadow the appearance of evolutionarily more recent domains within the same mole-cule. This may be particularly relevant in the case of large multidomain proteins such as receptors.
Tissue-specific profiles of gene emergence
Figure 2 (see previous page)
Tissue-specific profiles of gene emergence. The accumulative number of emerging genes (y-axis) in the deuterostomia-mammalia evolutionary window (x-axis) is represented for different tissue-specific genetic programs. We termed these representations gene emergence plots. At the chordate-vertebrate transition the rate of gene emergence (ger) was estimated for the different genetic programs. (a) Using mouse phenotypic annotations we calculated ger values between chordata and vertebrata for each main phenotype structure in the database. Structures are highlighted from blue to yellow, according to decreasing values of ger. Neural crest derivative structures are present within the highest ger values (red box). (b) Plots of representative structures of each class of ger value: class I = ger > 3; class II = 3 > ger > 1.5; and class III: ger < 1.5.
[image:11.612.52.556.503.689.2]Gene emergence plots of neural crest derivatives
Figure 3
Gene emergence plots of neural crest derivatives. Graphs and gene emergence rate (ger) values associated both with (a) the total collection of neural crest genes and (b) the different bone, nervous system, and pigmentation derivatives.
(a)
(b)
Pigmentationderivatives
0 2 4 6 8
Deuterostomia
Chordata Vertebrata
Mammalia
ger=unassigned Bone derivatives
0 5 10 15 20 25 30
Deuterostomia
Chordata Vertebrata
Mammalia
ger=3.0
Nervous system derivatives
0 5 10 15
Deuterostomia
Chordata Vertebrata
Mammalia
ger=1.5 Neural crest
derivatives
0 10 20 30 40 50
Deuterostomia
Chordata Vertebrata
Mammalia
To overcome this constraint and to complement our studies, we conducted a phylogenetic analysis of the Pfam motifs (defined by multiple alignment of proteins [46]) occurring in the collection of 615 neural crest genes. From a total of 8,183 Pfam domains annotated in EnsEMBL, 499 are present in the set of 615 neural crest genes. We screened for these motifs in the seven different categories, detecting homology through two different approaches: blasting Pfam consensus sequences
(threshold of E = 10-4) and searching for hidden Markov mod-els (HMMs) using HMMER software with standard parame-ters [46]. We compiled a table including all neural crest genes with their Pfam domains and when they occur first in the defined seven temporal classes, as detected using either of the methods (Additional data file 5). A list including only those genes that contain a Pfam domain emerging in vertebrates is compiled in Table 3. Pfam domain detection supports and
[image:12.612.58.556.87.569.2]Emerging ligands control the specification of neural crest precursors
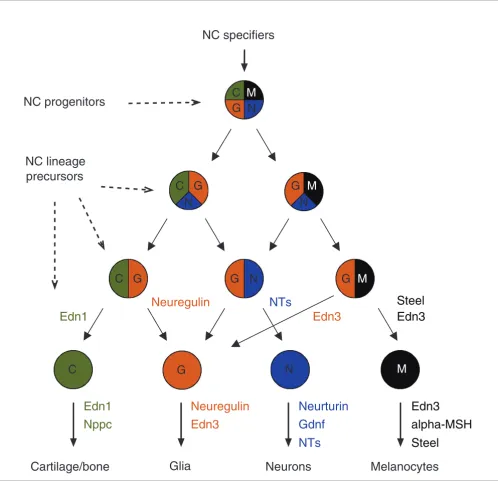
Figure 4
Emerging ligands control the specification of neural crest precursors. The progressive determination of neural crest (NC) precursors into different cell lineages is represented in the scheme with a code of colors. Superimposed on this, the collection of new growth factors appearing first in vertebrates is depicted. The role of each ligand in controlling the specification/survival of each particular neural crest derivative is indicated with a corresponding code of colors. alpha-MSH, alpha-melanocyte-stimulating hormone; End, endothelin; GDNF, glial-derived neurotropic factor; NT, neurotropin; Nppc, natriuretic peptide precursor.
C
C
C
C
G
G
G
G
G
G N
N
N
N
N
M
M
M
M
G
Edn3
Edn3
Cartilage/bone
Glia
Neurons
Melanocytes
Steel
Steel
alpha-MSH
NTs
NTs
Neuregulin
Neuregulin
Neurturin
Gdnf
Edn1
Edn1
NC progenitors
NC lineage
precursors
Edn3
NC specifiers
Edn3
comm
en
t
re
v
ie
w
s
re
ports
refer
e
e
d
re
sear
ch
de
p
o
si
te
d r
e
se
a
rch
interacti
o
ns
inf
o
[image:13.612.56.557.139.703.2]rmation
Table 3
Neural crest associated Pfam domains emerging in vertebrates
Group
Symbol Gene blast pro euk met deu chr ver mam
Slc12a6 Solute carrier family 12, member 6 pro AA_permease - - - - KCl_Cotrans_1
-Apc Adenomatosis polyposis coli pro - Arm APC_crr APC_15aa - - EB1_binding
APC_basic SAMP
-Asph Aspartate-beta-hydroxylase pro Asp_Arg_Hydrox - - - - Asp-B-Hydro_N
-Top2b Topoisomerase (DNA) II beta pro DNA_topoisoIV
DNA_gyraseB HATPase_c - - - - DTHCT
-Nef3 Neurofilament 3, medium pro - - Filament - - Filament_head
-Nefl Neurofilament, light polypeptide pro - - Filament - - Filament_head
-Cryab Crystallin, alpha B pro HSP20 - - - - Crystallin
-Rabggta Rab geranylgeranyl transferase, a subunit pro LRR_1 LRR_2 PPTA - - - RabGGT_insert
-Otx1 Orthodenticle homolog 1 euk - Homeobox - - - TF_Otx
-Otx2 Orthodenticle homolog 2 euk - Homeobox - - - TF_Otx
-Zfp98 Zinc finger protein 98 euk zf-C2H2 - - - - SCAN
-Prph1 Peripherin 1 met - - Filament - - Filament_head
-Gfra1 Glial cell line derived neurotrophic factor
family receptor alpha 1 met - - - GDNF
-Cdx1 Caudal type homeo box 1 met - Homeobox - - - Caudal_act
-Cdx2 Caudal type homeo box 2 met - Homeobox - - - Caudal_act
-Hoxb9 Homeo box B9 met - Homeobox - - - Hox9_act
-Hoxa9 Homeo box A9 met - Homeobox - - - Hox9_act
-Nr3c1 Nuclear receptor subfamily 3, group C,
member 1
met - - Hormone_recep zf-C4 - - GCR
-Pdgfa Platelet derived growth factor, alpha met - - PDGF - - PDGF_N
-Bdnf Brain derived neurotrophic factor deu - - - NGF
-Ntf3 Neurotropin 3 deu - - - NGF
-P2rx7 Purinergic receptor P2X, ligand-gated ion
channel, 7
deu - - - P2X_receptor
-Hapln1 Hyaluronan and proteoglycan link protein
1
cor - - V-set - - Xlink
-Nppc Natriuretic peptide precursor type C ver - - - ANP
-Calca Calcitonin/calcitonin-related polypeptide,
alpha ver - - - Calc_CGRP_IAPP
-Iapp Islet amyloid polypeptide ver - - - Calc_CGRP_IAPP
-Cart Cocaine and amphetamine regulated
transcript ver - - - CART
-Edn1 Endothelin 1 ver - - - Endothelin
-Edn3 Endothelin 3 ver - - - Endothelin
-Nrg1 Neuregulin 1 ver I-set EGF ig V-set - - Neuregulin
-Pomc1 Pro-opiomelanocortin-alpha ver - - - Op_neuropeptide
ACTH_domain
-Pthlh Parathyroid hormone-like peptide ver - - - Parathyroid
-Pth Parathyroid hormone ver - - - Parathyroid
-Pde6g Phosphodiesterase 6G, cGMP-specific,
rod, gamma
ver - - - PDE6_gamma
-a Nonagouti mam - - - Agouti
-Osm Oncostatin M mam - - - LIF_OSM
-Kitl Kit ligand mam - - - SCF
refines our sequential blast pipeline results. Thus, GDNF and neurturin were identified as divergent members of the TGF-β superfamily, and the kit-ligand and nonagouti domains were detected as vertebrate novelties (previously detected as mam-malian innovations; Table 2). Furthermore, the analysis also confirmed the ClustalX alignments demonstrating that the neurotropin domain (nerve growth factor; Table 3) is indeed a vertebrate innovation. In summary, our domain-based approach (more sensitive and accurate, but limited to anno-tated Pfam domains) complements the sequential blast anal-ysis (Table 2), providing independent confirmation of the emergence in vertebrates of growth factors that are involved in the specification/survival of the neural crest cells (Table 3).
In addition, the domain-based approach also detected 'new Pfam motifs' masked in the sequential blast pipeline studies by the presence of an ancient domain. An example is the appearance in vertebrates of regulatory domains, such as TF_Otx, caudal_act, and Hox9_act, which are present in homeobox-containing transcription factors that belong to the Otx, Cdx, and Hox9 families, respectively (Table 3). We have shown that half of the neural crest genes appearing first in vertebrates encode extracellular ligands. This is contrasted by the Pfam domain analysis of the corresponding receptors. Only a single domain in ligand receptors is identified as a ver-tebrate novelty, namely the GDNF domain, which is present in the GDNF and neurturin coreceptor termed GFRalpha-1. This observation suggests that receptor evolution requires only subtle changes (in the sequence of their extracellular domains) to allow interaction with the 'new ligands', changes that are too subtle to be detected as discrete 'new domains' in our analysis.
Final remarks: toward a comprehensive hypothesis on neural crest evolution
Our understanding of how developmental regulatory path-ways evolved in metazoans is now building upon steadily accumulating sequence collections that cover representative taxonomic groups. Here we have developed and applied a bio-informatics approach that allows us first to define compo-nents of the neural crest developmental gene program and then to analyze their phylogeny. Our evolutionary study, as for others based on comparative genomics, is limited by the quality of the available resources. The validity of the conclu-sions, beyond individual evolutionary relationships among genes, arise from the global picture provided by the proper-ties of large datasets in which no systematic bias has been introduced. In our study we have considered several potential sources of bias. An important limitation in comparative studies is the arbitrary definition of the components of a par-ticular gene network or gene program. Often this definition is directly inferred from the literature [23]. To avoid this, the phenotypic analysis of mutants offers the most reliable read out of gene function, and at the same time it provides an unbi-ased definition. The fact that 'less conspicuous' phenotypic features, such as phenotypes associated with the immune or
hematopoietic system, are as well annotated as the more obvi-ous ones in pigmentation or skin indicates that there is no global bias in our analysis toward the detection of a given phe-notype. Another possible caveat when interpreting studies of this type may come from massive gene loss in sister phyla, which will result in the false impression of new genes emerg-ing in the phylum considered. These losses are particularly apparent in protostomia [47]. In our analysis, focused on deu-terostomia groups, these effects are well buffered by filtering the data not only through tunicates but also through echino-derm and cephalochordate sequences. The fact that it is highly unlikely that the same gene is independently lost in all three phylogenetic branches levels potential bias through gene loss and gives robustness to our approach.
Our data show that new genes, either resulting from gene divergence or de novo gene evolution, are linked to the appearance of novel molecular and cellular functions. Comparative study of different tissues shows the highest gene emergence rates for those tissues considered vertebrate inno-vations, such as neural crest and ventral mesoderm deriva-tives [17]. For the neural crest gene program, we show that half of the genes appearing first in vertebrates encode growth factors with a reported role in committing precursor fate (Figure 4). Our whole-genome analysis also shows that GO terms such as 'hormone activity', 'receptor binding', 'extracel-lular space', and 'cytokine response' are highly enriched in the collection of genes that emerge in vertebrates. Therefore, the expansion of the ligand toolkit during evolution does not appear to be limited to the neural crest. Rather, it also occurred in other vertebrate-specific tissues, which evolved from ancestral chordates. Examples of this are the vertebrate-specific interleukins and hematopoietic cytokines that control fate, maturation, and survival of the complex lymphoid and blood cell lineages. Taken together, our data indicate that the appearance of new growth factors satisfied an evolutionary requirement for signal diversification, beyond the ancestral network of signaling peptides.
comm
en
t
re
v
ie
w
s
re
ports
refer
e
e
d
re
sear
ch
de
p
o
si
te
d r
e
se
a
rch
interacti
o
ns
inf
o
rmation
Previous theories on neural crest evolution have mainly focused on the ontogenetic and phylogenetic origin of the tis-sue from the dorsal area of the ancestral chordate neural tube. Along these lines, the rewiring of the genes involved in the neural crest specification network has been invoked as the main evolutionary driving force [6]. Our data now expand this view by suggesting that new signaling molecules were required to control further the development of the neural crest into its different derivatives, which are essential compo-nents of the actual vertebrate body plan.
Materials and methods
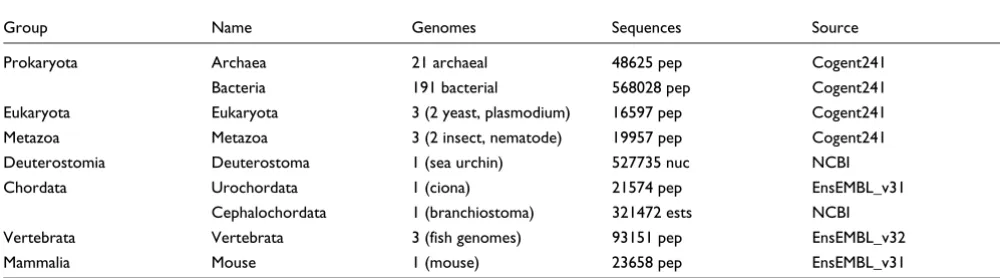
Blast searches and assignment of temporal categories To estimate the emergence of mammalian genes we analyzed the set of all 23658 known mouse protein sequences from EnsEMBL v31. We identified any gene product related to the mouse reference sequences in 225 different genomes by using blast [48]. A complete list of genomes and their origin is given in supplementary information (Additional data file 6). Genomes were downloaded from Cogent, EnsEMBL, and NCBI. These genomes were grouped into seven temporal cat-egories based on their evolutionary origin (Table 4).
The first appearance of mouse proteins during evolution was assessed through a sequential blast pipeline using a relaxed cutoff value (E = 10-4) and standard parameters (blastp for protein and tblastn for nucleotide databases) to detect homology in more distant species [26,27]. We assigned each of the 23,658 mouse proteins to one of the seven evolutionary categories according to when their first hit occurred (in which taxonomic group). Genes already assigned to a temporal cat-egory were excluded from further blast analysis. The remain-ing genes were then subsequently blasted against the following genomes until eventually all mouse genes were classified.
To account for any possible effect due to mouse-specific gene loss biasing our analysis, we performed the following control. In addition to using the mouse gene set as an input for the
sequential blast pipeline, we also launched the filtering proc-ess using other vertebrate groups, namely chicken, xenopus, and zebrafish genomes. Independent of the input used, we observed a similar distribution of genes in the various evolu-tionary categories (Additional data file 7). This finding indi-cates that there is no evident specific gene loss in the mouse. This necessary control further corroborates the choice of the mouse genome as a representative vertebrate.
Gene Ontology analysis
We looked for GO terms that were statistically over-repre-sented in our temporal categories. Each of these gene sets was compared with the whole set of GO annotated mouse genes. We used mouse MGI GO annotation available at the GoStat web server [49] for this analysis [29]. GoStat compares the occurrence of each GO term for each different temporal cate-gory and for the reference genes, and performs a Fisher's exact test to judge whether the observed difference is signifi-cant. A complete list of all over-represented and under-repre-sented GO annotations is provided in Additional data file 1.
Retrieving phenotype annotations
[image:15.612.53.553.118.257.2]The list of genes described by phenotype ontology was obtained from the MGI report (3.22 release): MRK_Pheno_Ensembl.rpt [50]. This table represents the MGI marker associations with Phenotype Annotations and EnsEMBL sequence. The main phenotypical categories stored in the Mammalian Phenotype Ontology are the follow-ing: adipose tissue phenotype (MP:0005375), behavior/neu-rologic phenotype (MP:0005386), cardiovascular system phenotype (MP:0005385), craniofacial phenotype (MP:0005382), digestive/alimentary phenotype (MP:0005381), endocrine/exocrine gland phenotype (MP:0005379), hearing/ear phenotype (MP:0005377), hematopoietic system phenotype (MP:0005397), immune system phenotype (MP:0005387), limbs/digits/tail pheno-type (MP:0005371), liver/biliary system phenopheno-type (MP:0005370), muscle phenotype (MP:0005369), nervous system phenotype (MP:0003631), pigmentation phenotype (MP:0001186), renal/urinary system phenotype Table 4
Temporal categories of downloaded genomes
Group Name Genomes Sequences Source
Prokaryota Archaea 21 archaeal 48625 pep Cogent241
Bacteria 191 bacterial 568028 pep Cogent241
Eukaryota Eukaryota 3 (2 yeast, plasmodium) 16597 pep Cogent241
Metazoa Metazoa 3 (2 insect, nematode) 19957 pep Cogent241
Deuterostomia Deuterostoma 1 (sea urchin) 527735 nuc NCBI
Chordata Urochordata 1 (ciona) 21574 pep EnsEMBL_v31
Cephalochordata 1 (branchiostoma) 321472 ests NCBI
Vertebrata Vertebrata 3 (fish genomes) 93151 pep EnsEMBL_v32
Mammalia Mouse 1 (mouse) 23658 pep EnsEMBL_v31
(MP:0005367), reproductive system phenotype (MP:0005389), respiratory system phenotype (MP:0005388), skeleton phenotype (MP:0005390), skin/ coat/nails phenotype (MP:0005393), and vision/eye pheno-type (MP:0005391).
Gene emergence rate calculation
In order to quantify the relative change in the number of 'new genes' arising at a given temporal category, we define the gene emergence rate (ger) as the ratio between the number of genes emerging in the analyzed temporal category (verte-brates in our case) and the number of genes emerging in the previous temporal category (chordates in our case). Thus, for the transition from chordates to vertebrates, the ger value is defined as follows:
Where Ndeu is the cumulative number of 'new genes' at the level of deuterostomes, Ncho is the cumulative number of novel genes at the level of chordates, and Nver is the cumula-tive number of 'new genes' at the level of vertebrates.
Assignment of Pfam domains to temporal categories through HMM and blast searches
To derive a more detailed view of the evolution of proteins involved in neural crest development, we examined when the protein domains found in the list of neural crest genes are first detectable in our temporal categories. First, we down-loaded the Pfam annotations for the identified 615 neural crest genes from EnsEMBL (version 32). Of the total of 8183 Pfam domains, 499 are present (annotated in EnsEMBL) in the set of 615 genes. We downloaded consensus sequences and HMMs for these domains from Pfam (version 19.0) [51].
Pfam domains were searched in the temporal category data-bases using two methods: blasting the Pfam consensus sequence with an E value threshold of 10-4 and searching HMM using HMMER software [52] applying standard parameters. In general, the HMM search was more sensitive and able to detect a domain earlier than the Pfam consensus blast analysis. For the expressed sequence tag databases, we used only the blast search. A full table, including all neural crest genes with their Pfam domains and their appearance as detected by either of the methods, was compiled (Additional data file 5).
Additional data files
The following additional data are available with the online version of this paper. Additional data file 1 is a table including a full list of statistically over-represented GO annotations of genes belonging to each of the seven categories (cutoff P < 0.001, sample count ≥ 15). Additional data file 2 is a table list-ing the 615 neural crest genes compiled uslist-ing Phenotype
Ontology annotations for each of the seven temporal catego-ries considered in this work. Additional data file 3 is a table showing statistically over-represented GO annotations of the set of neural crest developmental genes that emerged in ver-tebrates (cutoff P < 0.001). Additional data file 4 shows Clus-talX alignment of mouse neurotropins against the echinoderm peptide. Additional data file 5 shows phyloge-netic analysis of neural crest Pfam domains emergence through evolution. Additional data file 6 provides a complete list of genomes of species included in this work and their respective sources. Additional data file 7 sequential blast analysis using other vertebrate groups as a control for the gene phylogeny analysis.
Additional data file 1
Table including a full list of statistically over-represented GO anno-tations of genes belonging to each of the seven categories
The table includes a full list of the statistically over-represented GO annotations of genes belonging to each of the seven categories (cut-off P < 0.001, sample count = 15).
Click here for file Additional data file 2
Table listing the 615 neural crest genes compiled using Phenotype Ontology annotations for each of the seven temporal categories considered in this work
The table comprises a full list of the 615 neural crest genes compiled using Phenotype Ontology annotations for each of the seven tem-poral categories considered in this work: prokaryota (pro), eukary-ota (euk), metazoa (met), deuterostomia (deu), chordata (cor), vertebrata (ver), and mammalia (mam).
Click here for file Additional data file 3
Table showing statistically over-represented GO annotations of the set of neural crest developmental genes that emerged in vertebrates The table shows statistically over-represented GO annotations of the set of neural crest developmental genes that emerged in verte-brates (cutoff P < 0.001).
Click here for file Additional data file 4
ClustalX alignment of mouse neurotropins against the echinoderm peptide
ClustalX alignment of mouse neurotropins against the echinoderm peptide. The comparison reveals a limited amino acid identity. Click here for file
Additional data file 5
Phylogenetic analysis of neural crest Pfam domains emergence through evolution
Phylogenetic analysis of neural crest Pfam domains emergence through evolution. The table shows a full list of the compiled 615 genes involved in neural crest development and the first appear-ance of their Pfam domains in the different clades. All the corre-sponding Pfam domains of these genes, when these domains have appeared, and the classification of the genes according to our pre-vious sequential blast analysis (blast; color-coded) are indicated. Click here for file
Additional data file 6
Complete list of genomes of species included in this work and their respective sources
A complete list of genomes of species included in this work and their respective source is compiled in this table. Abbreviations: arc (archaeobacteria), bac (bacteria), euk (eukaryota), met (metazoa), deu (deuterostomia), cor (chordata), ver (vertebrata).
Click here for file Additional data file 7
Sequential blast analysis using other vertebrate groups as a control for the gene phylogeny analysis
As a control of our gene phylogeny analysis, we also run the sequen-tial blast pipeline using other vertebrate groups, namely (chicken, xenopus and zebrafish genomes). The tables show the number or percentage of genes assigned to each evolutionary category. The graphical representation of the gene phylogeny for the four verte-brate species analyzed revealed a very similar gene loss/emergence profile.
Click here for file
Acknowledgements
We are thankful to Miguel Manzanares and David Torrents for their encouraging comments on this work. We are extremely grateful to Kath-erine Brown, Laurence Ettwiller, and Felix Loosli for comments and critical reading of the manuscript. J-RM-M received a Marie Curie Fellowship. This study was supported by grants from the European Union (Strep Hygeia) and the German Research Foundation, Collaborative Research Centre 488.
References
1. Gans C, Northcutt RG: Neural crest and the origin of vertebrates: a new head. Science 1983, 220:268-272.
2. Northcutt RG, Gans C: The genesis of neural crest and epider-mal placodes: a reinterpretation of vertebrate origins. Q Rev Biol 1983, 58:1-28.
3. Wada H, Satoh N: Patterning the protochordate neural tube. Curr Opin Neurobiol 2001, 11:16-21.
4. Manzanares M, Nieto MA: A celebration of the new head and an evaluation of the new mouth. Nuron 2003, 37:895-898. 5. LaBonne C, Bronner-Fraser M: Molecular mechanisms of neural
crest formation. Annu Rev Cell Dev Biol 1999, 15:81-112. 6. Meulemans D, Bronner-Fraser M: Gene-regulatory interactions
in neural crest evolution and development. Dev Cell 2004, 7:291-299.
7. LeDouarin N, Kalheim C: The Neural Crest New York: Cambridge University Press; 1999.
8. Morales AV, Barbas JA, Nieto MA: How to become neural crest: from segregation to delamination. Semin Cell Dev Biol 2005, 16:655-662.
9. Bronner-Fraser M, Fraser SE: Cell lineage analysis reveals multipotency of some avian neural crest cells. Nature 1988, 335:161-164.
10. Fraser SE, Bronner-Fraser M: Migrating neural crest cells in the trunk of the avian embryo are multipotent. Development 1991, 112:913-920.
11. Le Douarin NM, Dupin E: Cell lineage analysis in neural crest ontogeny. J Neurobiol 1993, 24:146-161.
12. Le Douarin NM, Dupin E: Multipotentiality of the neural crest. Curr Opin Genet Dev 2003, 13:529-536.
13. Dorsky RI, Moon RT, Raible DW: Environmental signals and cell fate specification in premigratory neural crest. Bioessays 2000, 22:708-716.
14. Holland LZ, Holland ND: Evolution of neural crest and pla-codes: amphioxus as a model for the ancestral vertebrate? J Anat 2001, 199:85-98.
15. Mallatt J, Chen JY: Fossil sister group of craniates: predicted and found. J Morphol 2003, 258:1-31.
16. Donoghue PC, Sansom IJ: Origin and early evolution of verte-brate skeletonization. Microsc Res Tech 2002, 59:352-372. 17. Shimeld SM, Holland PW: Vertebrate innovations. Proc Natl Acad
Sci USA 2000, 97:4449-4452.
18. Baker CV, Bronner-Fraser M: The origins of the neural crest. Part II: an evolutionary perspective. Mech Dev 1997, 69:13-29. 19. Wada H: Origin and evolution of the neural crest: a hypothet-ical reconstruction of its evolutionary history. Dev Growth
ger N N
N N
cho ver ver cor
cor deu
comm
en
t
re
v
ie
w
s
re
ports
refer
e
e
d
re
sear
ch
de
p
o
si
te
d r
e
se
a
rch
interacti
o
ns
inf
o
rmation
Differ 2001, 43:509-520.
20. Stone JR, Hall BK: Latent homologues for the neural crest as an evolutionary novelty. Evol Dev 2004, 6:123-129.
21. Jeffery WR, Strickler AG, Yamamoto Y: Migratory neural crest-like cells form body pigmentation in a urochordate embryo. Nature 2004, 431:696-699.
22. Smith CL, Goldsmith CA, Eppig JT: The Mammalian Phenotype Ontology as a tool for annotating, analyzing and comparing phenotypic information. Genome Biol 2005, 6:R7.
23. Mouse Genome Informatics 2005 [http://www.informat ics.jax.org].
24. Davidson EH, Erwin DH: Gene regulatory networks and the evolution of animal body plans. Science 2006, 311:796-800. 25. Long M, Deutsch M, Wang W, Betran E, Brunet FG, Zhang J: Origin
of new genes: evidence from experimental and computa-tional analyses. Genetica 2003, 118:171-182.
26. Alba MM, Castresana J: Inverse relationship between evolution-ary rate and age of mammalian genes. Mol Biol Evol 2005, 22:598-606.
27. Waterston RH, Lindblad-Toh K, Birney E, Rogers J, Abril JF, Agarwal P, Agarwala R, Ainscough R, Alexandersson M, An P, et al.: Initial sequencing and comparative analysis of the mouse genome. Nature 2002, 420:520-562.
28. Benton MJ, Ayala FJ: Dating the tree of life. Science 2003, 300:1698-1700.
29. Beissbarth T, Speed TP: GOstat: find statistically overrepre-sented Gene Ontologies within a group of genes. Bioinformatics 2004, 20:1464-1465.
30. Dehal P, Satou Y, Campbell RK, Chapman J, Degnan B, De Tomaso A, Davidson B, Di Gregorio A, Gelpke M, Goodstein DM, et al.: The draft genome of Ciona intestinalis : insights into chordate and vertebrate origins. Science 2002, 298:2157-2167.
31. Hoang T: The origin of hematopoietic cell type diversity. Oncogene 2004, 23:7188-7198.
32. Hall BK: The neural crest as a fourth germ layer and verte-brates as quadroblastic not triploblastic. Evol Dev 2000, 2:3-5. 33. Shah NM, Groves AK, Anderson DJ: Alternative neural crest cell fates are instructively promoted by TGFbeta superfamily members. Cell 1996, 85:331-343.
34. White PM, Morrison SJ, Orimoto K, Kubu CJ, Verdi JM, Anderson DJ: Neural crest stem cells undergo cell-intrinsic developmental changes in sensitivity to instructive differentiation signals. Neuron 2001, 29:57-71.
35. Dorsky RI, Moon RT, Raible DW: Control of neural crest cell fate by the Wnt signalling pathway. Nature 1998, 396:370-373. 36. Tachibana M: MITF: a stream flowing for pigment cells. Pigment
Cell Res 2000, 13:230-240.
37. Dupin E, Glavieux C, Vaigot P, Le Douarin NM: Endothelin 3 induces the reversion of melanocytes to glia through a neu-ral crest-derived glial-melanocytic progenitor. Proc Natl Acad Sci USA 2000, 97:7882-7887.
38. Leimeroth R, Lobsiger C, Lussi A, Taylor V, Suter U, Sommer L: Membrane-bound neuregulin1 type III actively promotes Schwann cell differentiation of multipotent Progenitor cells. Dev Biol 2002, 246:245-258.
39. Kalcheim C: The role of neurotrophins in development of neu-ral-crest cells that become sensory ganglia. Philos Trans R Soc Lond B Biol Sci 1996, 351:375-381.
40. Sariola H, Saarma M: Novel functions and signalling pathways for GDNF. J Cell Sci 2003, 116:3855-3862.
41. Clouthier DE, Williams SC, Yanagisawa H, Wieduwilt M, Richardson JA, Yanagisawa M: Signaling pathways crucial for craniofacial development revealed by endothelin-A receptor-deficient mice. Dev Biol 2000, 217:10-24.
42. Hallbook F: Evolution of the vertebrate neurotrophin and Trk receptor gene families. Curr Opin Neurobiol 1999, 9:616-621. 43. Jeanmougin F, Thompson JD, Gouy M, Higgins DG, Gibson TJ:
Mul-tiple sequence alignment with Clustal X. Trends Biochem Sci 1998, 23:403-405.
44. Butte MJ: Neurotrophic factor structures reveal clues to evo-lution, binding, specificity, and receptor activation. Cell Mol Life Sci 2001, 58:1003-1013.
45. Holmes WE, Sliwkowski MX, Akita RW, Henzel WJ, Lee J, Park JW, Yansura D, Abadi N, Raab H, Lewis GD, et al.: Identification of heregulin, a specific activator of p185erbB2. Science 1992, 256:1205-1210.
46. Bateman A, Coin L, Durbin R, Finn RD, Hollich V, Griffiths-Jones S, Khanna A, Marshall M, Moxon S, Sonnhammer EL, et al.: The Pfam
protein families database. Nucleic Acids Res 2004, 32:D138-D141. 47. Kortschak RD, Samuel G, Saint R, Miller DJ: EST analysis of the cnidarian Acropora millepora reveals extensive gene loss and rapid sequence divergence in the model invertebrates. Curr Biol 2003, 13:2190-2195.
48. Altschul SF, Gish W, Miller W, Myers EW, Lipman DJ: Basic local alignment search tool. J Mol Biol 1990, 215:403-410.
49. GOstat web page [http://gostat.wehi.edu.au/]
50. MRK_Pheno_Ensembl [ftp://ftp.informatics.jax.org/pub/reports/ index.html]