www.hydrol-earth-syst-sci.net/18/1591/2014/ doi:10.5194/hess-18-1591-2014
© Author(s) 2014. CC Attribution 3.0 License.
Hydrology and
Earth System
Sciences
Exploring drought vulnerability in Africa:
an indicator based analysis to be used in early warning systems
G. Naumann1, P. Barbosa1, L. Garrote2, A. Iglesias3, and J. Vogt1
1European Commission, Joint Research Centre, 21027 Ispra (VA), Italy
2Department of Civil Engineering, Universidad Politécnica de Madrid, UPM, Madrid, Spain
3Department of Agricultural Economics and Social Sciences, Universidad Politécnica de Madrid, UPM, Madrid, Spain
Correspondence to: G. Naumann ([email protected])
Received: 10 September 2013 – Published in Hydrol. Earth Syst. Sci. Discuss.: 8 October 2013 Revised: – Accepted: 9 March 2014 – Published: 6 May 2014
Abstract. We propose a composite drought vulnerability in-dicator (DVI) that reflects different aspects of drought vul-nerability evaluated at Pan-African level for four compo-nents: the renewable natural capital, the economic capacity, the human and civic resources, and the infrastructure and technology. The selection of variables and weights reflects the assumption that a society with institutional capacity and coordination, as well as with mechanisms for public partic-ipation, is less vulnerable to drought; furthermore, we con-sider that agriculture is only one of the many sectors affected by drought.
The quality and accuracy of a composite indicator depends on the theoretical framework, on the data collection and qual-ity, and on how the different components are aggregated. This kind of approach can lead to some degree of scepticism; to overcome this problem a sensitivity analysis was done in or-der to measure the degree of uncertainty associated with the construction of the composite indicator. Although the pro-posed drought vulnerability indicator relies on a number of theoretical assumptions and some degree of subjectivity, the sensitivity analysis showed that it is a robust indicator and hence able of representing the complex processes that lead to drought vulnerability.
According to the DVI computed at country level, the African countries classified with higher relative vulnerabil-ity are Somalia, Burundi, Niger, Ethiopia, Mali and Chad. The analysis of the renewable natural capital component at sub-basin level shows that the basins with high to moderate drought vulnerability can be subdivided into the following geographical regions: the Mediterranean coast of Africa; the Sahel region and the Horn of Africa; the Serengeti and the
Eastern Miombo woodlands in eastern Africa; the western part of the Zambezi Basin, the southeastern border of the Congo Basin, and the belt of Fynbos in the Western Cape province of South Africa.
The results of the DVI at the country level were compared with drought disaster information from the EM-DAT disaster database. Even if a cause–effect relationship cannot be estab-lished between the DVI and the drought disaster database, a good agreement is observed between the drought vulnerabil-ity maps and the number of persons affected by droughts.
These results are expected to contribute to the discussion on how to assess drought vulnerability and hopefully con-tribute to the development of drought early warning systems in Africa.
1 Introduction
depicted as exposure and sensitivity (UNISDR, 2000; Adger, 2006). Drought vulnerability depends on inadequate struc-tures and management, on limitations of technology and of the economy, or on environmental constraints. In many cases, social factors dominate (Turner et al., 2003). For example, al-though the direct impact of precipitation deficiencies may be a reduction of crop yields, the underlying cause of this vul-nerability to meteorological drought may be that the farmers did not use drought-resistant seeds – either because they did not believe in their usefulness, their costs were too high, or because of some commitment to cultural beliefs. Another ex-ample could be farm foreclosure related to drought; the un-derlying cause of this vulnerability could be manifold, such as small farm size because of historical land appropriation policies, lack of credit for diversification options, farming on marginal lands, limited knowledge of possible farming op-tions, a lack of local industry for off-farm supplemental in-come, or government policies.
Understanding vulnerability to drought can help to in-crease a region’s preparedness and hence limits the great-est and most devastating effects of the hazard. Here we aim to understand the underlying causes of vulnerability, such as inadequate structures, management, and technology, or eco-nomic, environmental, and social factors, in order to provide information for a drought early warning system.
The complexity of understanding drought vulnerability hinders the development of early warning systems. Drought vulnerability is far-reaching in society – from the clear ef-fects on hydrology (Van Loon and Van Lanen, 2012) or food production (FAO, 2010) to the less-documented effects on crime and social unrest (Burke et al., 2009; Hsiang et al., 2013). Although it is impossible to define a single measure-ment of drought vulnerability, it is relatively well accepted that regional disparities result as a consequence of differ-ences in the natural capital and human and civic resources (Smit et al., 1999). However, efforts to develop vulnerabil-ity indicators have been met with a lack of agreement on the variables that may characterise this complex concept. Even in areas of high drought risk, the success of various method-ological approaches to evaluate vulnerability has been mixed, reflecting the difficulty in the quantification of the concept, the multiple dimensions, and the limitations of data. To ad-vance the understanding of drought vulnerability and support early warning systems, this paper reports a range of variables and aggregated measures of drought vulnerability. We frame this analysis in Africa, an area where drought risk is a ma-jor issue, where most climate scenarios project further water limitations (Christensen et al., 2007), where water sustains food production and exceptionally high biodiversity areas, and where the effect of drought on human displacement and potential violent conflict is a reality (Westing, 1992).
Traditionally, an indicator approach uses different types of scales and factor analyses to investigate social, economic and environmental factors (Smit et al., 1999; Leichenko and O’Brien, 2002). In most of these studies, variables are
se-lected based on the attribute to be represented and the avail-ability of data. Thus an analyst may find it rather easy to propose types of indicators which do not refer to a particu-lar case and whose evaluations results may differ enormously from reality. However, presenting a real case would avoid this problem, and analysing the main reasons and causes of these answers would be much easier for the researcher.
Drought in Africa has generated widespread media atten-tion. The debate on anticipatory drought early warning sys-tems and drought relief assistance has been at the centre of the United Nation International Strategy for Disaster Re-duction since the early 2000s (UNISDR, 2000). Moreover, with a growing population, society is becoming increasingly concerned and stronger worries are placed on the effects of drought on water, food and health security. Thus, the increas-ing social awareness about the effects of drought on people combined with adverse climate change predictions exacer-bates the situation.
Given the complexity of drought vulnerability, it is essen-tial to incorporate the different determinants of the drought response, including social, economic and environmental as-pects (Smit et al., 1999). A good example of this inten-tion is the evaluainten-tion of drought vulnerability in Australia, which represents a benchmark in the design of drought policy and greatly promotes stakeholder and public participation in decision- and policy-making processes (Nelson et al., 2008). Studies that analyse the reasons behind drought vulnera-bility have been less numerous than those dealing with the physical event. There are a number of studies which assess drought vulnerability on large geographical areas based on drought indices (Charusombat and Niyogi, 2011; Vicente-Serrano et al., 2012; Taylor et al., 2013; Van Lanen et al., 2013) and others which highlight the factors that influence local populations and livelihoods (Wilhelmi and Wilhite, 2002; Luers et al., 2003; Shiau and Hsiao, 2012.).
We contribute to an understanding of drought vulnerabil-ity in Africa, recognising its multiple components and lim-itations to express many social and environmental attributes in a common scale across the continent. Although there are a number of studies focusing on local case evaluations of vul-nerability (Eriksen et al., 2005; Eriksen and O’Brien, 2007; Anderson et al., 2012; van Huijgevoort et al., 2012; Welsh et al., 2013), the majority of the studies focuses mainly on the hazards, due in large part to the difficulty in finding appro-priate social indicators.
Building and validating a composite vulnerability indica-tor can be extremely difficult. In particular, the impact of data perturbation, such as adding or deleting a variable and the weighting scheme adopted, should be the main concerns when building the composite indicator. However, these issues are infrequently addressed in the literature (Cherchye et al., 2008; Saisana et al., 2005).
possible (Nardo et al., 2005). Here we propose an analysis divided into three main parts that are essential to any vulner-ability assessment approach: (i) definition of the components of drought vulnerability, (ii) selection of variables and their normalisation, and (iii) model validation through a weight-ing and sensitivity analysis, and comparison with other indi-cators. A detailed analysis on the weighting scheme adopted as well as a comparison with the impacts of previous drought disasters may help in the stakeholders’ acceptance of the in-dicator.
Advances in seasonal forecast skill (Dutra et al., 2013, 2014) open the possibility for improved drought early warn-ing systems. However, the implementation of such systems also requires an understanding of the social capacity to use the forecast. Here we propose a methodology to characterise drought vulnerability and apply the methodology in Africa.
2 Methods and data
2.1 Framework
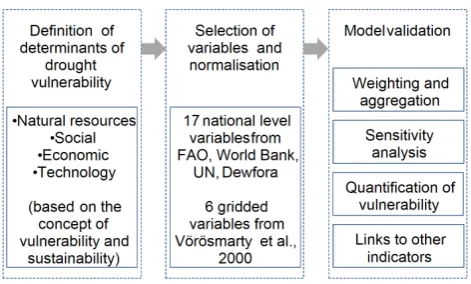
The study includes three steps aiming to provide a transpar-ent construction of the composite index of drought vulnera-bility and assist in the interpretation of the results (Fig. 1). The first is the definition of the determinants of drought vul-nerability, which includes a theoretical framework providing the basis for the selection and combination of the different components. The components included represent the social, economic and environmental aspects of sustainability. In ad-dition, we have considered explicitly the technology and in-frastructure that are directly relevant to drought vulnerability in agriculture and water resources management.
The second methodological step is the selection of vari-ables that define each component of drought vulnerability. We have based this selection on two criteria: the variable has to represent a quantitative or qualitative aspect of drought vulnerability, and public data need to be available, in this case FAO, World Bank, UN, and the data sets of Vörösmarty et al. (2000) that are available in the Water Systems Analysis Group of the University of New Hampshire. This emphasis on public databases ensures that the final result can be vali-dated, reproduced and improved with new data by stakehold-ers. In order to include the variables in a composite index, they have to be normalised with respect to some common baseline. In this case the baseline is defined by the sample of all African countries. Therefore, the values of the resulting indicators can only be interpreted and compared within the African continent.
[image:3.595.310.546.60.202.2]Finally, the development of a drought vulnerability index is validated through a series of steps: weighting and aggre-gation, analysis of sensitivity of the inclusion or exclusion of variables, and comparison with information on past drought disasters.
Fig. 1. Summary of the methodological framework.
2.2 Definition of determinants of the drought vulnerability indicator (DVI)
In order to assess the drought vulnerability and then the risk for a certain region, the definition of vulnerability to drought should reflect the complex interactions between the socio-economic systems and the physical environment. Defining vulnerability to drought is complex and involves some mea-sure of susceptibility, expomea-sure, coping capacity and adaptive capacity (Birkmann, 2007; Iglesias et al., 2009).
The multidimensional concept of vulnerability can be di-vided into different subgroups (components). These compo-nents can be dependent and linkages between them can exist. Within the framework of this work the drought vulnerabil-ity index is expressed as a function of four components that address different aspects of vulnerability: renewable natural capital, economic capacity, human and civic resources, and infrastructure and technology. The definition of the compo-nents was based on the relevance of each indicator for policy development and the entire statistical structure of the data set. An analytical approach was then used to explore whether the components are statistically well balanced in the composite indicator.
For each component a normalisation scheme was neces-sary prior to data aggregation, as most of the single indica-tors have different measurement units. Each component is assessed as a geometric mean of a set of indicators inferred from variables that can be obtained in public databases and therefore contrasted by stakeholders. The scores of the DVI range on a scale of 0 to 1, where 0 represents the lowest vul-nerability and 1 is associated with the highest vulvul-nerability.
the efficiency of agricultural water use, decreasing popula-tion under the poverty line, increasing the adult literacy rate, and increasing agricultural technology, are measures that re-sult in an overall vulnerability decrease.
2.3 Selection of variables and relevance
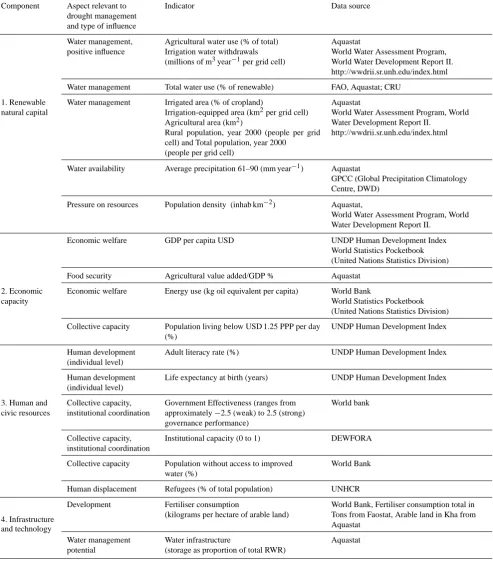
The variables that have been used to characterise the four components of socio-economic vulnerability were compiled for the 53 African countries from the sources listed in Ta-ble 1. In order to be used for the computation of the DVI, each variable must have at least 75 % of the countries with-out missing data. A final sub-indicator for each of the four components may be computed as the weighted average of all the representative variables within the component.
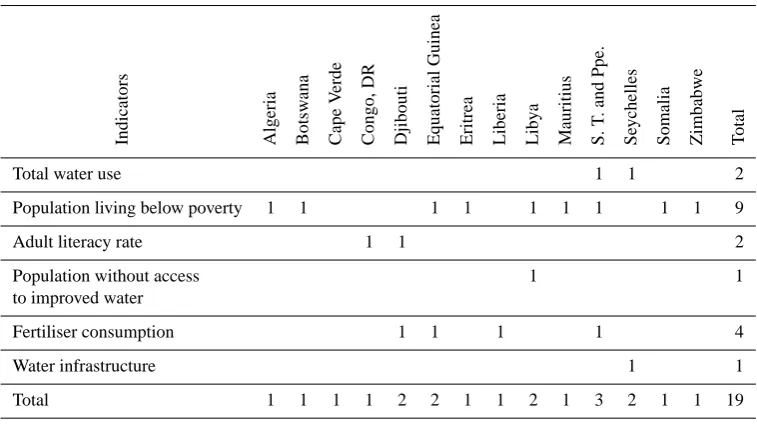
From the 17 variables selected, the amount of absent data for each indicator ranged between 0 and 17 %. For the variables that present missing values according to the main source (see Table 1) the values were completed from sec-ondary sources. This is the case for the energy use, GDP per capita and fertiliser consumption and population below the poverty line.
However, not all the values could be completed using sec-ondary sources. Although several approaches and guidelines on data treatment for missing values can be used (Little and Rubin, 2002; Nardo et al., 2005) we chose an unconditional imputation due to the existence of only a few missing values, simplicity, and reproducibility of the experiment by stake-holders. The remaining missing data – 19 from a total of 901 values presented in Table 2 – were filled by explicit mod-elling using an unconditional median imputation of each dicator in the entire data set (Nardo et al., 2005). The in-terpretation of the DVI results for those countries where the median was used should be done carefully.
The drought vulnerability index is a composite indicator calculated by weighted aggregation of 17 variables that rep-resent the four components. The selection of the variables included followed two criteria: they represent the concept to be explored and are publicly available. This vulnerability in-dex may be used to understand the sensitivity of the system and to assist in the selection of measures to be adopted.
Due to the limitations of data, the DVI computation was only done at the country level, while the analysis of the re-newable natural capital component of the DVI was also car-ried out at the grid level (1×1 degrees). Although drought impacts are generated by local processes and conditions, a national level analysis seems appropriate to be used by cen-tral governments and international organisations in the deter-mination of drought policies.
The five variables selected for the renewable natural cap-ital component were: agricultural water use, total water use, precipitation, irrigated area, and population density. These variables are relevant to assess drought vulnerability. Agri-cultural water use – the amount of water used for agriculture as the percentage of the total water used in the country – is a
measure of the dependence of the agricultural sector on water availability. Total water use – total freshwater withdrawn in a given year expressed in percentage of the actual total renew-able water resources – is an indication of the pressure on the renewable water resources. Average precipitation relates to the dependency of the country on the aridity level and there-fore the need for regulation of water sources. The irrigated area – as a share of total agricultural area – directly lowers vulnerability to meteorological drought; however, misman-agement of irrigation allocation may result in increased or urban and ecosystems vulnerability. Finally, the population density is an indicator of the human pressure on water re-sources and hence a higher density increases drought vulner-ability.
This component was also characterised at higher resolu-tion (all variables were aggregated to a common resoluresolu-tion of 1×1 degree grid) by using similar corresponding vari-ables available from the University of New Hampshire data sets (Vörösmarty et al., 2000). From the variables available in this digital archive the following variables were selected to obtain an index equivalent to the renewable natural capital: irrigation-equipped area, irrigation water withdrawals, agri-cultural area, rural population and total population. Gridded normal precipitation form the Global Precipitation Climatol-ogy Centre data set (Schneider et al., 2013) was also used. It is clear that the higher resolution is preferred in order to characterise local disparities within countries. The indicators at the finer resolution level were then aggregated in the study at the sub-basin level which can be of use for water basin management.
The four variables included to characterise the economic capacity component of the drought vulnerability index were: GDP per capita, agricultural value added, energy use, and population living below poverty line. The relevance of these variables for assessing drought vulnerability is as follows. GDP per capita – the total economic output of a country di-vided by the number of people in the country – while an im-perfect measure of well-being, is widely used in sustainabil-ity and human development indicators as the main variable affecting the country’s economic capacity, and directly cor-related to lower vulnerability. Agricultural value added per unit of GDP is associated with the manufacturing processes that increase the value of primary agricultural production and is directly correlated to lower vulnerability. The energy use – use of primary energy before transformation to other end-use fuels – reflects economic capacity and therefore also corre-lates positively with a lower vulnerability potential. In con-trast, population living below poverty line – with purchasing power parity below $1.25/day – correlates with higher vul-nerability levels since poverty influences the capacity to cope and respond to drought impacts.
Table 1. Vulnerability factors and their related weights included in the DVI.
Component Aspect relevant to drought management and type of influence
Indicator Data source
Water management, positive influence
Agricultural water use (% of total) Irrigation water withdrawals (millions of m3year−1per grid cell)
Aquastat
World Water Assessment Program, World Water Development Report II. http://wwdrii.sr.unh.edu/index.html Water management Total water use (% of renewable) FAO, Aquastat; CRU
1. Renewable natural capital
Water management Irrigated area (% of cropland)
Irrigation-equipped area (km2per grid cell) Agricultural area (km2)
Rural population, year 2000 (people per grid cell) and Total population, year 2000
(people per grid cell)
Aquastat
World Water Assessment Program, World Water Development Report II.
http://wwdrii.sr.unh.edu/index.html
Water availability Average precipitation 61–90 (mm year−1) Aquastat
GPCC (Global Precipitation Climatology Centre, DWD)
Pressure on resources Population density (inhab km−2) Aquastat,
World Water Assessment Program, World Water Development Report II.
Economic welfare GDP per capita USD UNDP Human Development Index World Statistics Pocketbook (United Nations Statistics Division) Food security Agricultural value added/GDP % Aquastat
2. Economic capacity
Economic welfare Energy use (kg oil equivalent per capita) World Bank
World Statistics Pocketbook (United Nations Statistics Division) Collective capacity Population living below USD 1.25 PPP per day
(%)
UNDP Human Development Index
Human development (individual level)
Adult literacy rate (%) UNDP Human Development Index
Human development (individual level)
Life expectancy at birth (years) UNDP Human Development Index
3. Human and civic resources
Collective capacity, institutional coordination
Government Effectiveness (ranges from approximately−2.5 (weak) to 2.5 (strong) governance performance)
World bank
Collective capacity, institutional coordination
Institutional capacity (0 to 1) DEWFORA
Collective capacity Population without access to improved water (%)
World Bank
Human displacement Refugees (% of total population) UNHCR
4. Infrastructure
Development Fertiliser consumption
(kilograms per hectare of arable land)
World Bank, Fertiliser consumption total in Tons from Faostat, Arable land in Kha from Aquastat
and technology
Water management potential
Water infrastructure
(storage as proportion of total RWR)
Table 2. Table of missing data per country and indicator. Only countries and indicators with missing data are shown.
Indicators Algeria Botsw
ana
Cape
V
erde
Congo,
DR
Djibouti Equatorial
Guinea
Eritrea Liberia Libya Mauritius S.
T
.
and
Ppe.
Se
ychelles
Somalia Zimbabwe Total
Total water use 1 1 2
Population living below poverty 1 1 1 1 1 1 1 1 1 9
Adult literacy rate 1 1 2
Population without access 1 1
to improved water
Fertiliser consumption 1 1 1 1 4
Water infrastructure 1 1
Total 1 1 1 1 2 2 1 1 2 1 3 2 1 1 19
expectancy at birth, and population without access to im-proved water are included in the Human Development Index (HDI) of the United Nations. In addition, we have considered institutional capacity and government effectiveness, to rep-resent the management dimensions of drought vulnerability. Finally, we included a measure of the displaced population and refugees, since this is an important factor that reduces the coping capacity of population to drought. The relevance of these variables for assessing drought vulnerability is sum-marised below.
Institutional capacity refers to the capacity of a country to cope with drought events; a higher institutional capacity implies lower drought vulnerability. Government effective-ness reflects perceptions of the quality of public services, the quality of the civil service and the degree of its inde-pendence from political pressures, the quality of policy for-mulation and implementation, and the credibility of the gov-ernment’s commitment to such policies. Adult literacy rate refers to the percentage of the population aged 15 and older who can, with understanding, both read and write a short sim-ple statement on their everyday life. A higher literacy rate implies a higher capacity to deal with drought events. Life expectancy at birth can be related to a population’s vulnera-bility to extreme events, including drought, because the lack of sufficiently elderly people will prevent appropriate tradi-tional knowledge transmission to young generations. Popu-lation without access to improved water (percentage of the population with reasonable access to an adequate amount of water from an improved source) is the most widely used in-dicator of drought damage in the most vulnerable areas and has been a subject of the Millennium Development Goals. Reasonable access is defined as the availability of at least 20 litres per person a day from a source within one
kilome-tre of the dwelling; greater access to improved water reduces drought vulnerability. The number of refugees and displaced population (as defined by the UNHCR) increases drought vulnerability of the country, since a refugee population is more likely to be exposed to natural hazards and less capable of coping with disasters.
The two variables selected for the infrastructure and tech-nology component were fertiliser consumption, and water infrastructure. Fertiliser consumption is a widely accepted measure of agricultural technology, and it is included as an indicator in most rural development studies. Water infrastruc-ture measures the water stored as proportion of total renew-able water resources and reduces the vulnerability to drought. 2.4 Normalisation of variables to a common baseline
The variables in Table 1 were normalised between the dif-ferent countries in order to be able to directly compare re-sults. The normalisation has been made taking into account the maximum and minimum value of each variable across all countries in order to combine variables within the categories and to guarantee that variables have an identical range be-tween 0 and 1.
For variables with a positive correlation to the overall vul-nerability, the normalised value is then calculated according to the general linear transformation, with
Zi =
Xi−Xmin
Xmax−Xmin
. (1)
HereXirepresents the variable value for a generic countryi,
XminandXmaxthe respective minimum and maximum value
across all countriesi.
literacy rate, or water infrastructure). For variables with neg-ative correlation to the overall vulnerability, a transformation was applied to link the lowest variable values with the high-est values of vulnerability:
Zi=1−(
Xi−Xmin
Xmax−Xmin
). (2)
In this way all normalised indicators (Zi)have values
be-tween 0 (less vulnerable) and 1 (most vulnerable). Then, for each country, any of thek(k=1,. . . ,4) components (C) are computed as the arithmetic mean of the variablesZi that
de-fine each component.
Ck=
1 n
n X
k=1
Zk (3)
2.5 Quantification of the drought vulnerability indicator (DVI)
The DVI is calculated with a similar methodology as the Hu-man Development Indicator (Neumayer, 2001), where each component of the DVI can be viewed as a dimension. In this way the DVI can be used as a guide to policies but also can be decomposed in order to measure the individual impact of each component and extend the analysis of country perfor-mance.
Sub-component variables can be combined within each category by using either a geometric mean or a weighted mean with weights inversely proportional to the impact un-certainty level. This study considers the weights separately for each of the categories, as in Iglesias et al. (2007), in or-der to evaluate them independently. This allows evaluation of the strengths and weaknesses of each component of the total vulnerability index within each country. It should be pointed out that the vulnerability components have an inverse inter-pretation to the adaptation capacity components.
The overall drought vulnerability index is then calculated for each country as a weighted aggregation of the compo-nents as
DVIi=
4
X
k=1
WkCi,k, (4)
whereWkare the weights assigned for thekcomponent (with
6wk=1) andCi,kare the components for each country. The
DVI gives the relative vulnerability of a country with respect to all the countries considered in the computation.
2.6 Weighting and aggregation
The selection of the weighting scheme is related with the rel-ative importance of each component of the DVI. The weights selected can affect the value of the DVI and then the final ranking of each country. Since no perfect weighting and ag-gregation convention exists (Arrow, 1963) it is necessary to
test the stability and robustness of the weighting scheme se-lected.
The influence of weighting on the DVI was tested using three different weighting schemes: equal weights (EW), a weighting scheme according the number of variables in each component (proportional weights, PW) and random weights (Montecarlo with 1000 simulations, RW).
The construction of the components can be made by expert opinion or by analysing the statistical structure of the data set. Different analytical approaches, such as cluster analy-sis or principal component or factor analyanaly-sis can be made to test if the dimensions defined theoretically are well balanced (Nardo et al., 2005). In this step, the four components defined in Table 1 were compared against a new set of four dimen-sions obtained after an objective classification (kmeans clus-tering; Hartigan and Wong, 1979) of all the indicators. This is a purely statistical method of aggregation of indicators and is useful for exploring the impact of the methodological choices during the development of the components.
2.7 Sensitivity analysis of the indicator
Uncertainty analysis focuses on how uncertainty in the in-put factors (variables included, weighting, and aggregation) propagates through the overall structure of the DVI compos-ite indicator. A sensitivity analysis was undertaken in order to assess the robustness of the DVI. This examination is con-ducted as different Monte Carlo experiments to assess the contribution of any individual source of uncertainty to the output variance. This methodology is based on multiple eval-uations of the model with three weighting and two aggre-gation schemes that generate different probabilistic density functions (PDF) of model outputs.
The main decisions tested were (1) inclusion or exclusion of variables for the different weighting schemes (PW, EW, and RW); and (2) variables aggregation in the four compo-nents according to the theoretical framework and according to cluster analysis.
The stability of the DVI and of the rank assigned by the composite indicator to a given country (Rank(DVIi)) is an
indicator of the robustness of the estimation. The shift in country rankingsRsis hence a measure of the uncertainty of
each input factor. The mean value ofRscan be computed as
the differences in countries’ ranks in respect to the reference ranking over the total number of countries (C):
Rs=
1 C
XC
i=1 Rank DVIi(ref)
−Rank(DVIi)
, (5)
where the reference ranking is given by the theoretical frame-work aggregation using proportional weights.
The uncertainties from the input factors are then expressed as the resulting PDFs of the DVI, Rank(DVIi)andRs. The
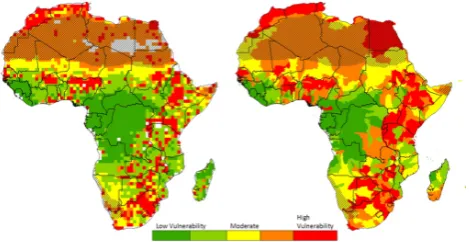
Fig. 2. (a) Renewable natural component of drought vulnerability at pixel level, and (b) renewable natural component of drought vul-nerability at sub-basin level. Areas with annual precipitation below 150 mm year−1were masked (shaded region).
analysis can help to increase the transparency and to identify which countries are favoured or weakened under the different assumptions.
2.8 Comparison of the DVI with drought disaster observations
In order to assess how the vulnerability indicators are correlated with drought disasters, the tetrachoric corre-lation (Drasgow, 1986) was computed between the DVI and the numbers of persons reported affected (PRA) by drought disasters retrieved from the EM-DAT data set (The OFDA/CRED International Disaster Database – www.emdat. be, Université Catholique de Louvain, Brussels (Belgium)). EM-DAT is a global database on natural and technological disasters that contains data on the occurrence and effects of natural disasters in the world from 1900 to present. The DVI and PRA variables were converted to dichotomous variables by using their median threshold to define two categories (low and high DVI; low and high PRA). After the dichotomisation a tetrachoric test was carried out to determine whether there is a significant agreement between the two variables.
3 Results
The analysis of the results referring to the methodology pre-sented before is divided into three sections. The first section presents a simplified agricultural drought vulnerability index that takes in account only the renewable natural capital vari-ables that were available at 1×1 degree resolution. The sec-ond section presents the final results of the DVI at national level after performing an appropriate weighting and aggre-gation scheme as well as a sensitivity analysis study. Finally, the third section compares the DVI results with a historical database of drought disasters.
Fig. 3. (a) DVI values and (b) ranking of each country according with the average value of DVI computed with equal weights (EW), proportional weights (PW) and random weights (RW).
3.1 Renewable natural capital component of drought vulnerability at pixel level
The renewable natural capital component of vulnerability of agricultural systems in Africa at pixel level was assessed by using the global gridded data set reported by Vörösmarty et al. (2000). A recent study in Africa (Vörösmarty et al., 2005) demonstrates the utility of such geospatial data sets in a wide range of indicator applications in areas with scarce local data. Figure 2a shows the natural capital component of drought vulnerability of agricultural systems. The areas of higher vulnerability correspond with the areas of high den-sity of crops and population as depicted in Vörösmarty et al. (2000). Those areas include the Mediterranean climates of Africa, the Sahel and almost the entire eastern part of the continent, including the Greater Horn of Africa (GHA).
A regional vulnerability analysis was performed by aggre-gating the data at sub-basin level (Fig. 2b). The most vulner-able sub-basins (high to moderate in Fig. 2) can be grouped into three main different regions: (1) the Mediterranean coast of Africa, comprising most of the Moroccan and Algerian basins and the Nile Delta; (2) the Sub-Sahara and the south-ern Sahel regions of the Volta and Niger, White and Blue Nile and the Horn of Africa; (3) the Serengeti and the East-ern Miombo woodlands in Tanzania and Mozambique and the Limpopo. A few local spots of high vulnerability can be added to these regions: the eastern part of the Zambezi River and the southeastern border of the Congo Basin, and the belt of Fynbos (natural shrub land vegetation) in the West-ern Cape of South Africa.
3.2 Drought vulnerability indicator at national level
3.2.1 Weighting and aggregation
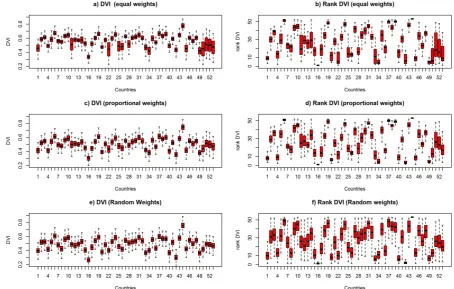
[image:8.595.51.286.63.184.2] [image:8.595.310.546.63.220.2]Fig. 4. Summary of the estimated DVI values (left) and their related country ranking (right) for the three weighting schemes (a, b: equal weights, c, d: proportional weights and e, f: random weights). Dashed lines extend from 5th to 95th percentile of estimations, boxes extend from 25th to 75th percentile and middle horizontal lines within each box indicate the median for each country. The countries were numbered following their alphabetical order (see Fig. 7 for the corresponding names).
schemes (EW, PW, and RW). In the case of the RW scheme, since there were no a priori weights, 1000 repetitions were done for each variable exclusion in order to compute the DVI. Figure 3 shows the values of the average DVI and ranking obtained for all countries using the three different weighting schemes. The results show that, for most countries, there is little dispersion for the DVI values obtained with the three weighting schemes. The DVI ranges between 0.25 and 0.75 and most of the countries are between 0.4 and 0.6 for all the estimations. The equal weights scheme produces the largest dispersion of values and tends to be higher than the other estimations for most countries.
If the country ranks are compared, taking as reference the estimation using proportional weights, no systematic differ-ences are observed, while most of the countries remain in the same quintile. However, those countries ranked in the bor-ders of the five DVI categories (low to high vulnerability) are more likely to be misclassified. Furthermore, the most extreme categories (low and high vulnerability) present the highest number of countries that can be classified in the ad-jacent category.
3.2.2 Sensitivity analysis
The sensitivity of the DVI to the inclusion or exclusion of one of the 17 variables was assessed for the three weighting schemes. As a result, DVI value scores were obtained as non-linear functions of the uncertain input factors and their PDF reflect the overall uncertainty.
Figure 4 shows the box plots of each country DVI value and rank for the three weighting schemes. The results show larger dispersion for DVI and rank values for the equal weights option, while the test with random weights shows a low dispersion in DVI values but a high dispersion in the country ranks. These results are suggesting that the propor-tional weights option is more robust with respect to missing data.
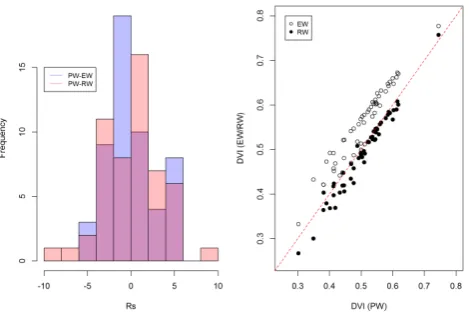
Fig. 5. (a) Difference of country rankings (Rs) considering the
pro-portional weights (PW) compared with equal (EW, in blue) and ran-dom (RW, in pink) weights. (b) Scatterplot of DVI values consider-ing the proportional weights (PW) compared with equal (EW) and random (RW) weights.
shows the histogram of differences in rankings of countries between DVI computed with proportional weights and the two other schemes (EW and RW). The standard deviation of rank differential is 3.3 for EW and 2.7 for RW, while the mean was around 0 for all the schemes. It can be concluded that the rank difference in 69 % of the countries belongs to the interval [−3, 3], confirming a low dispersion in the esti-mation of DVI rank values.
The definition of the components, even if they are defined within a theoretical framework, can be another source of un-certainty. The construction of the components can be tested to see if they are well balanced and produce a robust com-posite indicator. Cluster analysis can be used as an objective tool for classifying the original indicators into components. This methodology gives a purely statistical method of aggre-gation of indicators and can be used to measure the impact of methodological choices during the construction of the com-ponents.
Figure 6a shows the histogram of differences in country rankings according to DVI computed using the theoretical framework components, and the four components obtained after the clustering (both with PW). The standard deviation here is around 4.0, meaning that most of the countries can vary their rank in 4 or less positions. Figure 6b shows that the cluster scheme tends to underestimate the DVI values systematically as compared with the theoretical framework scheme.
Overall, the proportional weights option produces inter-mediate results with the lowest dispersion in most countries (Fig. 4), adding value over the random weights scheme and reducing the extreme behaviour of the equal weights scheme. Furthermore, the comparison of the theoretical framework scheme was not substantially different from the cluster scheme (Fig. 6). This means that the DVI computed with
Fig. 6. (a) Histogram of the difference of country rankings accord-ing to DVI computed usaccord-ing the theoretical framework components and the four components obtained after the clustering (both with PW); and (b) Scatterplot of DVI values according to the theoretical framework components and the four components obtained after the clustering (both with PW).
the theoretical framework scheme and proportional weights gives an unbiased representation of overall vulnerability, and hence this was the DVI selected for further analysis. 3.2.3 Analysis of the DVI
The DVI for each country, including the value of its four components, is shown on Fig. 7, while the DVI map is pre-sented in Fig. 8. The scores of the vulnerability index range on a scale from 0 to 1, with 0 the least vulnerable and 1 the most vulnerable.
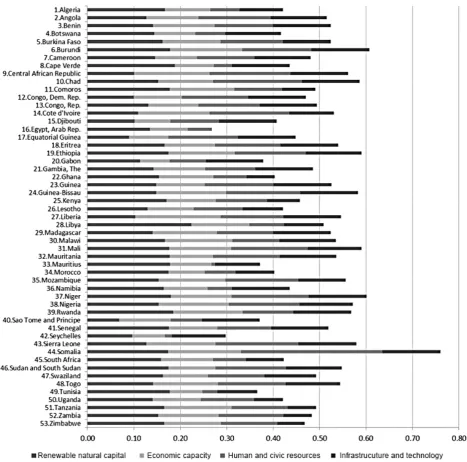
According to this analysis, the six countries with the high-est vulnerability are Somalia, Burundi, Niger, Mali, Ethiopia and Chad, with DVI values close to or higher than 0.6. In order to understand the source of vulnerability in each case it is useful to analyse each dimension and sub-index sepa-rately. For example, according to Fig. 9 Mali shows high vulnerability in renewable natural capital and human and civic resources, while Ethiopia and Somalia are vulnerable in the four sub-categories. Libya is the country with high-est score in renewable natural capital vulnerability, Liberia in economic capacity, Somalia in human and civil resources and Seychelles in infrastructure and technology.
3.3 Comparing drought vulnerability estimates with observed data
[image:10.595.51.286.63.219.2] [image:10.595.312.546.64.218.2]Fig. 7. Drought vulnerability index (DVI) disaggregated into their four components: renewable natural capital, economic capacity, human and civic resources, and infrastructure and technology. Countries are ordered by alphabetical order.
reported more than 1 million people affected in this period (e.g Somalia, Mali and Angola) are classified as having mod-erate to high vulnerability according to the DVI. On the other hand, three exceptions to this agreement are Ghana, Kenya, and Tanzania, where more than 10 million people affected were reported during the 1970–2006 period, but are classified as having vulnerabilities between low and moderate accord-ing to DVI. This could be due to the fact that there is a high spatial variability of the renewable natural component of vul-nerability, as shown in the pixel and sub-basin level analysis. In fact, there are pixels with a high vulnerability to drought
in some areas of these countries in contrast with other areas that show low vulnerability to drought (see Fig. 2).
Fig. 8. Drought vulnerability index (DVI). The different levels of vulnerability were classified by dividing the sample in quintiles.
4 Conclusions
An indicator that estimates social vulnerability to drought (DVI) was developed and calculated at the Pan-African level. The methodology is appropriate to integrate both quantitative and qualitative characterisations of drought vulnerability at different spatial scales. The intermediate components of the DVI can be evaluated independently, allowing comprehen-sive interpretation of the strengths and weaknesses of each component.
Although the first results show that the DVI indicator de-veloped can be used to evaluate countries’ drought vulnera-bility, there are some limitations. First, our sample of selected components covers only some aspects of drought vulnera-bility in Africa. Second, our list of proposed variables that represent these components does not capture the full range of possible vulnerabilities and vulnerable groups to be in-cluded in early warning systems, particularly since it does not completely evaluate social conditions nor the response of stakeholder groups or market aspects. Third, our drought vul-nerability index is estimated as a weighted average of these simple components assuming strong and well-defined rela-tionships among the variables, which could be an interesting topic to discuss in further research. Additionally, in the con-text of the development of drought policy, the dynamics of the variables is not considered (i.e. climate change, popula-tion growth).
[image:12.595.310.546.63.322.2]Moreover, the resolution and quality of the input data de-termines the accuracy and relevance of the derived informa-tion. Data available across the entire African continent was used, which usually is only available at national level. This will mask disparities within a country and as such can result in some discrepancies between other drought information data sets. More detailed and better quality data sets would
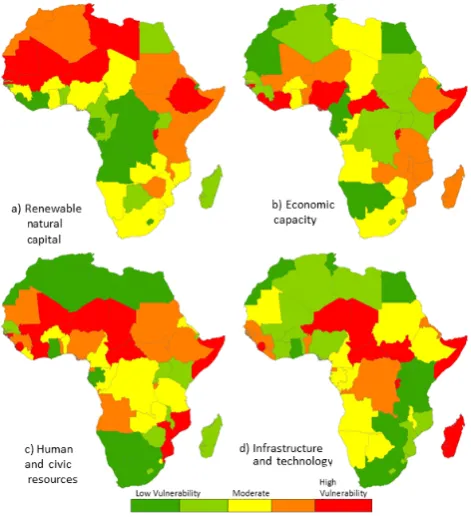
Fig. 9. Four components of the drought vulnerability index (DVI); (a) Renewable Natural Capital, (b) Economic Capacity, (c) Human and Civic Resources and (d) Infrastructure and Technology. The dif-ferent levels of vulnerability were classified by dividing the sample in quintiles.
Table 3. Contingency tables and tetrachoric coefficient (rt)for the
number of persons reported affected (PRA) by drought disasters and DVI. The analysis was performed over the 47 African coun-tries with disaster data. Source: EM-DAT: the OFDA/CRED Inter-national Disaster Database – www.emdat.be, Université Catholique de Louvain, Brussels (Belgium).
Low DVI High DVI
Low no. persons reported affected 16 7 High no. persons reported affected 7 17
rt=0.593σrt=0.1688
allow performing a more complete and accurate identifica-tion of drought vulnerability hotspots at sub-naidentifica-tional level.
Despite these limitations, the analysis advances our knowledge of drought vulnerability in Africa by providing increased comprehension of the variety of reasons behind vulnerability and their relationship in a geographically and socially diverse continent.
[image:12.595.312.543.476.540.2]this analysis, the countries classified with higher relative vul-nerability are Somalia, Mali, Ethiopia, Niger, Burundi and Chad.
The analysis of the renewable natural capital component of drought vulnerability at pixel level, and then aggregated at sub-basin level, shows that the basins with high to mod-erate drought vulnerability can be subdivided into three main different geographical regions: the Mediterranean coast of Africa (comprising most of the Moroccan and Algerian basins and the Nile Delta); the Sub-Sahara and the southern Sahel regions (including the Volta, Niger, White and Blue Nile and the Great Horn of Africa); the Serengeti and the Eastern Miombo woodlands of Tanzania and Mozambique. Additionally, the western part of the Zambezi Basin, the southeastern border of the Congo Basin and the belt of Fyn-bos in the Western Cape should also be included in this cate-gory.
Even if a cause–effect relationship cannot be established between the DVI and the drought disaster database, a good agreement is observed between the drought vulnerability maps and the number of persons affected by droughts. There is still a need to further validate the vulnerability indicator with more detailed drought impacts data in order to measure and improve their robustness and explain why in some cases extreme droughts can lead to disasters, while in other cases their impact is much lower. Future research is also needed to further understand why some regions or social groups are more vulnerable than others.
Acknowledgements. This work was funded by the European Commission Seventh Framework Programme (EU FP7) in the framework of the Improved Drought Early Warning and Forecast-ing to Strengthen Preparedness and Adaptation to Droughts in Africa (DEWFORA) project under Grant Agreement 265454.
Edited by: M. Werner
References
Adger, W. N.: Vulnerability, Global Environ. Change, 16, 268–281, 2006.
Anderson, W. B., Zaitchik, B. F., Hain, C. R., Anderson, M. C., Yilmaz, M. T., Mecikalski, J., and Schultz, L.: Towards an in-tegrated soil moisture drought monitor for East Africa, Hy-drol. Earth Syst. Sci., 16, 2893–2913, doi:10.5194/hess-16-2893-2012, 2012.
Arrow, K. J.: Social choice and individual values, 2nd Edn., Wiley, New York, 1963.
Birkmann, J.: Risk and vulnerability indicators at different scales: applicability, usefulness and policy implications, Environ. Haz-ards, 7, 20–31, 2007.
Brooks, N., Neil Adger, W., and Mick Kelly, P.: The determinants of vulnerability and adaptive capacity at the national level and the implications for adaptation, Global Environ. Change, 15, 151– 163, 2005.
Burke, M. B., Miguel, E., Satyanath, S., Dykema, J. A., and Lobell, D. B.: Warming increases the risk of civil war in Africa, Proc. Natl. Acad. Sci., 106, 20670–20674, 2009.
Charusombat, U. and Niyogi, D.: A hydroclimatological assess-ment of regional drought vulnerability: A case study of Indiana droughts, Earth Inter., 15, 1–65, 2011.
Cherchye, L., Moesen, W., Rogge, N., Van Puyenbroeck, T., Saisana, M., Saltelli, A., Liska R., and Tarantola, S.: Creating composite indicators with DEA and robustness analysis: the case of the technology achievement index, J. Operat. Res. Soc., 59, 239–251, 2007.
Christensen, J. H., Hewitson, B., Busuioc, A., Chen, A., Gao, X., Held, I., Jones, R., Kolli, R. K., Kwon, W.-T., Laprise, R., Mag-aña Rueda, V., Mearns, L., Menéndez, C. G., Räisänen, J., Rinke, A., Sarr, A., and Whetton, P.: Regional Climate Projections, in: Climate Change 2007: The Physical Science Basis, Contribution of Working Group I to the Fourth Assessment Report of the In-tergovernmental Panel on Climate Change, edited by: Solomon, S., Qin, D., Manning, M., Chen, Z., Marquis, M., Averyt, K. B., Tignor, M., and Miller, H. L., Cambridge University Press, Cam-bridge, United Kingdom and New York, NY, USA, 2007. Drasgow, F.: Polychoric and polyserial correlations, in:
Encyclope-dia of statistical sciences, edited by: Kotz, S., Johnson, N. I., and Read, C. B., Vol. 7, 68–74, New York: Wiley, 1986.
Dutra, E., Di Giuseppe, F., Wetterhall, F., and Pappenberger, F.: Seasonal forecasts of droughts in African basins using the Stan-dardized Precipitation Index, Hydrol. Earth Syst. Sci., 17, 2359– 2373, doi:10.5194/hess-17-2359-2013, 2013.
Dutra, E., Pozzi, W., Wetterhall, F., Di Giuseppe, F., Magnusson, L., Naumann, G., Barbosa, P., Vogt, J., and Pappenberger, F.: Global meteorological drought – Part 2: Seasonal forecasts, Hy-drol. Earth Syst. Sci. Discuss., 11, 919–944, doi:10.5194/hessd-11-919-2014, 2014.
Eriksen, S. H. and O’Brien, K.: Vulnerability, poverty and the need for sustainable adaptation measures, Climate Pol., 7, 337–352, 2007.
Eriksen, S. H., Brown, K., and Kelly, P. M.: The dynamics of vul-nerability: locating coping strategies in Kenya and Tanzania, The Geographical J., 171, 287–305, 2005.
FAO: The State of Food Insecurity in the World 2010: Addressing Food Insecurity in Protracted Crises, Rome, 2010.
Füssel, H. M.: Vulnerability: a generally applicable conceptual framework for climate change research, Global Environ. Change, 17, 155–167, 2007.
Hartigan, J. A. and Wong, M. A.: A K-means clustering algorithm, Appl. Stat., 28, 100–108, 1979.
Hsiang, S. M., Burke, M., and Miguel, E.: Quantifying the in-fluence of climate on human conflict, Science, 341, 1235367, doi:10.1126/science.1235367, 2013.
Iglesias, A., Garrote, L., Flores, F., and Moneo, M.: Challenges to manage the risk of water scarcity and climate change in the Mediterranean, Water Resour. Manage., 21, 775–788, 2007. Iglesias, A., Garrote, L., Cancelliere, A., Cubillo, F., and Wilhite,
Leichenko, R. M. and O’Brien, K. L.: The dynamics of rural vul-nerability to global change: the case of southern Africa, Mitig. Adapt. Strat. Global Change, 7, 1–18, 2002.
Little, R. J. A. and Rubin, D. B.: Statistical Analysis with Miss-ing Data (Wiley Series in Probability and Statistics), Wiley-Interscience, p. 408, 2002.
Luers, A. L., Lobell, D. B., Sklar, L. S., Addams, C. L., and Mat-son, P. A.: A method for quantifying vulnerability, applied to the agricultural system of the Yaqui Valley, Mexico, Global Environ. Change, 13, 255–267, 2003.
Nardo, M., Saisana, M., Saltelli, A., Tarantola, S., Hoffman, A., and Giovannini, E.: Handbook on constructing composite indicators: methodology and user guide (No. 2005/3), OECD publishing, 2005.
Nelson, R., Howden, M., and Smith, M. S.: Using adaptive gov-ernance to rethink the way science supports Australian drought policy, Environ. Sci. Pol., 11, 588–601, 2008.
Neumayer, E.: The human development index and sustainability – a constructive proposal, Ecol. Econom., 39.1, 101–114, 2001. Saisana, M., Saltelli, A., and Tarantola, S.: Uncertainty and
sensi-tivity analysis techniques as tools for the quality assessment of composite indicators, J. Roy. Stat. Soc. A, 168, 307–323, 2005. Schneider, U., Becker, A., Finger, P., Meyer-Christoffer, A., Ziese,
M., and Rudolf, B.: GPCC’s new land surface precipitation cli-matology based on quality-controlled in situ data and its role in quantifying the global water cycle, Theor. Appl. Climatol., 115, 1–26, doi:10.1007/s00704-013-0860-x, 2013.
Shiau, J. T. and Hsiao, Y. Y.: Water-deficit-based drought risk as-sessments in Taiwan, Nat. Hazards, 64, 237–257, 2012. Smit, B., Burton, I., Klein, R. J., and Street, R.: The science of
adap-tation: a framework for assessment, Mitig. Adapt. Strat. Global Change, 4, 199–213, 1999.
Taylor, I. H., Burke, E., McColl, L., Falloon, P. D., Harris, G. R., and McNeall, D.: The impact of climate mitigation on projec-tions of future drought, Hydrol. Earth Syst. Sci., 17, 2339–2358, doi:10.5194/hess-17-2339-2013, 2013.
Turner, B. L., Matson, P. A., McCarthy, J. J., Corell, R. W., Christensen, L., Eckley, N., Hovelsrud-Broda, G., Kasperson, J., Kasperson G., Luers, A., Martello, M., Mathiesen, S., Naylor, R., Polsky, C., Pulsipher, A., Schiller, A., Selin, H., and Tyler, N.: Illustrating the coupled human–environment system for vulner-ability analysis: three case studies, Proc. Natl. Acad. Sci., 100, 8080–8085, 2005.
UNISDR: United Nations International Strategy for Disaster Re-duction, United Nations, United Nations, Geneva, 2000. van Huijgevoort, M. H. J., Hazenberg, P., van Lanen, H. A. J., and
Uijlenhoet, R.: A generic method for hydrological drought iden-tification across different climate regions, Hydrol. Earth Syst. Sci., 16, 2437–2451, doi:10.5194/hess-16-2437-2012, 2012. Van Lanen, H. A. J., Wanders, N., Tallaksen, L. M., and Van Loon,
A. F.: Hydrological drought across the world: impact of climate and physical catchment structure, Hydrol. Earth Syst. Sci., 17, 1715–1732, doi:10.5194/hess-17-1715-2013, 2013.
Van Loon, A. F. and Van Lanen, H. A. J.: A process-based typol-ogy of hydrological drought, Hydrol. Earth Syst. Sci., 16, 1915– 1946, doi:10.5194/hess-16-1915-2012, 2012.
Vicente-Serrano, S. M., Beguería, S., Gimeno, L., Eklundh, L., Giu-liani, G., Weston, D., El Kenawy, A., López-Moreno, J., Nieto, R., Ayenew, T., Konte, D., Ardö, J., and Pegram, G. G.: Chal-lenges for drought mitigation in Africa: The potential use of geospatial data and drought information systems, Appl. Geogr., 34, 471–486, 2012.
Vörösmarty, C. J., Green, P., Salisbury, J., and Lammers, R.: Global water resources: Vulnerability from climate change and popula-tion growth, Science, 289, 284–288, 2000.
Vörösmarty, C. J., Douglas, E. M., Green, P. A., and Revenga, C.: Geospatial indicators of emerging water stress: an application to Africa, AMBIO: A journal of the Human Environment, 34, 230– 236, 2005.
Welsh, L. W., Endter-Wada, J., Downard, R., and Kettenring, K. M.: Developing adaptive capacity to droughts: the rationality of locality, Ecol. Soc., 18, 7–16, doi:10.5751/ES-05484-180207, 2013.
Westing, A. H.: Environmental refugees: a growing category of dis-placed persons, Environ. Conserv., 19, 201–207, 1992.