M E T H O D
Open Access
CRUP: a comprehensive framework to
predict condition-specific regulatory units
Anna Ramisch
1†, Verena Heinrich
1†, Laura V. Glaser
1, Alisa Fuchs
2, Xinyi Yang
2, Philipp Benner
1, Robert
Schöpflin
1, Na Li
2, Sarah Kinkley
2, Anja Römer-Hillmann
3, John Longinotto
4, Steffen Heyne
4, Beate
Czepukojc
5, Sonja M. Kessler
5,8, Alexandra K. Kiemer
5, Cristina Cadenas
6, Laura Arrigoni
4, Nina
Gasparoni
7, Thomas Manke
4, Thomas Pap
3, John A. Pospisilik
4, Jan Hengstler
6, Jörn Walter
7, Sebastiaan H.
Meijsing
1, Ho-Ryun Chung
2and Martin Vingron
1*Abstract
We present the software Condition-specific Regulatory Units Prediction (CRUP) to infer from epigenetic marks a list of regulatory units consisting of dynamically changing enhancers with their target genes. The workflow consists of a novel pre-trained enhancer predictor that can be reliably applied across cell types and species, solely based on histone modification ChIP-seq data. Enhancers are subsequently assigned to different conditions and correlated with gene expression to derive regulatory units. We thoroughly test and then apply CRUP to a rheumatoid arthritis model, identifying enhancer-gene pairs comprising known disease genes as well as new candidate genes.
Keywords: Enhancer prediction, Enhancer dynamics, Gene regulation, Epigenetics, Random forest, Differential analysis, Histone modification, 3D interaction
Background
Gene expression is to a large degree regulated by dis-tal genomic elements referred to as enhancers [1], which recruit a combination of different factors to activate tran-scription from a targeted core promoter. The activity state of enhancers may change dynamically across con-ditions, e.g., across varying time points or disease states. Thus, their activity patterns are central in the context of phenotypic diversity [2, 3], and altered activity can be the source of pathogenic gene-enhancer disruptions and subsequent misregulation [4]. Although the func-tional importance of enhancers was first observed almost 40 years ago [5], to date, there is neither a complete know-ledge of enhancers nor of their regulatory interplay with targeted genes. By analyzing epigenetic profiles of exper-imentally determined enhancers, e.g., histone modifica-tions (HMs) or binding sites of co-activators like p300 [6] based on ChIP-seq measurements [7], dynamic changes
*Correspondence:[email protected]
†Anna Ramisch and Verena Heinrich contributed equally to this work.
1Department of Computational Molecular Biology, Max Planck Institute for Molecular Genetics, 14195 Berlin, Germany
Full list of author information is available at the end of the article
of enhancers were found to be reflected in the epigenetic landscape [8]. However, the majority of condition-specific gene-enhancer pairs have not been discovered, yet [9]. Consequently, to get a glimpse of the underlying causative regulatory mechanism, differential enhancers need to be further associated with promoter activity across the same conditions, e.g., by incorporating RNA-seq experiments [10].
Computational methods that predict enhancer activity based on epigenetic profiles have become an indispens-able alternative for cost- and time-consuming experimen-tal procedures over the last years [11–14]. Prediction approaches that rely on a pre-defined gold-standard set of enhancers are often prone to be biased for the cell type or tissue that was used for training. Although strategies that address this shortcoming were recently introduced [13], it remains difficult to develop a classification method that is able to generalize across different conditions, espe-cially as there are usually just a few common enhancer features available for all data sets. Apart from that, most of the available computational methods are not automa-tically providing a way to compare many samples across
different conditions, and thus, the assignment of differen-tial regions has to be done separately in a post-processing step, e.g., by overlapping peaks [15].
Furthermore, the allocation of putative target gene pro-moters remains challenging, especially as enhancers are positioned at various distances from their targeted pro-moters [16]. Recent methods to determine the contact frequencies between genomic regions, e.g., Hi-C [17,18], can be used to complement correlation strategies as in previously introduced approaches [9,19].
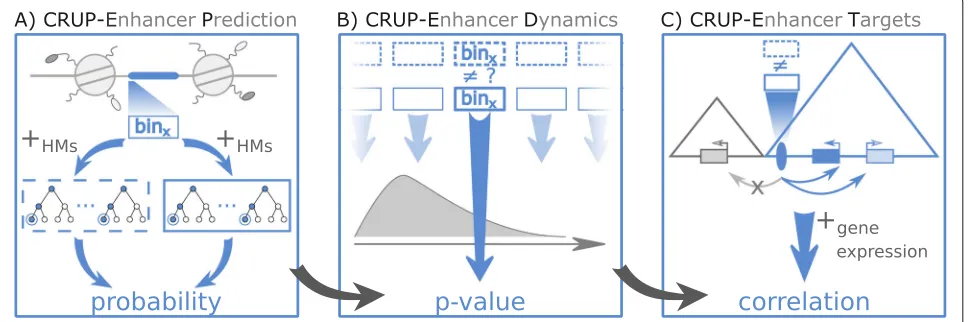
We found that there exists no comprehensive and easy-to-use tool that addresses all of the abovementioned issues in a combined way. In this work, we want to over-come this shortage and present the three-step framework Condition-specific Regulatory Units Prediction (CRUP) that combines the prediction of active enhancer elements (CRUP-EP) with condition-specific enhancer dynamics (CRUP-ED) and the identification of concurrently chang-ing enhancer-target pairs (CRUP-ET) in a continuous end-to-end fashioned pipeline.
Our proposed classification method CRUP-EP
(enhancer prediction) is based on a random forest approach and can be applied across different cell types and species without the need of being re-trained. CRUP-EP solely requires three HMs determined by ChIP-seq, namely H3K4me1, H3K4me3, and H3K27ac, which are widely accepted to reflect enhancer activity [20,21] and are among the most informative features for enhancer prediction [13, 14], guaranteeing a broad applicability. Although similar approaches were already used before, e.g., by REPTILE [13], we designed and optimized our classifier such that it builds an appropriate basis for the next two steps of CRUP. Implemented adaptations essential for our framework are, for example, the built-in normalization which ensures a good transferability of the trained classifier to different data types, as well as a feature set derived from a fine-grained binning and hence incorporating HM information at a 100 bp level which ensures a high resolution of the predictions. The main innovation of our classification approach is the disentanglement of the enhancer prediction into two classification tasks, addressing separately the distinction (i) between active and inactive regions and (ii) between active enhancers and active promoters.
We train and validate CRUP-EP on mouse embryonic stem cells (mESCs) based on curated FANTOM5 vali-dated enhancer regions [22]. To validate the resolution of our predicted enhancer regions, we use the distance to the nearest accessible region as an additional quality measure by integrating ATAC-seq experiments [23]. Furthermore, we can show that our approach is able to reliably reca-pitulate three independent sources of published lists of enhancer and super-enhancer regions in mESCs [24–26]. To demonstrate the transferability of our classifier, we
integrated five different experimental data sets compris-ing various cell types and species, which were obtained in the context of the German Epigenome Project [27].
Finally, we compare CRUP-EP to two other enhancer prediction methods, namely ChromHMM [11] and REP-TILE [13]. In this work, we refrain from further method comparisons since ChromHMM is a widely used genome segmentation approach, and REPTILE is a very recently published tool with similarities to CRUP-EP in terms of feature choice and methodology. REPTILE has also been demonstrated to be superior to several state-of-the-art enhancer prediction tools in a comprehensive review by [28].
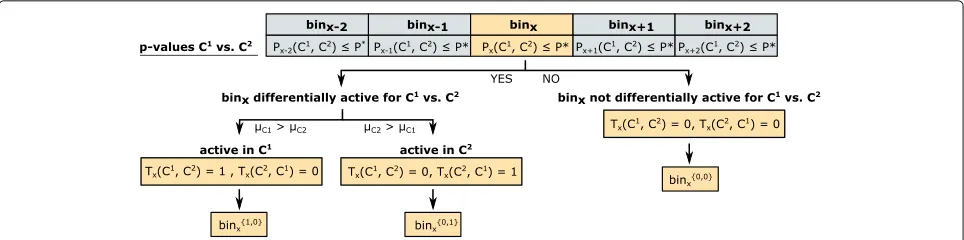
A prominent application of enhancer prediction meth-ods is the comparison of dynamic conditions, like varying time points, cell lines, or disease states. To address this, we complement CRUP-EP by CRUP-ED (enhancer dynam-ics) which assigns predicted enhancer regions to specific conditions while accounting for a flexible number of repli-cates. Based on the enhancer probabilities obtained by CRUP-EP, the second step of CRUP computes pair-wise empiricalpvalues based on a permutation test that are further used to cluster significantly different enhancer regions.
We apply CRUP-ED to a dataset of pluripotent and retinoic acid (RA)-induced mESCs yielding two clusters of condition-specific enhancer regions. We evaluate our dynamic enhancer regions by investigating the overrepre-sentation of transcription factor (TF) motifs [29] within each enhancer cluster. We are able to identify several motifs that are associated with RA receptors as well as with signaling pathways that regulate the pluripotency of stem cells. Finally, we used a reporter assay to predict pluripotency and RA-specific enhancer regions [30].
Enhancer dynamics strongly correlate with changing gene expression pattern as already stated by [8]. We make use of this property and added a third layer to our frame-work, CRUP-ET (enhancer targets), to match condition-specific enhancers found by CRUP-ED to gene expression to build entire “regulatory units.”
Finally, we identify trait-associated regulatory elements in a mouse model of rheumatoid arthritis (Rh. Arth.), an autoimmune inflammatory complex disease, and dis-cuss our main findings on a single enhancer region that we can correlate to the gene Cxcr4, which is part of the chemokine signaling pathway. Additionally, we support our findings with a motif enrichment analysis as well as with a pathway analysis. With this, we demonstrate how our presented framework CRUP can be used to identify candidate enhancer regions together with their putative target genes that dynamically change between different conditions.
Results
Short summary of CRUP
In this work, we describe the three-step framework Condition-specific Regulatory Units Prediction (CRUP) to predict active enhancer regions, assign them to con-ditions, and finally correlate each dynamically changing enhancer to putative target genes. Each step is imple-mented in R and incorporated into a continuous workflow (Fig.1).
The first module of our framework, CRUP-EP (enhancer prediction, see the “Methods” section), is an enhancer classifier with feature sets based on three HMs, namely H3K4me1, H3K4me3, and H3K27ac (Fig.1a). We implemented a combination of two random forests to split the task of distinguishing active regulatory regions from the rest of the genome, as well as differentiating enhancers from active promoters. CRUP-EP is designed such that it takes into account the basic genomic structure of an enhancer, which is in essence an open chromatin region flanked by nucleosomes.
The second phase of the workflow, CRUP-ED (enhancer dynamics, see the “Methods” section), is based on genome-wide enhancer predictions for multiple condi-tions, e.g., different development states of a cell (Fig.1b). We find condition-specific enhancers by applying a per-mutation test directly on the predicted enhancer proba-bilities (per bin) obtained by CRUP-EP. Based on pairwise empiricalpvalues, differential bins are then combined and clustered into dynamically changing enhancers.
In the last step, CRUP-ET (enhancer targets, see the “Methods” section), each dynamically changing enhancer region obtained by CRUP-ED is linked to target genes (Fig.1c). To this end, the correlation between enhancer probabilities and gene expression values across the same conditions is computed for all putative gene-enhancer pairs that are located within the same TAD.
We trained CRUP-EP on input-normalized HM ChIP-seq data and a training set based on FANTOM5-curated enhancers. To evaluate CRUP-ED and CRUP-ET we predicted active enhancer regions based on a classifier trained on mouse embryonic stem cells (mESC).
Validation of enhancer predictions in murine stem cells
We trained our random forest-based enhancer classifier CRUP-EP on three input-normalized HM ChIP-seq data from a single mESC sample, in this work further labeled as mESC+(see the “Methods” and “Cell culture and isola-tion” sections). The result of our predictions are enhancer probabilities for each 100-bp bin in the genome, based on which we define non-overlapping enhancer regions of length 1100 bp (see the “Methods” and “Enhancer predic-tion based on random forests” sections). Each enhancer is centered on the 100-bp bin with highest enhancer proba-bility and extended by five neighboring bins upstream and downstream (100 bp±5×10 bp). The number of neigh-boring bins was optimized as described in the “Parameter tuning” section.
On the first visual inspection, predicted enhancer peaks show typical enhancer characteristics with enrichment for the histone marks H3K4me1 and H3K27ac. Further-more, these regions show a high ATAC-seq signal (Addi-tional file1: Figures S1 and S2).
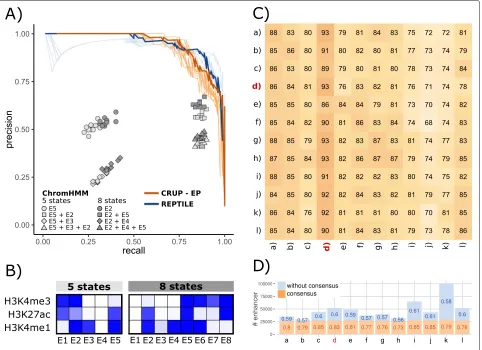
In the following, we thoroughly validate the enhancer predictions of CRUP-EP and compare some of our find-ings to two other methods, namely the segmentation approach ChromHMM [11] and the random forest-based method REPTILE [13]. A more detailed description of the implementation of both methods can be found in the “ Com-parison to other enhancer predicting methods” section.
To investigate the spatial resolution of our predicted enhancers, we computed the distance between each enhancer and the closest accessible region measured with ATAC-seq (Additional file 1: Figure S3A). The spatial resolution of our classifier is high (e.g., 135-bp median distance for the top 3000 predicted enhancers to the closest ATAC-seq peak), and in comparison with differ-ent training and feature set combinations of REPTILE, it becomes apparent that CRUP-EP performs better except when including additional methylation data and infor-mation about differentially methylated regions (DMR) to REPTILE.
Fig. 1Schematic overview. Condition-specific Regulatory Units Prediction (CRUP) is a three-step framework to predict active enhancers (CRUP-EP), assign them to dynamic conditions (CRUP-ED), and create differential regulatory units (CRUP-ET).aCRUP-EP accounts for the size of accessible regions (highlighted in blue) which are flanked by nucleosomes. For each region of interest, binx, a combination of two binary random forest classifiers, solely based on ChIP-seq HM data, is then used for enhancer prediction.bBased on a permutation test, CRUP-ED computes empiricalp
values for each binxacross different conditions (dotted and solid rectangles), which are further used to combine and cluster regions.cCRUP-ET inspects each differential enhancer region (blue ellipse) within its topologically associated domain (blue triangle). To infer putative target genes, the correlation between probability values and gene expression counts is calculated
Additional file1: Figure S5). Interestingly, the results clus-ter into four distinct groups, depending on whether the enhancer definition is only based on high emission proba-bilities for H3K4me1 and H3K27ac (K= 5:E5,K= 8:E2) or additionally on the promoter mark H3K4me3 (K = 5:E2,
K = 8:E5). It also becomes apparent that adding regions with high H3K4me1 but very low H3K27ac decreases the performance (K= 5:E3,K= 8:E4). Overall, depending on the number of pre-defined states and the choice of the enhancer state, ChromHMM led to strongly varying true-positive rates (TPRs)∈[ 0.23, 0.9] and precision values∈ [ 0.21, 0.67], resulting in much less stable results compared to REPTILE and CRUP-EP.
Next, we investigated the advantage of splitting the enhancer classification task into two random forests by comparing CRUP-EP to the results of a combined ran-dom forest (see the “Combined random forest variant” section). According to the measured importance of the individual HM features in the combined random forest, it appears that H3K27ac contributes the most to its decision process while features distinguishing specifically active enhancers from active promoters (H3K4me3 and the ratio of H3K4me1/H3K4me3), which seem to be picked up by CRUP-EP, might be underrepresented (see Addi-tional file1: Figure S6). We can confirm this observation when directly comparing enhancer probabilities of our test set regions between CRUP-EP and the combined clas-sifier. It becomes apparent that including a second random forest decreases on average the probabilities for active test set promoters (Additional file1: Figure S7), while increas-ing the probabilities of active enhancers (Additional file1: Figure S8).
We also explored a possible improvement of our enhancer predictions using the very recently published extreme gradient boosting approach XGBoost ([37], see “Extreme gradient boosting”) instead of the random forest algorithm. However, already in the parameter optimiza-tion step, we can observe that the random forest leads to similar but slightly superior results (see Additional file1: Figures S22, S23, S24).
To validate CRUP-EP on an independent set of enhancers, we applied our classifier to 25 experimen-tally validated mESC enhancers from [24], for which we achieved a high performance (23/25 with predicted prob-abilities≥0.75, see Additional file1: Figure S9).
We further validated our called enhancers by comparing them with 30,767 enhancers defined by the EnhancerAt-las database for mESC E14 [25]. Here, we could find that ∼ 34% (17,524 regions) of our enhancers directly overlap with the EnhancerAtlas database. We then applied a chi-square test of independence to validate this overlap which resulted in apvalue of 3.35e−125(see the “Chi-square test of independence” section).
[image:4.595.57.541.89.250.2]Fig. 2Performance of enhancer classifiers in murine ESC and across different cell types and species.APrecision-recall curves for CRUP-EP (light orange lines) and REPTILE (light blue lines) trained on an mESC sample (mESC+) and tested on ten randomly sampled independent test sets. The curves for the best performances are highlighted in darker colors (area under the curve AUC-PR: CRUP-EP=0.95, REPTILE=0.94). Additionally, the performance results of different ChromHMM segmentations for the same ten test sets are depicted (gray shapes).BChromHMM emission probabilities for mESC using five and eight chromatin states, ranging from 0 (white) to 1 (dark blue).CCRUP-EP was trained on and applied to samples from different cell types and species (human hepatocytes (a–c), mESC (d), mouse adipocytes (e–h), mouse fibroblasts (i, j), mouse hepatocytes (k, l)). The result can be summarized in a 12×12 heatmap where each entry is shaded according to the computed AUC-PR (in percent). The origin of the training data can be found in the rows and the origin of the test sets in the columns. The diagonal shows the performance results on an independent test set within one sample. For instance, training and applying CRUP-EP in mESC+(highlighted in red) led to an AUC-PR= 0.93 based on the whole test set.DCRUP-EP was trained on samples from different cell types and species (seeC) and applied to mESC+. Shown are the number of predicted enhancers which are shared between all classifiers (“consensus”, orange) and which remain after excluding this consensus set (“without consensus,” blue). Additionally, mean probabilities are displayed for both classes, showing that all enhancer calls yield higher probabilities within the consensus set
becomes less prominent (39%= 19, 000 regions). On the other hand, bothCRUP-EPand REPTILE achieve similar results when predicting EnhancerAtlas regions (CRUP-EP: 45% = 13, 909 regions, REPTILE: 44% = 13, 841 regions). However, when comparing the enhancer calls using the same width, CRUP-EP is slightly superior com-pared to REPTILE (CRUP-EP, 52% = 16, 095 regions).
Additionally, we investigated the distribution of our CRUP-EP enhancer predictions in the genome by dividing the whole set into 13,426 singletons and 8618 enhancer clusters of varying length (see the “Enhancer peak calling and building of enhancer clusters” section). We compared
each enhancer cluster to a list of 927 super-enhancers (SEs) which was recently published by [38] and found that over 97% (907) of the SEs overlap with our enhancer clus-ters and almost all of them overlap with our complete non-clustered list of predicted peaks (924). This shows that CRUP-EP is well suited not only to recapitulate pub-lished enhancer regions but also to capture SEs and other regions with high enhancer density.
Enhancer predictions are stable across different cell types and species
[image:5.595.60.542.87.437.2]different samples from different cell types and species (summarized in Additional file1: Table S2) in the same fashion as described for mESC+above. We used each of the classifiers to predict active enhancers on the test sets of the remaining 11 samples and calculate the AUC-PR, resulting in a 12×12 AUC-PR matrix which is depicted in Fig.2c (for corresponding AUC-ROC results, see Addi-tional file1: Figure S10). Within one sample, training and test sets are independent following the logic described in the “Definition of the training and feature sets” section).
All classifiers perform well regardless of the test set they are applied to (AUC-PR∈[ 0.68, 0.93]). Interestingly, the performances seem to correlate more with the test set than with the training set origin, as can be observed in a vertical trend of the AUC-PR values in Fig. 2c. For instance, the lowest AUC-PR value with a minimum of 0.68 is achieved when using one of the mouse fibroblast samples as a test set. On the other hand, when train-ing the classifier on any mouse fibroblast sample and testing on a high-quality sample (see Additional file 1: Figure S11 for quality assessment), such as mESC+, the performance is very good (AUC-PR∈[ 0.91, 0.92]). Also, training and prediction within the same sample (diagonal entries) rarely result in the best prediction performance for the corresponding classifier.
Additionally, we trained classifiers separately based on all cell types and species and applied these to mESC+, leading to an average of 47,719 predicted enhancer regions (see Fig.2d). By overlapping all enhancer calls, we defined a consensus set of 25,986 regions. We found that all enhancer calls yielded high mean probabilities within the consensus set (in the range from 0.73 to 0.85). On the other hand, enhancer calls excluding the consensus set yielded much lower probabilities (in the range from 0.57 to 0.61). This shows that high-confidence enhancer calls with high probabilities can be recapitulated when training on another tissue or species.
Overall, the best performances across all cell types and species could be achieved when testing on the mESC+ sample (AUC-PR ∈[ 0.86, 0.93]). Hence, we use the mESC+-trained classifier as the pre-trained model provided in CRUP-EP, which can readily be applied to new ChIP-seq histone modification data.
Next, we employed the same analysis using REPTILE, and the resulting AUC-PR matrix (Additional file 1: Figure S12A) shows that CRUP-EP outperforms REP-TILE for most of the combinations of different training and test sets. In addition, we trained REPTILE classifiers for several other settings and used available pre-trained REPTILE classifiers (see the “Application of REPTILE” section) to make predictions across the 12 samples. This lead to similar or slightly worse results on the FANTOM5-based test set than when trained on our data (Addi-tional file1: Figures S12 and S13).
In addition to validating the transferability of our approach on defined test sets, we applied the 12 differ-ent classifiers described above, trained on various tis-sues, to mESC+ HMs and compared the predictions with the EnhancerAtlas database [25]. To quantify the overlap between the EnhancerAtlas predictions and the CRUP predictions based on the 12 different training sets, we applied chi-square tests of independence (see the “Chi-square test of independence” section). The largestp
value we achieve is 5.61e−12when using predictions based on mouse hepatocyte #2, which, yet again, reflects the poor quality of the underlying ChIP-seq histone modifi-cations. Overall, all chi-square tests lead to a significant result, meaning that each of the 12 separately trained classifiers can clearly recognize mESC enhancers in agree-ment with the EnhancerAtlas database.
In this context, we also explored the effect of the feature normalization procedure which is integrated in CRUP-EP (see the “Preparation and normalization of HM counts” section). To do so, we artificially reduced the number of reads in our mESC+ sample to mimic different lev-els of quality and applied our classifier with and without normalization. The high deviation between the predicted probabilities (in the range of 0.5) demonstrates the impor-tance of a proper normalization to ensure comparability especially between different levels of data quality (Addi-tional file 1: Figure S14). This observation can also be confirmed when applying the same analysis to two (not manipulated) healthy mouse fibroblast samples (see the
“Methods” section). The normalization has a positive
effect on the comparability of the enhancer probabili-ties which are based on samples with varying quality (see Additional file1: Figures S11 and S15).
Identification of condition-specific enhancers
In the following, we will focus on enhancer regions that are, generally speaking, different in at least one out of many conditions regardless of the number of analyzed conditions. A more detailed explanation on how we are inferring these differential (“condition-specific”) enhancer regions is given in the “Statistical inference of differences between two conditions” section.
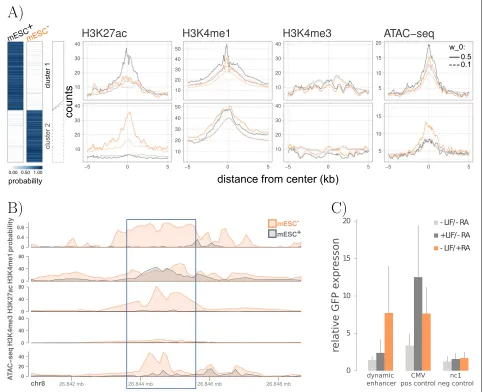
From the predicted condition-specific enhancers, a total of 186 are only active in mESC+ (cluster 1) and 141 regions are predicted to be active solely in mESC− (clus-ter 2). The differential assignment of predicted enhancers can be further corroborated by ChIP-seq read count dis-tributions (Fig. 3a, also shown for a single differential region in Fig.3b). The signal for the active enhancer marks H3K27ac and H3K4me1 is higher in mESC− (orange) compared to mESC+(gray) for the displayed regions in cluster 2. The same trend can also be observed when investigating chromatin accessibility for the two data sets which becomes detectable via additional ATAC-seq experiments (right panel Fig.3a, bottom panel Fig. 3b). Further, we investigated the effect of the parameterw0 which is the tested minimum difference in the group aver-ages used in the permutation test (see the “Statistical infe-rence of diffeinfe-rences between two conditions” section). By using a much less sensitive value forw0(w0=0.1, default:
w0 = 0.5), we increase the total number of dynamic enhancer regions (5776 in cluster 1 and 4357 in cluster 2), while the overall trend in the count distributions remains the same. However, the peaks are less prominent com-pared to using the default value ofw0, suggesting that the identified regions are less reliable.
To further evaluate the two differentially active enhancer clusters, we performed a motif enrichment anal-ysis for both groups (see the “Motif enrichment analysis” section), taking the union of all differential enhancers as the basis for the estimation of the background model. The complete list of differentially enriched motifs is depicted in Additional file 1: Figure S16. Using the functional annotation tool DAVID [39, 40], we could identify sev-eral transcription factors that show a higher binding site enrichment in cluster 1 and are part of the signaling pathways regulating pluripotency of stem cells (OCT4, HNF1A). In the same way, TFs that are more enriched in the RA-specific cluster 2 were found to be linked to the functional categories differentiationand/or developmen-tal protein(ASCL1, Myod1, Myog, NHLH1, NR2C2). Fur-thermore, we found retinoic acid receptors (heterodimers) in our list of differential transcription factor binding sites (TFBSs) for cluster 2, namely RARA::RXRG and RARA::RXRA [41–43]. As an example, we chose a pre-dicted RA-specific enhancer containing a retinoic acid receptor binding motif, occupancy based on ChIP-seq and increased ATAC-seq signal upon activation of the receptor (Fig.3b).
One way to validate the specific enhancer regions is to use STARR-qPCR, where a reporter plasmid allows direct assessment of enhancer activity by quantification of the reporter gene transcript levels (see the “Enhancer reporter
assay (STARR-qPCR)” section). We compared our
pre-dicted enhancer regions which we found to be differential between mESC+ and mESC− to an independent list of
16 enhancers which were validated by STARR-qPCR. We could find an overlap of 2 enhancer regions, one is specif-ically activated upon retinoic acid treatment (mESC−) the other one in LIF-induced cells (mESC+). Consistent with our prediction, we observed RA-specific enhancer activity for one region (Fig.3c) whereas the other region recapitu-lated the condition-specific activity of the LIF-dependent enhancer (Additional file1: Figure S17).
Correlation of dynamic enhancers to target genes
By including RNA-seq experiments (see the “Methods” section), we utilize CRUP-ET (enhancer targets) to link dynamically changing enhancers to putative target genes. To do so, we calculate Pearson’s correlation coefficients between enhancer probabilities of a differential enhancer region across all samples and normalized expression counts of promoters that are located within the same TAD (see the “Regulatory units by a correlation approach” section). We further describe the dynamically changing gene-enhancer pairs with a high correlation coefficient as
regulatory units.
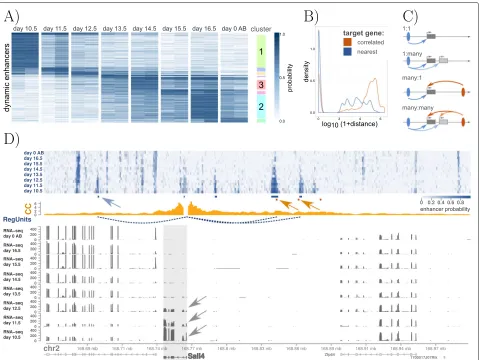
We applied CRUP-EP and CRUP-ED (withw0 = 0.3) to predict enhancers and assign them to different con-ditions in a time-series experiment performed in mouse embryo midbrain, spanning 8 time points in total [35]. This results in 1170 differentially active enhancers that could be grouped and summarized into 91 different clus-ters using activity pattern (see the “Clustering of diffe-rential enhancers using “activity pattern”’;’ section). Eight of these clusters are specific just for 1 condition and are added to the visualization (Fig.4a).
Using CRUP-ET, we build 111 regulatory units (corre-lation coefficient≥0.9) describing putative dependencies between differential enhancer regions and target genes located within the same TADs (see the “Processing of
HiC-seq experiments,” section for a description of the
TAD calling strategy). Altogether, the majority of the iden-tified differential enhancers (∼ 77%) are located in gene-free regions, whereas the range of gene-enhancer pair distances is very heterogeneous (here, between 192 and 2,163,000 bp), and the nearest gene is not automatically the best choice for a target (see Fig.4b).
We further analyze the connections between one or many enhancer and one or many promoters as schemati-cally explained in Fig.4c. Half of the regulatory units con-sists of single dynamic enhancer elements which are inter-acting with only one putative target gene (1:1, 56/111). A small proportion of the regulatory units rather describe genes that are correlated to multiple differential enhancers at once (many:1, 12/111). Interestingly, several target genes seem to be regulated by the same enhancer region (1:many, 43/111) which was also observed by [44].
Fig. 3Differential enhancers in murine stem cell differentiation.aDifferential enhancer regions of pluripotent (mESC+, gray) and differentiated (mESC−, orange) cells are colored by their respective enhancer probabilities. All regions can be divided into two clusters according to their differential activity pattern. Count distributions of HM ChIP-seq and ATAC-seq read counts recapitulate the dynamic behavior in both clusters. The same trend can also be observed when using a less sensitive setting in the test statistic with a minimum group difference ofw0=0.1 (default: w0=0.5).bAn example for a dynamic enhancer region (chr8:26, 843, 601–26, 845, 600, highlighted in blue) which was predicted to be active in the differentiated mESC−but not in the pluripotent mESC+.cThe predicted differential enhancer sequence was tested using an enhancer reporter assay (STARR-qPCR). The difference in the transcript levels of the GFP reporter between mESC−(−LIF/+RA) and mESC+(+LIF/−RA) as well as compared to an untreated sample (−LIF/−RA) recapitulates the predicted dynamic activity. The LIF-inducible viral enhancer CMV serves as a positive control. As a negative control, we chose nc1, which is not active in mouse embryonic stem cells.
dynamic gene expression ofSall4(Fig.4d), a known regu-lator in early embryonic development [45]. Note, that one of these enhancers lies in the intronic region of another gene and the other two enhancers are in closer proximity to the geneZfp64, which does not show the same dynam-ics as seen in the enhancer probability values. This further supports the observation that the gene located nearest to an enhancer is not automatically the best target. We vali-date the results with a CaptureC-seq (CC) experiment as exemplified by [32]. Here, we use interaction counts of mouse embryo midbrain CaptureC-seq data at day 10.5 with the viewpoint located at the promoter region of
Sall4(see the “Capture-C experiments for mouse embryo
midbrain” section). Two differentially active enhancer
regions are in close proximity to two of the three reported CC peaks, and one additional region could only be found with our CRUP framework, which also show a slight increase in the interaction profile via visual inspection.
Regulatory units are well recapitulated by 3D chromatin structures
[image:8.595.57.541.89.481.2]Fig. 4Dynamic enhancer-gene pairs in mouse embryo midbrain.aDynamic enhancer regions, colored by their respective enhancer probability, for eight time points (day 10.5 to day 0 after birth (AB)) in mouse embryo midbrain. A clustering was performed based on the pairwisepvalues. Enhancer regions that are active in just one condition are highlighted on the right site of the plot.bDistances between dynamic enhancers and their correlated genes (orange) and the respective nearest genes (blue) show the strong discrepancy between the two strategies to find putative enhancer targets.cSchematic description of possible relationships between (1 or many) enhancers and (1 or many) target promoters.dEnhancer probability tracks of the eight time points are summarized on top. Seven differential enhancers could be assigned across all conditions (blue-shaded rectangles). Of these, enhancer probabilities of three regions (dotted blue arcs) highly correlate (correlation coefficient≥0.9) with the gene expression ofSall4(bold, gray arrows), a gene that regulates early embryonic development. CaptureC-seq data (CC) of mouse embryo midbrain at day 10.5 (yellow histogram) visually recapitulate these regulatory units. Two of three interaction peaks agree with our dynamic regulatory unit regions (yellow arrows). Additionally, one regulatory unit could be identified solely with CRUP (blue arrow)
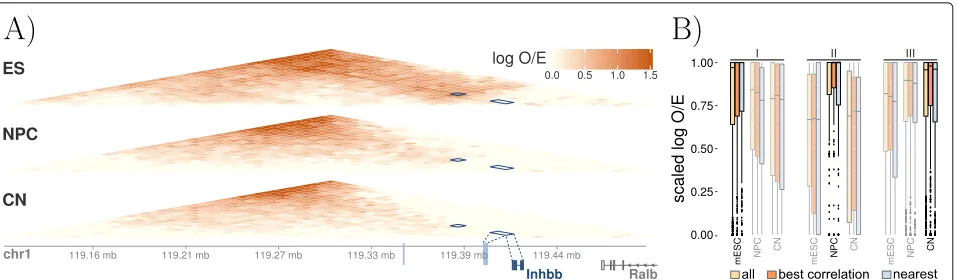
regulatory elements, we analyzed ultra-deep coverage Hi-C maps. We applied Hi-CRUP to a (pre-processed) data set focusing on neural differentiation and cortical develop-ment in mice [31] comprising ChIP-seq, RNA-seq, and Hi-C experiments (see the “Methods” section) across three developmental states: embryonic stem cells (ES), neural progenitor cells (NPC), and cortical neurons (CN). We inferred 8810 regulatory units (with a minimum threshold for the Pearson correlation coefficient of 0.7) and compared our results to log2 observed/expected (O/E) normalized Hi-C interaction matrices. Figure 5a shows a single regulatory unit, where two ES-specific enhancer regions are linked to the geneInhbb, which was
[image:9.595.61.540.85.445.2]Fig. 5Differential regulatory units across mouse neural differentiation.aInteraction matrices (log O/E) of three Hi-C experiments of mouse embryonic stem cells (ES), neural progenitor cells (NPC), and cortical neurons (CN). A differential regulatory unit is indicated with dark blue rectangles, showing the interaction of two dynamic active enhancer regions (light blue) and the correlated geneInhbb.bDifferentially active enhancers were filtered for regions that are only active in ES (I), only active in NPC (II), and only active in CN (III). For these regions, normalized (log O/E) chromatin interaction counts that overlap the predicted differential regulatory units were re-scaled to [ 0, 1], such that the highest interaction count for each region is 1. The results of all regulatory units (yellow) are compared to a subset where just target genes with the highest correlation were taken into account (orange). Additionally, for each differential enhancer in this subset, the nearest gene was also taken as an alternative target (blue). All three methods reflect the expected dynamic behavior, meaning that the scaled interaction counts are close to 1 for the respective highlighted condition but lower in the other two conditions. It also becomes apparent that choosing the closest gene as a target might not always be the best choice as can be seen for the regions I and II
organization. Additionally, we created a subset of all regu-latory regions where the gene with the highest correlation coefficient is chosen as the only target gene. We then com-pared the chromatin interaction counts overlapping this subset of 2537 regulatory regions to an alternative strategy where not the best correlating gene is chosen as the target but the gene that is nearest to the differential enhancer. As shown in Fig.5b, choosing the closest gene to define a regulatory unit does not always lead to the best results.
Regulatory units in the context of a rheumatoid arthritis model
So far, we evaluated our proposed framework CRUP to create condition-specific regulatory units on experiments focusing on developmental changes. Next, we apply CRUP to a complex disease study which is part of the German Epigenome Program [27], with the aim to suggest regula-tory differences between two healthy mice and two mice which are affected by destructive rheumatoid arthritis (Rh. Arth.-like, see the “Methods” section), an autoimmune inflammatory disease [46].
We performed a motif analysis on 212 differential enhancer regions (with w0 = 0.3) as described in the “Motif enrichment analysis” section. The TF motifs for KLF4, IRF1, SPI1, PLAG1, and USF1 show higher enrich-ment in the cluster which contains enhancers that are solely active in the Rh. Arth.-like samples and were already shown to be connected (directly or indirectly) to rheuma-toid arthritis [47–52]. A list of all enriched motifs is given in Additional file1: Figure S18.
We identified 268 differential regulatory units of which 78.7% (211) describe gene-enhancer pair activity that can only be found in the affected mice. A pathway anal-ysis was performed on all putative disease-associated target genes using the Kyoto Encyclopedia of Genes and Genomes (KEGG) [53–55], a curated database of molecular pathways and disease signatures (see the
“KEGG pathway analysis” section). The top 5
result-ing KEGG pathways (Table 1) have been previously (directly or indirectly) associated with rheumatoid arthritis [56–60]. A complete list of all predicted
gene-enhancer pairs associated with at least 1
of the top 5 KEGG pathways can be found in Additional file1: Table S7.
One example of an Rh.Arth.-like specific enhancer-gene pair is shown in Fig. 6, where the correlated putative target gene Cxcr4 is part of the most sig-nificant KEGG pathway (chemokine signaling path-way). Interestingly, the TF motif for interferon regula-tory factor 1 (IRF1), which was enriched in the whole Rh.Arth.-like specific enhancer cluster, is also signifi-cantly enriched in the shown differentially active enhancer region (empiricalpvalue, 3.293121e−6; fold enrichment: 18.77985) and was previously connected to rheumatoid arthritis [48].
[image:10.595.62.540.86.226.2]Table 1KEGG pathway analysis results
Pathway ID Pathway N Number of genes pvalue
path:mmu04062 Chemokine signaling pathway 20 11 1.512658e−05
path:mmu04380 Osteoclast differentiation 16 9 7.628621e−05
path:mmu05168 Herpes simplex virus 1 infection 16 9 7.628621e−05
path:mmu05163 Human cytomegalovirus infection 17 9 1.428006e−04
path:mmu04621 NOD-like receptor signaling pathway 8 6 1.466646e−04
Shown are the top five KEGG pathways overrepresented in the putative target genes which are highly correlated with enhancer regions solely active in the samples with destructive arthritis (genes). The list is sorted by thepvalue for overrepresentation (Nis the number of all genes in the respective pathways)
Discussion
In this work, we described the three-step framework Condition-specific Regulatory Units Prediction (CRUP) to identify enhancer regions in a genome-wide manner, assign the predicted enhancers to different conditions, and subsequently correlate the differential enhancers to putative target genes within their topologically associated domain to build condition-specific regulatory units.
We showed that our random forest-based enhancer classifier CRUP-EP is reliable, also when applied across different cell types and species without the need for re-training, solely depending on three core HMs. Our results show that the prediction performance of CRUP-EP across different cell types and species depends rather on the test than on the training data. We speculate that differences in ChIP-seq quality for certain training regions can be tolerated during the learning process and are not crucial for finding enhancer-specific HM pattern. However, for test regions, poor ChIP-seq signals very likely result in a decrease of performance. Another factor is the quality of the active enhancers which we defined based on the FAN-TOM5 database (see Additional file1: Table S4). While
some weak or even mislabeled enhancers (false positives) in the training set still allow for a good enhancer represen-tation by the classifier in terms of HM signals, mislabeled enhancers in the test set lead to false-negative predictions and thus directly reduce the recall results. Further, the highest number of suitable FANTOM5 experiments for a confident enhancer definition was available for the mESC data set, which shows the best test set performance for almost all classifiers.
We further showed that our enhancer classification approach outperforms the unsupervised genome segmen-tation tool ChromHMM and is comparable to another state-of-the-art random forest-based approach, REPTILE. In terms of transferability across different cell types and species, our classification approach even outperforms REPTILE. Although the basic concept of the two ran-dom forest-based methods is similar, essential differences lead to a slightly better performance of CRUP. One major advantage is to split the enhancer prediction into two separate tasks which we demonstrated by training a com-bined random forest and comparing the prediction results on active test set enhancers and promoters to CRUP-EP.
[image:11.595.57.541.505.672.2]We found that the two-tier random forest setup has on average higher predicted probabilities for the enhancers and lower for the active promoters. Furthermore, we spec-ulate that the main contribution to the resolution perfor-mance of CRUP-EP comes from the fine-scaled feature set which captures the structure of an active region at a high resolution according to the observed feature importance. This became most apparent when comparing the spatial resolution to REPTILE based on the exact same train-ing and feature setttrain-ing. Another reason for the varytrain-ing performance results between REPTILE and our classifier across cell types/species could lie in the different normal-ization strategies. REPTILE does not offer an integrated normalization across several samples but instead gives recommendations how to prepare the input data which we followed in our comparative analysis. We show that a quantile normalization to the corresponding distribu-tion of the data set used for training is crucial to achieve similar distributions of genome-wide probabilities, espe-cially when comparing data sets of different quality. We therefore incorporated this in our framework.
In the second step, CRUP-ED, we assign enhancers to different conditions using a permutation test on the enhancer probabilities obtained by the first module of CRUP. This approach can be applied to more than two conditions as the test is performed in a pair-wise manner. Using the resultingpvalues, we are able to create an activ-ity pattern for each single bin which can then be used to combine and cluster all differentially active regions. We demonstrate that the assignment of clusters across dif-ferent conditions is in good agreement with HM counts as well as with independent ATAC-seq data. Additionally, we could validate one candidate RA-specific and one LIF-specific enhancer region by STARR-qPCR which confirms our findings.
Limitations arising from the raw data and from the enhancer prediction approach are consequently also reflected in the predicted differential enhancer regions. For instance, due to poor quality of individual HM ChIP-seq experiments, the enhancer predictions might vary across samples in one condition and could therefore influ-ence the results in the permutation test. Increasing the number of replicates could be one way to overcome this drawback since the implemented weighted differ-ence between two conditions benefits from an enhanced sample size.
Lastly, we utilize CRUP-ET to integrate further genomic information, obtained from RNA-seq and Hi-C experi-ments, to link condition-specific enhancers to putative target genes. To this end, we compute the correlation between normalized gene expression counts and enhancer probability values across all samples within the same TAD and put a strict threshold on the results to build high-confidence regulatory units. Next, we evaluate our results
by comparing regulatory units with Capture-C and Hi-C experiments. We could show that our inferred condition-specific gene-enhancer pairs are well recapitulated by physical dynamics in chromatin structures. To reduce the search space of interacting promoter/gene-enhancer pairs, we use TADs as a more sophisticated approach to form regulatory units rather than simply applying a distance-based window. We show that the range in which differential enhancers and putative target genes are con-nected varies and that the nearest gene is often not the gene with the highest correlation. The resolution of Hi-C-based experiments is still not on a single base pair level and might lead to wrongly associated promoter/gene-enhancer pairs, especially because the approach is also highly dependent on the performance of the TAD call-ing algorithm. We are utilizcall-ing TADs from murine stem cell experiments, to reduce the search space for detect-ing regulatory units for all the presented examples. We argue that these structures are highly stable across cell types and conserved in related species as observed in recent studies [18, 61]. However, it was also shown that structural differences between conditions occur, espe-cially on a low-scale sub-TAD level [31]. Furthermore, the 3D landscape may change dramatically when structural variations disrupt the boundary structure as for exam-ple shown by [62]. In the future, condition-specific Hi-C experiments could further help the presented approach in linking differentially active enhancers to putative target genes.
The complete framework was further applied to a com-plex disease study to identify differential regulatory units associated with rheumatoid arthritis. By applying a motif analysis to the resulting differentially active enhancers, we were able to connect several regions to TF motifs that are linked to the disease. In combination with a standard KEGG pathway analysis on the putative target genes, we could show that our framework is well suited to iden-tify candidate regulatory regions that behave differently depending on the disease state. To further validate these regions, additional follow-up experiments could comple-ment the presented analysis.
Conclusions
In summary, we presented the three-step framework Condition-specific Regulatory Units Predictions (CRUP) to identify and assign differentially active enhancer regions in different states and link them to putative target genes within the same topologically associated domain.
The presented software is user-friendly as it aims to overcome the time-consuming difficulties when compar-ing scompar-ingle read count tracks for several features and con-ditions. The framework is implemented in R and can be executed by solely providing mapped read counts for ChIP-seq and RNA-seq experiments.
Our pre-trained classifier can be used without the need of re-training and also outperforms the existing methods especially when applied across various tissues and species. The resulting dynamically changing enhancer-gene pairs are in good agreement with 3D interactions and can be used to further complement studies that aim to unravel dynamic epigenetic behavior across different conditions.
Methods
Cell culture and isolation
Mouse embryonic stem cells
E14 mouse embryonic stem cells (mESCs) were cultured and routinely passaged every 2 days in ES medium plus leukemia inhibitory factor (LIF) in order to maintain the pluripotent state of the cells [63, 64]. To exit from pluripotency and push the cells towards differentiation, LIF was withdrawn and retinoic acid (RA) was added to the medium for a short pulse of 4 h.
All experimental data related to these samples are acces-sible via Gene Expression Omnibus (GEO:GSE120376).
Mouse synovial fibroblasts
Murine synoial fibroblasts (SF) were isolated by enzy-matic digestion from the hind paws of 12-week-old hTN-Ftg(reactive arthritis, strain Tg197-overexpressing human TNF) and wildtype (healthy control) as described before [65,66].
Mouse adipocytes
Samples for adipocytes were isolated by collagenase treat-ment for 5 min followed by 5 min of collagenase inactiva-tion as described before [67]. After centrifugation, the fat layer was collected.
Mouse hepatocytes
Primary mouse hepatocytes were obtained from two female mice (C57BL/6J x DBA/2 background) at the age of 9 weeks. The isolation of primary mouse hepatocytes was performed by a two-step EDTA/collagenase perfusion technique as described by [68].
Human hepatocytes
Primary human hepatocytes were obtained from three different female donors (age 28–70 years) undergoing
surgery due to primary or secondary liver tumors. Hepa-tocytes were isolated from healthy liver tissue remaining from liver resection as described in [68]. Informed con-sent of the patients for the use of tissue for research purposes was obtained, and experiments were approved by the local ethical committees.
Processing of histone modification ChIP-seq data
For all biological samples presented in this study, ChIP against six core HMs, H3K27ac, H3K27me3, H3K4me1, H3K4me3, H3K36me3, and H3K9me3, was performed. As a control served the sheared chromatin without antibody (input). We utilized the tool plotFingerprint which is part of the deepTools project [69] to assess quality metrics for all ChIP-seq experiments.
Where we need to visualize read count enrichments in particular genomic regions, we employ the tool plotHe-atmap which is also part of the deepTools project [69].
Mouse embryonic stem cells
6×10⁵low passage (< 10) E14 cells were cultivated for 48 h in regular ES medium containing LIF. Four hours prior to cross-link, cells were treated with LIF or RA. Sequencing libraries were prepared, and the resulting DNA fragments were paired-end 50 bp sequenced on a Illumina HiSeq 2500 device. Raw sequencing reads were subsequently aligned to the genome assembly GRCm38
with STAR [70], and duplicates were removed using Picard tools [71].
Mouse synovial fibroblasts
ChIP-seq from 2×10⁶cells was carried out as described before [67]. Resulting DNA fragments were paired-end 50 bp sequenced on a Illumina HiSeq 2500 device, and raw sequencing reads were aligned to the genome assembly
GRCm38using BWA-MEM [72,73], and duplicates were removed using Picard tools [71].
Mouse adipocytes
For mouse adipocytes, chromatin from fixed cells has been extracted and sonicated for 15 min using Covaris S220 sonicator. Resulting DNA fragments were paired-end 50 bp sequenced on a Illumina HiSeq HiSeq 2500 device. Raw sequencing reads were aligned to the genome assemblyGRCm38with BWA-MEM [72,73], and dupli-cates were removed using Picard tools [71].
Mouse hepatocytes
Human hepatocytes
ChIP-seq was performed using 1×10⁶ primary human hepatocytes as was previously described [74] with minor modifications. All six ChIP and input libraries from each sample were then pooled and paired-end sequenced on an HiSeq 2500 device. Raw sequencing reads were aligned to the genome assemblyhs37d5 with BWA-MEM [72,73], and duplicates were removed using Picard tools [71].
Mouse embryo midbrain
Raw reads from ChIP-seq experiments were downloaded from GEO (GEO:GSE88517 [35]) and aligned to the genome assemblyGRCm38with BWA-MEM [72,73], and duplicates were removed using Picard tools [71].
Samples in the context of mouse neural differentiation
Raw data from RNA-seq for the three in vitro-generated murine cell types ES, NPC, and CN were downloaded via GEO (GEO:GSE96107 [31]) and aligned to the genome assembly GRCm38 with BWA-MEM [72, 73]. Mapped reads of biological duplicates were pooled, and duplicates were removed using Picard tools [71].
Processing of RNA-seq experiments
Mouse embryonic stem cells
2 × 10⁵ low passage (< 10) E14 cells were plated and cultivated for 48 h in regular ES medium containing LIF. Four hours prior to harvest, the medium was exchanged and cells were treated with LIF or RA. Cells were har-vested, and three biological triplicates were subjected to RNA extraction. Sequencing libraries were generated from total mRNA input, and high-throughput sequenc-ing was performed on an Illumina HiSeq 2500 device resulting in 50-bp paired-end reads. Raw reads were sub-sequently mapped to the mouse genome buildGRCm38
using BWA-MEM [72,73].
Mouse synovial fibroblasts
Long RNA libraries were prepared from total mRNA input and sequenced on an Illumina HiSeq 2500 device result-ing in 50-bp- and 100-bp-long paired-end reads. Raw reads were subsequently mapped with TopHat2 [75] to the mouse genome buildGRCm38.
Mouse adipocytes
RNA isolation for cells was performed using 1 ml TRIzol per sample followed by isopropyl alcohol/ethanol precip-itation. Sequencing libraries were generated from total mRNA input, and high-throughput sequencing was per-formed on an Illumina HiSeq 2500 device resulting in 100-bp paired-end reads. Raw reads were mapped with TopHat2 [75] to the mouse genome buildGRCm38
Mouse hepatocytes
RNA was extracted from∼5×10⁶hepatocytes homoge-nized in 1 mL Trizol. Sequencing libraries were generated
from total mRNA input using TruSeq v3 Kit (Illumina) according to the manufacturer’s instructions and high-throughput sequencing was performed on an Illumina HiSeq 2500 device resulting in 100-bp paired-end reads. Raw reads were mapped to the mouse genome build
GRCm38using BWA-MEM [72,73].
Human hepatocytes
RNA was extracted from∼5×10⁶hepatocytes homoge-nized in 1 mL Trizol. Sequencing libraries were generated from total mRNA input using TruSeq v3 Kit (Illumina) according to the manufacturer’s instructions, and high-throughput sequencing was performed on an Illumina HiSeq 2500 device resulting in 100-bp paired-end reads. Raw reads were mapped with TopHat2 [75] to the genome buildhs37d5.
Mouse embryo midbrain
Raw reads from RNA-seq experiments were downloaded from GEO (GEO:GSE88517 [35]) and aligned to the genome assemblyGRCm38with STAR [70].
Samples in the context of mouse neural differentiation
Raw data from RNA-seq for the three in vitro-generated murine cell types ES, NPC, and CN were downloaded via GEO (GEO:GSE96107 [31]) and aligned to the genome assembly GRCm38 with BWA-MEM [72, 73]. Mapped reads of biological duplicates were pooled and sub-sequently filtered for a minimum mapping quality of MAPQ = 10. Duplicates were removed using Picard tools [71].
Processing of DNase-seq experiments
To compare open chromatin sites to HM signals, read counts from DNase-seq experiments were summarized for adjacent 100-bp bins using the R package bamPro-file [76]. Read count enrichments are visualized with the plotHeatmap funciton implemented in the software pack-age deepTools [69].
Mouse embryonic stem cells
Raw reads from DNase-seq experiments from mESCs (E14, embryonic day 0) were downloaded from GEO (accession Nr.:GSM1014154) and aligned to the genome assemblyGRCm38with BWA-MEM [72,73]. Duplicates were further removed using Picard tools [71].
Mouse synovial fibroblasts
5−7×10⁶nuclei were digested with DNaseI in five dif-ferent dilutions as described before [77]. Raw sequencing reads were aligned to the genome assemblyGRCm38with BWA-MEM [72,73], and duplicates were removed using Picard tools [71].
Mouse adipocytes
of DNaseI as described before [77] and kept at 4 ◦C until further processing. Sequencing libraries were pre-pared and sequenced on an Illumina HiSeq 2500 device resulting in 100-bp-long paired-end reads. Raw sequenc-ing reads were aligned to the genome assemblyGRCm38
with BWA-MEM [72, 73], and duplicates were removed using Picard tools [71].
Mouse hepatocytes
The nuclei extracted from∼10×106nuclei by treatment with IGEPAL were digested with different concentrations of DNaseI as described before [77] and kept at 4 ◦C until further processing. Sequencing libraries were pre-pared and sequenced on an Illumina HiSeq 2500 device resulting in 100-bp-long paired-end reads. Raw sequenc-ing reads were aligned to the genome assemblyGRCm38
with BWA-MEM [72, 73], and duplicates were removed using Picard tools [71].
Human hepatocytes
The nuclei extracted from∼10×106nuclei by treatment with IGEPAL were digested with different concentrations of DNaseI as described before [77] and kept at 4◦C until further processing. Sequencing libraries were prepared and sequenced on an Illumina HiSeq 2500 device resulting in 100-bp-long paired-end reads. Raw sequencing reads were aligned to the genome assemblyhs37d5with BWA-MEM [72,73], and duplicates were removed using Picard tools [71].
Processing of ATAC-seq experiments from mESC
2×10⁵low passage (< 10) E14 cells were cultivated for 48 h in regular ES medium containing LIF. Four hours prior to harvest, cells were treated with LIF or RA (1μM). Seventy-five thousand cells per treatment were subjected to transposition reaction and PCR amplification of acces-sible regions by Omni-ATAC-seq as described previously by [78]. Sequencing libraries were constructed, and DNA fragments were paired-end 50 bp sequenced on a Illumina
HiSeq 4000device. Raw reads were subsequently aligned to the mouse genome build GRCm38m using BWA-MEM [72,73], and duplicates were removed upon filtering using SAMtools [79]. ATAC-seq peaks were idenitfied using MACS2 [80].
Enhancer reporter assay (STARR-qPCR)
STARR-qPCR was performed by amplifying the region of interest by nested PCR from genomic DNA derived from E14 cells using standard PCR procedures. The negative (GR responsive element) and positive (CMV enhancer) control regions were ordered as gBlocks (IDT). DNA fragments were subsequently cloned into the STARR-seq screening vector (Addgene #71509 [30]) using In-Fusion HD Cloning Kit (Takara/Clonetech). This reporter plas-mid allows direct assessment of enhancer activity on
transcription by quantification of the GFP reporter gene transcript levels. For transfection of reporter plasmids, E14 mouse ESCs were plated at density of 2.5 × 10⁴ cells/well of a 24-well plate with ESC medium supple-mented with 20% FBS and LIF. The next day, cells were washed with PBS and fresh ESC medium was added. Subsequently, cells were transfected with correspond-ing reporter plasmid uscorrespond-ing Lipofectamin 200 (Invitrogen) according to the manufacturers’ instructions. Twenty-four hours after transfection, cells were harvested and sub-jected to RNA extraction (RNeasy Mini Kit, Qiagen), followed by cDNA synthesis (PrimeScript RT Reagent Kit, Takara, using oligodT and random hexamer primers). Reporter transcript levels were quantified by qPCR with primers specific for GFP and normalized to the expression of two housekeeping genes (Rpl19 and Actb).
The experiments were conducted for three biological replicates and standard qPCR methods with technical duplicates.
Processing of HiC-seq experiments
The Juicertools commanddump[81] was used to extract data from Hi-C archives associated with three in vitro generated murine cell types ES, NPC, and CN [31]:
• http://hicfiles.s3.amazonaws.com/external/bonev/ ES_mapq30.hic
• http://hicfiles.s3.amazonaws.com/external/bonev/ NPC_mapq30.hic
• http://hicfiles.s3.amazonaws.com/external/bonev/ CN_mapq30.hic
With this, each matrix is Knight-Ruiz (KR) normalized [82] at 10-kb resolution, and the observed/expected (O/E) ratio is computed. For visualization, O/E interaction maps were further log2 converted and negative values were set to 0. Additionally, topologically associated domains (TADs) were identified by utilizing TopDom [83] on 25-kb binned and KR-normalized matrix based on murine stem cells (ES) using a window of 750 kb (30× 25 kb) for the TopDom algorithm. These regions were used to reduce the search space for promoter/gene-enhancer interactions.
Capture-C experiments for mouse embryo midbrain Capture-C profiles from mouse embryo midbrain (day 10.5) were downloaded from GEO (GEO:GSE84795 [32]), and coordinates were transferred to the mouse genome build GRCm38 utilizing the function liftOver which is implemented in the R packagertracklayer.
CRUP-EP: enhancer prediction
Preparation and normalization of HM counts
packagebamProfile[76], following a log2input normaliza-tion (with pseudo count of 1) of the raw counts. We com-pute the log2ratio (also with pseudo count of 1) between H3K4me1 and H3K4me3 after shifting the distribution of their input-normalized count values to≥0.
Before making predictions on a sample with our clas-sifier, the input-normalized count values are quantile normalized to the corresponding distributions of the data used for training. This is done with the normal-ize.quantiles.targetfunction of the R package preprocess-Core[84].
In order to compare the effects of quantile normaliza-tion on the predicted probabilities, we randomly reduced the number of reads in the aligned ChIP-seq histone mod-ifications from our retinoic acid-induced mESC sample (mESC+) resulting in 10 to 90% of the original amount of reads usingsamtools[79].
Definition of high-confidence enhancer regions
One specific hallmark for enhancer activity was found to be the initiation of RNAPII transcription, which was used by the FANTOM5 project [36]. Short RNA-seq and CAGE were applied to a variety of different cell types and tissues to detect bidirectional capped transcripts. CAGE count data were downloaded for mouse adipocyte cells, mouse embryonic stem cells, mouse fibroblast cells, and human and mouse liver cells from
http://fantom.gsc.riken.jp/5/datafiles/latest/extra/ Enhancers/(expression count matrix).
Depending on the number of available replicates for each cell line, we chose different cutoffs for the CAGE counts to define the first set of putative enhancers accord-ing to the summary in Additional file 1: Table S4. To get our final high-confidence enhancer set, we centered the putative FANTOM5 enhancers based on DNase-seq peaks and discarded the enhancers without any overlap with DNase-seq peaks as summarized in Additional file1: Table S5. To convert the genome coordinates of the enhancer regions given by the FANTOM5 project from genome buildGRCm37toGRCm38, we applied the Batch Coordinate Conversion tool liftOver from the UCSC Genome Browser Utilities [85].
Definition of active and inactive promoter regions
For murine ESC, adipocytes, and liver and fibroblast cells, and for human liver cells, we computed FPKM gene expression values from RNA-seq data.
Based on the gene annotations from the Ensembl data base (GRCh37.70 and GRCm38.90), we defined a gene with an FPKM value greater than 2 as active and a gene with FPKM value of 0 as inactive (0<FPKM≤1 was not used for training). In case replicates were available, all of the replicates had to fulfill the chosen FPKM cutoff to be accounted to the one or the other class. An exemplary dis-tribution of FPKM values, here for mESC+, can be seen
in Additional file1: Figure S19. Building up on this, we then defined an inactive promoter as the 100-bp bin over-lapping the TSS of an inactive gene. An active promoter is defined as the 100-bp bin having an overlap with the TSS of an active gene as well as with a DNase-seq peak in the corresponding cell type. An overview can be found in Additional file1: Table S6.
Enhancer prediction based on random forests
We use a combination of two binary random forest clas-sifiers for our enhancer prediction, where both consist ofM = 100 decision trees. The first classifier (classifier 1) learns the difference between active genomic regions (active promoters, enhancers) and inactive genomic regions (inactive promoters, remaining intra- and inter-genic regions). The second one (classifier 2) learns to distinguish enhancers from active promoters, such that it gives the probability of a region to be an enhancer assuming it is an active region. The final enhancer proba-bility assigned to each 100-bp bin, binx, in the fragmented genome is computed as the product of both classifiers describing the joint probability that a region is active and an active enhancer at the same time:
P(binx=active enhancer)=P(binx=active)
classifier 1 ·P(binx=active enhancer |binx=active)
classifier 2
. (1)
Definition of the training and feature sets
In the two distinct training sets for classifiers 1 and 2, we emulate a typical genome composition as reported, e.g., in [86]. The training set of classifier 1 is composed of 10% enhancers, 5% active promoters, 5% inactive pro-moters, and 10% intragenic and 70% intergenic regions, summing up to 1000 regions in total. Classifier 2 is trained on 66.6% enhancers and 33.¯ 3% active promoters. Here, we¯ keep the same enhancer/promoter ratio and total num-bers than in the first training set, i.e., we always use 150 regions selected according to these rules. Overall, this also serves the purpose of adequately reflecting the imbal-ance between enhimbal-ancers and non-enhimbal-ancer regions in the genome.
The feature set, which is also chosen individually for the two classifiers, is derived from summed and normal-ized ChIP-seq read counts for the three core HMs. For classifier 1, we consider only H3K27ac, whereas for clas-sifier 2, we consider all three core HMs as well as the H3K4me1/me3 ratio.
features for classifier 1 and 11 · 4 = 44 features for classifier 2.
The number of neighboring bins N in the feature set and the number of decision treesMin the random for-est are parameters that we optimized according to the description in the following section.
Parameter tuning
We used fivefold cross-validation over 10 different train-ing seeds to find the optimal number of decision trees
M ∈ {20, 40,. . ., 200} and neighboring windows N ∈ {0, 1,. . ., 15}. Each of the 10 training sets used is cho-sen as described in the previous paragraph. Based on the AUC-PR (area under the PR curve) performances (see Additional file1: Figure S20, and also Additional file 1: Figure S21 for the AUC-ROC results), we fixed the combi-nation ofN=5 neighboring windows andM=100 trees for both classifiers. With the optimized parameter choice, we trained classifiers 1 and 2 on 2 final randomly sampled training sets which can have a possible overlap with the 10 training sets used for parameter tuning. The parameter setting ofN=5 andM=100 is used in all our analyses.
Combined random forest variant
In order to assess the advantage of training 2 separate random forests, we trained a single random forest classi-fier on the mESC+data set, which learns to distinguish enhancers from the rest of the genome in 1 step. This classifier is based on H3K27ac, H3K4me1, H4K4me3, and the ratio H3K4me1/H3K4me3 and also uses 100 decision trees and normalized read counts over 11 individual non-overlapping bins per HM as features. The training set consists of 10% FANTOM5-based enhancers representing the positive set, and 5% active promoters, 5% inactive pro-moters, and 10% intragenic and 70% intergenic regions in the negative set. In total, the training set sums up to 1000 regions.
Extreme gradient boosting
We replaced the two random forest classifiers in our framework by the very recent extreme gradient boost-ing approach “XGBoost” [37] to check for a possible improvement of performance. Specifically, we performed the comparison in the cross-validation step using the same tuning parameters as for the random forest, i.e., the num-ber of neighboring windows and the numnum-ber of decision trees (parameter name:nrounds). We used the R package “xgboost” [87] and trained the classifier with the default parameters.
Enhancer peak calling and building of enhancer clusters
Genome-wide predictions result in enhancer probability values for each 100-bp bin in the genome which are fur-ther summarized to define enhancer peaks. To this end, all bins with a probability≥0.5 are sorted in descending order according to their probability value and expanded
by five bins up and downstream resulting in a window length of 1100 bp. By going through the sorted list of high-probability regions, starting with the highest prob-ability, all windows that overlap the current window are discarded. This results in a sorted list of non-overlapping enhancer peaks with a length of 1100 bp.
Enhancer peaks are further summarized into enhancer clusters solely considering the distance between them (maximum distance of 12.5 kb), which partly reflects the definition of super-enhancers as stated by [26] and [88].
Definition of spatial resolution
We define the spatial resolution of a predicted enhancer as the distance between the center of the enhancer and the closest accessible region measured with ATAC-seq. We take either the ATAC-seq summit or the start/end posi-tion of the ATAC-seq peak as reference for the distance evaluation.
The spatial resolution of a set of predicted enhancers is defined as the median of the individual enhancer distances to the closest ATAC-seq peak. Here, we exclude enhancers that are more than 1 kb away from an accessible region from the median calculation.
CRUP-ED: enhancer dynamics
Statistical inference of differences between two conditions
Enhancer probabilities for all 100-bp bins and samples are collected in a matrixA= (Axi)whereAxicorresponds to binx in sample i. In the following, we denote byAC1 =
(Axi)i∈C1 the submatrix ofAwith columns corresponding
to samples from conditionC1(applies equally for condi-tionC2). As the number of samples in each group is usu-ally very small, we perform a non-parametric permutation test on the data set to compute an empirical distribution. This approach was already introduced in earlier studies, for example, by [89]. First, all enhancer probabilitiesAxi are shuffled, and the test statisticTxis then calculated for each binx to obtain the weighted difference between the two conditionsC1andC2:
Tx= μC
1−μC2−w0
S , (2)
whereμC1 =μ(AxC1)andμC2 =μ(AxC2)are the
respec-tive group means for binx. The parameterw0defines the minimum difference between them, and the tested null hypothesis can be formulated asH0: |μC1 −μC2| ≤w0.
We choosew0 = 0.5 as the default minimum group dif-ference (if not stated otherwise) since this would consider condition means ofμC1 = 0 andμC2 = 0.5 as