DESIGN AND ANALYSIS OF COMBINATORIAL PROTEIN LIBRARIES
CREATED BY
SITE-DIRECTED RECOMBINATION
Thesis by
Jeffrey B. Endelman
In Partial Fulfillment of the Requirements for the Degree of
Doctor of Philosophy
CALIFORNIA INSTITUTE OF TECHNOLOGY
Pasadena, California 2005
ABSTRACT
ACKNOWLEDGMENTS
I would like to begin by thanking my thesis advisor Frances Arnold. Her ability to maintain an open door policy and quickly provide feedback on manuscripts is remarkable for a professor managing 20 people. She has challenged me to think critically and communicate effectively. From proposals to progress reports, I have learned a lot from Frances about how research is funded. I appreciate the freedom she has given me to dictate the direction of my thesis research.
I am also extremely thankful for the many wonderful students Frances has attracted to her research group. Chris Otey and Michelle Meyer have been great collaborators and kind enough to share their data with me. Without them this thesis would not have been possible! Joff Silberg was a terrific mentor during my first year at Caltech, and he was even patient enough to teach me some molecular biology. Jesse Bloom and Allan Drummond have been my sounding board for ideas and have suggested several of the approaches used in this thesis. Working with Marco Landwehr has been a pleasure. The Arnold group has been much more than a professional home for me. They have been my friends and support group through the ups and downs of graduate school.
during the Synthetic Biology Competition of summer 2004. It was a lot of fun, and I appreciate the respect and responsibility I was given. To my fellow bioengineering students: what a trying first year we had! Thanks to Kevin McHale, Gwyneth Card, and many others for being there to commiserate and celebrate.
I came to Caltech after two years of grad school at UCSB, and I have many people to thank from that time, including Mark Henle, Eric Dunham, Matt Hansen, Grace Brannigan, Lawrence Lin, Jesse Epstein, Vanessa Hayward, and Rich Steinberg. I am grateful for the support of my advisor Jean Carlson during my transformation from physicist to bioengineer. With her help I traveled to Budapest and Aspen to learn about biological complexity. I’d like to thank John Doyle for his contagious enthusiasm and for inspiration.
I was fortunate to have several great mentors as an undergraduate student at Northwestern University. Thanks to Randy Snurr and John Torkelson in particular for launching me on a research career.
TABLE OF CONTENTS
Abstract iii Acknowledgments iv
Table of Contents vii
List of Tables viii
List of Figures ix
Chapter I
The tradeoff between folding and diversity with recombination
1
Chapter II
Site-directed recombination as a shortest-path problem
21
Chapter III
Comparing the predictive accuracy of pairwise residue potentials
50
Chapter IV
Inferring interactions from an alignment of folded and unfolded protein sequences
67
Appendix A
Chimeric sequence design is NP-hard
105
Appendix B
Folding data for cytochromes P450 and beta-lactamases
108
LIST OF TABLES
LIST OF FIGURES
Figure I-1. Comparing the fraction of functional proteins by recombination vs. random mutation of PSE-4
11
Figure I-2. The fraction of functional TEM-1/PSE-4 chimeras vs. SCHEMA energy
13
Figure I-3. Ternary diagrams for TEM-1/PSE-4/SED-1 15 Figure I-4. Comparing the folding-diversity tradeoff for two vs. three
beta-lactamase parents
17
Figure I-5. Site-directed recombination with three parents and eight blocks 19 Figure II-1. Site-directed recombination as a shortest-path problem 35 Figure II-2. SCHEMA energy vs. diversity for seven-crossover cytochrome P450
libraries
37
Figure II-3. RASPP-curves approximate the optimal tradeoff between SCHEMA energy and diversity
39
Figure II-4. Crossovers along the RASPP-curve 41
Figure II-5. RASPP-curves guide the choice of parents 43
Figure II-6. RASPP vs. the SCHEMA algorithm 45
Figure II-7. Crossovers chosen by RASPP vs. the SCHEMA profile 47 Figure III-1. Mutual information between SCHEMA and folding 61 Figure III-2. Comparing the mutual information with folding for different energy
functions
63
Figure III-3. Probability of folding vs. SCHEMA energy 65 Figure IV-1. Logistic regression is the only algorithm to correctly predict pairwise
interactions in a library of fictitious proteins
91
Figure IV-2. Logistic regression analysis of 806 cytochrome P450 chimeras 93 Figure IV-3. Logistic regression analysis of 605 beta-lactamase chimeras 95 Figure IV-4. Structural analysis of pair 1-7 and block 5 for cytochrome P450 parent
CYP102A1
Chapter I
The tradeoff between folding and diversity with recombination
Protein design seeks the amino acid sequence that encodes a protein with a desired set of properties (DeGrado, 2001). It is the inverse of the protein folding problem, in which one seeks the fold and function of a given amino acid sequence. One class of strategies for protein design involves searching through a library of proteins for the properties of interest (Arnold, 2000). These libraries are often created by altering the sequence of a parental protein whose features make it a good starting point for the fitness search. When the parental protein is mutated randomly, the fraction of functional mutants declines exponentially with the number of mutations (Daugherty et al., 2000; Guo et al., 2004). The fraction functional after one amino acid mutation, or neutrality, can vary from 0.35 to 0.55 depending on the protein structure (Bloom et al., 2005).
red line in Figure I-1 shows the fraction of functional proteins (Ff) expected with random mutation under the exponential relationship Ff = 0.54m, where m is the number of amino acid changes relative to PSE-4. The recombination data of Drummond et al., generated by selecting 32 unique functional chimeras (including the parents) from a library of 16,384 sequences, follow a very different trend (black squares, Figure I-1). The fraction functional (calculated by assuming chimeras not isolated by the selection are not functional) is roughly symmetric about the midpoint m = D/2, where D = 151 is the number of amino acid differences between TEM-1 and PSE-4. At low levels of mutation relative to either parent, the fraction functional (Ff) decreases exponentially, but by m = D/2 the slope is zero. Functional beta-lactamases at this midpoint, which are maximally different from TEM-1 and PSE-4, are at least 16 orders of magnitude more common in the recombination library than in the one created by random mutation.
Drummond et al. have proposed a simple model consistent with these data for the probability p(F|m) that a chimera with m mutations will fold (Drummond et al., 2005). For two parents that differ at D residues, each of the m amino acids from one parent makes D - m pairs with residues from the other parent. Because these “novel” pairs are untested by nature within the context of the two parents, each one is assumed to have some probability 1 - q of disrupting folding. All other pairs are assumed to be nondisruptive. If each novel pair acts independently, the probability of retaining the parental fold is
( )
= m(D−m) ≡ m(D−m) (/D−1)q m F
which defines the recombinational tolerance ρ as the probability of folding for chimeras with one mutation. When m = 0 and m = D, the parents are recovered and the probability of folding is unity as required. The dotted blue line in Figure I-1, which is based on a maximum likelihood estimate of ρ = 0.82, shows that Equation I-1 describes the data fairly well. The main limitation of this model is the assumption that all novel residue pairs act equally. For a particular set of parents, it is acceptable to treat q as an average over the structural context of the residue pairs, but this probability will be different for other parents. To use the TEM-1/PSE-4 recombination data to predict folding with other beta-lactamase parents, a different model is needed.
Borrowing heavily from Voigt et al. (Voigt et al., 2002) and Drummond (D.A. Drummond, personal communication), I propose using novel residue-residue contacts, which are more likely to be transferable across parents. The total number of novel residue-residue contacts, called “SCHEMA disruption” by Voigt et al., can be written as a pairwise sum over residues (Silberg et al., 2004):
ij ij i j i
E C
>
=
∑ ∑
∆ . [I-2]used to score the compatibility of a sequence with a target fold. For this reason I refer to Equation I-2 as the “SCHEMA energy,” which also helps to distinguish it from the SCHEMA algorithm discussed in Chapter II.
If all non-contacting residues are assumed compatible, and if each novel residue contact acts independently with probability 1 - π to disrupt folding, the probability of folding decreases exponentially with SCHEMA energy (Meyer et al., 2003):
p(F|E) = πE. [I-3]
Figure I-2 is a plot of the fraction functional for TEM-1/PSE-4 chimeras vs. their SCHEMA energy. Some bins contain no functional chimeras, but the 90% confidence limits still appear on the graph. The dotted line, which is based on a maximum likelihood estimate of π = 0.89, shows that Equation I-3 describes the data reasonably well.
The probability of folding with respect to SCHEMA can be used to calculate the probability of folding with respect to mutation by conditioning:
( )
=∑
( ) ( )
E m E p E F p m Fp . [I-4]
p(E|m) is the probability that a chimera with m mutations has E novel residue contacts. Rather than evaluate Equation I-4 directly, I use Jensen’s inequality (Boyd & Vandenberghe, 2004) to derive a more readily calculated lower bound on p(F|m), which holds as long as p(F|E) is convex:
p(F|m) r
( )
(
)
m E E F p E m E p F
p ⎟⎟=
⎠ ⎞ ⎜ ⎜ ⎝ ⎛
∑
. [I-5]p(F|m) r π E m. [I-6]
m
E , which is the average SCHEMA energy among chimeras with mutation level m, can be calculated by multiplying the number of novel residue pairs by the probability one makes contact, denoted χ. For two parents, there are D(D - 1) residue pairs between the D residues at which the parents differ, and m(D - m) of these are novel for a chimera with m mutations. If the total number of contacts between the D(D - 1) pairs is C, then
χ = C/(D(D - 1)), E m =χ
(
D−m)m
, andp(F|m) r
( )
πχ m(D−m) =(
πC/D)
m(D−m) (/ D−1). [I-7] The ratio C/D is the average number of contacts per mutation, and thus πC/D is the probability that a mutation with this many contacts does not disrupt folding. Equations I-1 and I-7 together imply the recombinational tolerance ρrπC/D.How conservative is this lower bound? There are C = 322 SCHEMA contacts among the D = 151 residues at which TEM-1 and PSE-4 differ, which yields πC/D = 0.78. This value is indeed lower than the maximum likelihood estimate of 0.82 for the recombinational tolerance. The solid blue curve in Figure I-1 shows that the lower bound in Equation I-6 is a fairly good approximation to Equation I-1 (dashed blue). The largest gap between the two models occurs at the midpoint between TEM-1 and PSE-4, where the SCHEMA bound underestimates the fraction folded by about one order of magnitude.
becomes prohibitive. With three parents the combinatorics are tedious but manageable (see Methods). Instead of a single mutational distance, five degrees of freedom are needed to determine the average SCHEMA energy. These five variables can be averaged to give a three-dimensional label (m1, m2, m3) describing the number of mutations relative to each parent. Figure I-3, which shows the probability of folding for four slices through (m1, m2, m3)-space, is the analog of Figure I-1 when TEM-1 is partnered with PSE-4 and SED-1 (Petrella et al., 2001). The top panel shows the plane containing all three parents, which lie at the corners of the triangle. These three beta-lactamases have roughly the same pairwise sequence identities (~40%), giving rise to the approximate threefold symmetry. The edges of the ternary diagram represent the least deleterious paths from one parent to another, along which the fraction folded remains above 10-4. Chimeras at the center of the triangle have 107 mutations to the closest parent. The next three panels show slices through (m1, m2, m3)-space at successively higher values of mutation, and hence the probability of folding decreases.
below that for two, and much higher levels of mutation are possible with three parents. There is an interesting kink in the three-parent curve around 110 mutations, for which there is no analog with two parents. To understand this phenomenon, consider the group of residues at which all three parents have different amino acids (group D in Methods). At mutation levels below the kink, most of the chimeras inherit these maximally unconserved residues predominantly from two of the three parents. To reach mutation levels above the kink, however, chimeras must inherit the maximally unconserved residues from all three parents. It is precisely because these residues are different in all three parents that they create the most novel residue pairs. As the number of parents increases, I expect more of these transitions in the folding-diversity tradeoff curve.
Methods
To compute the average SCHEMA energy for chimeras derived from three parents, one must consider four different groups of residues. At the positions in group A, parents 2 and 3 have the same amino acid but parent 1 is different. At the positions in group B, parents 1 and 3 are the same but parent 2 is different, and in group C parent 3 is different from parents 1 and 2. Group D includes residues where all three parents are different. Let a, b, and c denote the number of residues in groups A, B, and C, respectively, that belong to the unique parent. The labels d1, d2, and d3 indicate the number of residues from parents 1, 2, and 3, respectively, in group D.
( )
(
)
∑ ∑ ∑ ∑ ∑
∑ ∑ ∑ ∑ ∑
+ + + = + + + = + + + = + + + == + + + + + + = =a b c d d d d d
D c c C b b B a a A
a b c d d d d d
D c c C b b B a a A E d c b a m d c b a m d c b a m t s d c b a m d c b a m d c b a m t s m m m
d
d
c
b
a
n
1 2 ! 3 ! 2 ! 1 ! ! ! ! ! ! ! ! ! ! 1 2 2 1 ! 3 ! 2 ! 1 ! ! ! ! ! ! ! ! ! ! 3 3 2 2 1 1 3 3 2 2 1 1 3 2 1 . . . . , ,,
,
,
,
χ
. [I-8]One could use a different contact probability for each entry in Table I-1, but I lumped all residue pairs together with a single χ. The beta-lactamases PSE-4 (parent 1), SED-1 (parent 2), and TEM-1 (parent 3) are characterized by A = 33, B = 46, C = 30, and D = 87, for a total of 196 amino acids, between which there are 538 contacts. The probability that a novel residue pair is in contact is thus χ = 538/(196µ195) = 0.014. In practice Equation I-8 was evaluated without the constraints, and each term was simply added to the appropriate (m1, m2, m3) bin. A similar procedure was used to evaluate the average SCHEMA energy at a fixed value of mutation relative to the closest parent, as in Figure I-4.
Table I-1. Counting the number of novel residue pairs with three parents.
Group A Group B Group C Group D
Group A aa ab ac ad1+ad1
Group B bb bc bd2+bd2
Group C cc cd3+cd3
Chapter II
Site-directed recombination as a shortest-path problem
As with other kinds of computational protein design (Hellinga & Richards, 1991; Dahiyat & Mayo, 1996; Voigt et al., 2001b; Hayes et al., 2002; Kuhlman et al., 2003), site-directed recombination (SDR) has two key ingredients: an energy function and optimization algorithm. Depending on the desired level of molecular detail and acceptable kinds of prior information (e.g., evolutionary vs. physicochemical), a wide variety of energy functions are available to predict how compatible chimeric sequences are with the target fold (Gordon et al., 1999; Lazaridis & Karplus, 2000; Mendes et al., 2002). My focus is on energy functions that involve one- and two-body interactions between residues. The SCHEMA energy belongs to this class of pairwise residue potentials.
Algorithms for library design must consider not only the fraction folded but also the diversity of the proteins. Searching through a library of folded proteins that closely resemble each other or the parents is not much better than searching through a mostly unfolded library. The design goals and library creation method should dictate what kinds of diversity and how much are needed, but our understanding of this subject is limited. In several studies, libraries with more mutations were better for adaptive evolution of enzyme function (Crameri et al., 1998; Zaccolo & Gherardi, 1999; Daugherty et al., 2000). Because our capacity for searching through libraries is finite, more diversity cannot always be better (Voigt et al., 2001a). In theory there should be an optimal diversity (Ostermeier, 2003), but this concept is of limited use when little is known about the fitness landscape.
These two design criteria, diversity and folding, are at odds because most mutations are neutral or deleterious to protein structure. In Chapter I the tradeoff between folding and mutation was illustrated for chimeras with any number of crossovers. Site-directed recombination can ameliorate this tradeoff, yielding libraries closer to the optimal tradeoff surface, i.e., the highest fraction folded at different levels of diversity. Among all libraries of fixed size at a desired level of diversity, those on the optimal tradeoff surface provide the most attempts at the protein design goal.
In general, optimizing the tradeoff between folding and diversity for site-directed recombination is hard, but one formulation of the problem can be solved efficiently. I will show that finding the crossovers (X1, X2, …, Xn) that minimize the average energy
(
X1,X2, ,Xn)
E minK [II-1]
subject to Lminb L b Lmax,
is equivalent to finding the shortest path between nodes in a network. This is a well-studied combinatorial optimization problem for which the global minimum can be found efficiently by dynamic programming (Korte & Vygen, 2002). Just as the energy of one protein sequence measures how likely it is to fold, the average energy of all sequences in a library is an aggregate measure of “foldability.” Minimizing E is thus one way to enrich a library in folded proteins, although the effectiveness of this strategy depends on the relationship between E and the fraction folded, which in turn depends on the energy function. The constraints on fragment length [Lmin, Lmax] provide an indirect but computationally tractable way to control library diversity.
Methods
Protein sequences
SCHEMA calculations were done with TEM-1 structure 1BTL (Jelsch et al., 1993). Beta-lactamase residues were numbered from the N-terminus of TEM-1.
From SCHEMA energy to fraction folded
The probability of folding was assumed to decrease exponentially with SCHEMA energy, using the same maximum likelihood fit presented in Chapter I. This model was used to estimate the diversity and fraction folded for SDR libraries. If each chimera folds independently, the library can be modeled as a binomial experiment (Silberg et al., 2004), for which the fraction expected to fold (Ff) is
(
)
∑
= = T i if p F E
T F
1 1
. [II-2]
Excluding the parents (they are known to be folded), the number of binomial trials T for a library with p parents and n crossovers is pn+1 - p. The diversity of each library was defined as the number of amino acid mutations expected for a folded protein:
(
)
(
)
∑
∑
= k k k k k E F p m E F pD . [II-3]
For a particular chimera, m is the number of amino acid mutations to the closest parent.
SCHEMA algorithm
∑ ∑ ∑
+ − = − + = − + + = Π = Γ i w i j w j j k w j k l kl kl i C w 1 2 1 1 1. [II-4]
The contact matrix Ckl is the same as defined in Equation I-2, and Πkl is the probability that the residue pair k-l is “novel,” and hence potentially disruptive, when each residue is inherited randomly. (This is a different normalization than the one used by Voigt et al. but makes no qualitative difference to the profile.) For recombination of p parents, there are p2 amino acid combinations for every pair of positions. Because the parental residue combinations are not novel (by definition), the maximum value for Πkl is 1 – 1/p. I used a window size of 14 residues.
Results
Proof of the shortest-path problem
For any energy function with one- and two-body interactions between residues σk,
( i) ( i, j)
i i j i
E eσ eσ σ
>
=
∑
+∑ ∑
, [II-5]To create the one-to-one correspondence, nodes in Figure II-1 are selectively connected. If the node Xk visited in column k b n represents the position of the kth crossover, then a path that visits node X1 in the first column defines the first peptide fragment as [1, X1] (amino acid residues 1 to X1, inclusive). To satisfy the constraints on fragment length, node 0 should be connected to a node in the first column if and only if (iff) Lmin b X1 b Lmax. Similarly, an arc from node X1 in the first column to node X2 in the second column defines the second peptide fragment as [X1 + 1, X2]. Thus node X1 is connected to node X2 iff Lmin b X2 – X1b Lmax. This process is continued until the last column, where an arc from Xn-1 to Xn defines two peptide fragments: [Xn-1 + 1, Xn] and [Xn + 1, N] for a protein of length N. Thus node Xn-1 is connected to node Xn iff Lminb Xn - Xn-1b Lmax and Lminb N - Xnb Lmax.
Arc lengths are assigned so that the total length of each n-path equals the average energy of the corresponding library:
) X ,..., X , (X 1
1,X ) 1 2
X ( n E A n k k k =
∑
= −, [II-6]
where A(Xk-1,Xk) is the arc length from node Xk-1 to node Xk (X0 = 0), and the subscript on E explicitly denotes the crossovers. To satisfy Equation II-6, arc lengths from node 0 are assigned the average energy of a library with one crossover immediately following residue X1:
) X ( 1 1 ) X , 0 ( E
A = . [II-7]
) X ,..., X , (X ) X , X ,..., X , (X 1 1 2 1 1 2 1 ) X , (X − − − = − k k k E E
A k k , k r 2. [II-8]
To be consistent, the right-hand side of Equation II-8 must be independent of all crossovers except Xk-1 and Xk. This holds true for any pairwise residue potential (Equation II-5). First note that for a library with p parents, the average energy can be written as a sum over inheritance patterns:
∑ ∑
∑
+
=
1 X
0, X1,X2 X , 1 2 1 1 ) X ,..., X , (X
S S S
p
N n n
n E
E L , [II-9]
where Si,j denotes the parent from whom the peptide fragment [i + 1, j] (residues i + 1 to j, inclusive) is inherited. When a fragment contains only one residue, I use the shorthand Si-1,i ≡ Si. Combining Equations II-5 and II-9, the arc length in Equation II-8 can be rewritten as
∑
∑
∑ ∑
∑
∑ ∑
− − − − + = = + ⎥ ⎥ ⎦ ⎤ ⎢ ⎢ ⎣ ⎡ − 1 X ,0 X 2,X 1 X 1,X X , X 1, 1
1 1
1 ( , )
S S N r N r t t r
S S S
p
k
k k k k N k N
k L p e σ σ
∑
∑
∑ ∑
∑
∑
∑
− − − − − + + = = + ⎥ ⎥ ⎦ ⎤ ⎢ ⎢ ⎣ ⎡ − = 1 X ,0 X 2,X 1 X 1,X X , X 1, 1 1
X
1
X X 1
1 ( , )
S S r
N
t
t r
S S S
p k k k k k k
k kN k N
k L p e σ σ [II-10]
∑
∑
∑ ∑
∑
+ = − = + − − ⎥ ⎥ ⎦ ⎤ ⎢ ⎢ ⎣ ⎡ − = k k k kk k N k N r
N
t
t r
S S S
p p e
X
1
X X 1
1
1 X
, 1
X X , X 1,
2 (σ ,σ ) [II-11]
∑
∑
∑ ∑
∑
+ = − = + = ⎥ ⎥ ⎦ ⎤ ⎢ ⎢ ⎣ ⎡ − = kk k r t r t
r
N
t
t r
S S S S
p p e
X
1
X X 1
1
1
2 (σ ,σ ). [II-12]
and [Xk + 1, N]. Trivial evaluation of the k - 1 inheritance sums outside the brackets yields Equation II-11. In Equation II-12 the order of the sums is swapped to simplify the notation: first sum over parents and then sum over residues.
Algorithmic complexity
Shortest-path problems can be solved efficiently because of their recursive structure (Lawler, 1976; Korte & Vygen, 2002). In the case of Figure II-1, the length of the shortest path Ukj from node 0 to node j in column k can be computed using the shortest paths from node 0 to all nodes in column k - 1:
(
(, ))
.min U 1 A i j
U ik
i k
j = − + [II-13]
No information from other columns is needed. This property is the basis for dynamic programming. Using forward induction, RASPP finds the shortest path to every node in the first column, then the shortest path to every node in the second column, etc. Each evaluation of Equation II-13 requires O(N) operations. This is repeated for all O(N) nodes in a column and for each of the n columns, yielding a running time of O(N2n).
be repeated for all values k b n with a total running time of O(N2n), the same as a single iteration of RASPP.
The complexity analysis must also include the time needed to calculate the arc lengths. The first evaluation of Equation II-12 requires O(N2p2) pairwise energy calculations, but only O(Np2) are needed to compute each subsequent arc length. This means all O(N2) distinct arc lengths can be constructed with complexity O(N3p2). When combined with the running time for dynamic programming, the overall complexity is O(N3p2 + N2n).
To generate libraries with different diversities, the length constraints [Lmin, Lmax] are adjusted over a range of values. In the absence of experimental constraints, Lmin can vary from 1 to N/(n + 1) and Lmax from N/(n + 1) to N - nLmin. This requires O(N2/n) iterations of RASPP, but since the arc lengths are not recalculated each time, the total running time is only O(N4 + N3p2).
Case studies using the SCHEMA energy
(
)
∑
∑
+
= = +
−
−
Π
= k
k k
r
N
t
rt rt k
k C
A
X
1
X X 1
1
1
X ,
X . [II-15]
Πrt, which is the probability of breaking the r-t interaction when residues r and t are
inherited at random, also appears in the definition of the SCHEMA profile (Equation II-4).
Consider making a seven crossover library using the heme domains of cytochrome P450 homologs CYP102A1, CYP102A2, and CYP102A3, which share roughly 65% of their 456 amino acids (Nelson, 2005). By varying the length constraints for n = 7 crossovers, 2,052 libraries were generated, of which 391 are distinct. These are plotted in gray in Figure II-2. As Lmin increases and Lmax decreases, the crossovers become more evenly spaced, resulting in libraries with higher E and higher diversity, as measured by the average number of amino acid mutations to the closest parent m . Designing libraries with more crossovers increases the levels of diversity accessible by SDR, but adding fragments also complicates construction of the library. In this example, the choice of n = 7 provides enough mutants for screening (38 = 6,561 chimeras) and sufficiently high levels of mutation for laboratory evolution based on data from previous experiments (Otey et al., 2004).
beta-lactamases introduced in Chapter I. These two sets of parents have 25 and 20 million possible libraries, respectively, as shown in Figure II-3. At most levels of mutation, the RASPP-curve provides a good estimate of the lowest energy possible. Exceptions occur in mutation ranges where RASPP does not produce any libraries, e.g., 30 < m < 35 for the cytochromes P450. A similar mutation gap can be seen in Figure II-2 at 40 < m < 50. Such gaps are to be expected when using constraints on fragment length as a surrogate for m . Changing the parents or the number of crossovers can shift the location of a gap, as seen by comparing Figures II-2 and II-3, which differ in both respects.
The pattern of optimal crossovers varies dramatically along a RASPP-curve. Figure II-4 shows the elements of secondary structure for CYP102A1 (Ravichandran et al., 1993) corresponding to crossovers along the RASPP-curve of Figure II-2. At low
Before choosing optimal crossover locations, one must decide upon a set of parents for recombination. RASPP-curves provide a rapid and reliable way of determining which parents yield the lowest-energy libraries in a desired diversity range. To illustrate, consider choosing among three combinations of cytochrome P450 homologs: A1/A2, A1/A3, or A1/A2/A3. Even though a library with three parents has more chimeras than one with two parents, the comparison is fair because any random, experimental sample will on average have the same E as the entire library.
The RASPP-curves for these alternative designs, shown in Figure II-5, reveal significant differences at mutation levels m > 40. For 40 < m < 60, the combination A1/A2 is better than A1/A3 because the former has lower energy. This would be difficult to ascertain by other means, since A1/A2 and A1/A3 both have 65% sequence identity, and on average their nonconserved residues make the same number of contacts. For 40 < m < 50, A1/A2 also has lower energy than A1/A2/A3. For 50 < m < 60, A1/A2 and A1/A2/A3 have comparable energy, but A1/A2 is still preferable because adding a third parent increases the cost and complexity of library construction. All three parents are needed to build libraries with m > 60.
Discussion
many successes in protein sequence design (Dahiyat & Mayo, 1996; Looger et al., 2003). However, Equation II-12 and the DEE theorem have very different consequences for computational protein design. RASPP finds the global energy minimum for Equation II-1 in O(N3p2 + N2n) operations for a protein of length N, making it efficient in theory and practice (Papadimitriou & Steiglitz, 1998). In contrast, DEE requires an exponential number of operations O(aN) in the worst case. This is unavoidable (unless P = NP) because finding the amino acid sequence with minimum energy is NP-hard (Pierce & Winfree, 2002). Averaging over the library transforms protein design from a hard problem to an easy one (see also Appendix A).
my experience, when all profile minima are included as crossovers, the library is unlikely to be competitive with RASPP solutions. However, if only a subset of the profile minima is needed, e.g., making a four-crossover library for TEM-1/PSE-4/SED-1, then some combinations may be quite good.
The main limitation with RASPP is its assumption that the parents are inherited with equal probability at every block. Of the p2 fragment-fragment combinations for each block pair, many have never been tested before by nature and hence are likely to be deleterious. Some of these disruptive interactions can be avoided by optimizing the crossover locations, but not all. Yet another way to minimize the library energy is by omitting fragments that do not pair well with other fragments. This modification to the SDR paradigm is easily implemented in the laboratory, and the algorithm OPTCOMB has recently been developed for designing these kinds of combinatorial libraries (Saraf et al., 2005). The solutions found by RASPP are a subset of those possible with OPTCOMB, but this added flexibility comes at a cost. Unlike RASPP, OPTCOMB is not guaranteed to be efficient for large proteins. In practice this may not be a concern, in which case OPTCOMB would be preferred for its ability to find libraries closer to the optimal folding-diversity tradeoff surface.
Portions of this chapter were reproduced with the permission of Oxford University Press from
Figure II-2. SCHEMA energy vs. diversity for seven-crossover cytochrome P450 libraries. Equation II-1 was solved by RASPP for length constraints Lmin = 1 to N/(n + 1) and Lmax = N/(n + 1) to N - nLmin, where N = 197 nonconserved residues. A plot of E
0
10
20
30
40
50
60
0
50
100
150
200
250
300
Residue number
SC
HE
MA profi
le
di
srupt
io
n
Chapter III
Comparing the predictive accuracy of pairwise residue potentials
The SCHEMA energy was proposed by Voigt et al. to score the stability of chimeric sequences for a target fold (Voigt et al., 2002). SCHEMA uses a crystal structure and parental sequence alignment to count the number of contacts disrupted when portions of the sequence are inherited from different parents. A contact is considered disrupted if the pair of residues found in the chimera is not present in any of the parents (Silberg et al., 2004). One might expect the simplicity of SCHEMA to hinder its effectiveness for protein design. Since RASPP, and even the SCHEMA algorithm, can use any pairwise residue potential, it is important to determine whether SCHEMA is competitive with more detailed alternatives.
Binary folding data can be analyzed with information theory to evaluate the predictive accuracy of energy functions. In a sample of folded and unfolded proteins, one cannot predict with certainty whether a randomly chosen sequence is folded. This uncertainty, or entropy (Adami, 2004), can be reduced by knowing the energy of each sequence if proteins with higher energy are less likely to be folded. The decrease in entropy equals the mutual information between folding and energy. An energy function with higher mutual information is better able to predict folding in the sample and presumably in future libraries as well, making it desirable for computational protein design. Within this framework, I compare SCHEMA against other pairwise residue potentials using data from cytochrome P450 and beta-lactamase SDR libraries.
Methods
Cytochrome P450 library
and expected number of mutations per folded protein, were carried out as described in Chapter II.
From the set of 5,000 randomly generated libraries, only those with a fraction folded greater than 25% were selected for further study. Fourteen crossovers appeared in greater than 40% of these libraries. There are 3,432 possible ways to choose 7 crossovers from this set of 14, all of which were evaluated. The final library was selected for its high fraction folded (40%) and large number of mutations per folded protein (65). The crossovers lie directly after the following residues: Glu64, Ile122, Tyr166, Val216, Thr268, Ala328, and Gln404, numbered from the N-terminus of CYP102A1.
The chimeras were screened for their ability to fold and bind heme using carbon monoxide difference spectroscopy (Otey, 2003). From a random sampling of several thousand colonies, 628 full length P450 sequences were identified, of which 287 bind heme (C. Otey, personal communication). Additional sequencing of folded P450s yielded an expanded data set containing 806 chimeras (including the three parents), of which 465 bind heme. These data are listed in Appendix B.
Beta-lactamase library
2003). The final crossover locations lie directly after the following residues: Arg63, Lys71, Thr147, Arg159, Asp174, Leu188, and Gly216, numbered from the N-terminus of TEM-1. A random sample of 553 sequences contained 111 functional beta-lactamases, as determined by screening for ampicillin resistance on agar plates (M. Meyer, personal communication). Additional sequencing of functional proteins yielded 605 chimeras, of which 163 are functional. These data are listed in Appendix B.
Mutual information between folding and energy
The uncertainty about folding (F) in a set of N chimeras, only Nf of which are folded, was quantified by the Shannon entropy (Adami, 2004). If p = Nf/N denotes the fraction folded, then the entropy in bits per chimera is
(
)
(
)
[
p p p p]
F
H( )=− log2 + 1− log2 1− r 0. [III-1] Given no other information besides the ratio p, the likelihood of correctly predicting the folding status of every chimera is 2-NH. Systems with lower entropy are thus easier to predict, i.e., there is less uncertainty. The conditional entropy H(F|E), which must be less than or equal to H(F), measures uncertainty when the chimeric energies are known, and the difference H(F) – H(F|E) equals the mutual information I(F:E). The conditional entropy H(F|E) is an average over energy values,
( ) (
)
∑
=
k E
k k H F E E
p E
F
H( | ) | , [III-2]
Equation III-1 by replacing p with the conditional probability p(F|Ek), which is the probability that a chimera with energy Ek is folded.
In the original work of Voigt et al. (Voigt et al., 2002), and for the P450 library described above, the probability of folding was assumed to decrease abruptly with SCHEMA energy at some threshold. This step model was eventually proven inadequate by Meyer et al., who noticed that the probability of folding decreased exponentially with SCHEMA energy (Meyer et al., 2003). To capture the wide range of behaviors expected for energy functions besides SCHEMA, an even more general folding model is needed. With the exponential model it is impossible for the mutual information between folding and energy to approach its maximum value. High mutual information scores require a sharp transition between high and low probability. With a probability model of the form
( )
bE ae c E F
p +
+
= 1 , [III-3]
both exponential (c = 0, a = 0) and sigmoidal (c = 1) curves are possible, as well as intermediate behaviors. All three parameters were fit to the binary folding data using maximum likelihood, subject to the constraints b r 0, 0 b c b 1.
CVHclash
the number of contacting residue pairs with charge (C), volume (V), or hydrophobicity (H) outside the range spanned by the parents:
∑∑
>
=
i j i ij ij
CVH C
E δ . [III-4]
The contact matrix Cij = 1 if the Cβ atoms (Cα for gylcine) of residues i and j are within 8 Å in the parental structure; otherwise Cij = 0. The delta function δij considers whether the residue pair has parent-like CVH properties. The charge (Klein et al., 1984), volume (Krigbaum & Komoriya, 1979), and hydrophobicity (Cid et al., 1992) parameters for each amino acid were taken from the AAindex database (Kawashima et al., 1999). The additive property (C, V, or H) for each contacting pair is the sum of the values for the two amino acids involved (Saraf et al., 2004). If any of the three properties for a chimeric pair lies outside the range spanned by the parents, δij = 1 and one clash is counted. Increasing the range of nondisruptive CVH values by 10 or 20% beyond that spanned by the parents did not significantly change the results.
Results
SCHEMA predicts beta-lactamase folding better than P450 folding
status of a randomly chosen chimera, and hence the entropy decreases. The beta-lactamase data set contains 605 chimeras, 27% of which are folded and functional, which means the entropy per chimera is 0.84 bits. The P450 entropy is 0.98 bits per chimera because 58% of the 806 sequences are folded.
Although more information is available for the P450s, less is captured by SCHEMA compared to the beta-lactamases. As shown in Figure III-1, the mutual information per chimera is 0.34 bits for the beta-lactamases, compared to only 0.07 bits for the P450s. These results are not sensitive to how structural contacts are defined. The above scores use the original definition of Voigt et al., who considered whether any pair of heavy side-chain atoms or backbone carbon atoms between two residues is within 4.5 Å (Voigt et al., 2002). The structure prediction competition CASP defines two residues as contacting if their Cβ atoms (Cα for glycine) are within 8Å (Aloy et al., 2003). When this standard is used, denoted as SCHEMA2, the mutual information per chimera remains essentially unchanged for both proteins (0.01 bit increase). Increasing or decreasing the contact distance by 1Å also has negligible effect (0.01 bit decrease).
leaves the mutual information with P450 folding unchanged (+0.01 bit) and slightly decreases the score on beta-lactamase (-0.03 bit).
Comparing SCHEMA with other energy functions
As a baseline for comparison, I computed the mutual information between folding and mutation to the closest parent. Although mutation is not an energy function in the conventional sense, it can be used to predict folding. Not surprisingly, mutation is less effective than SCHEMA for both the P450s and beta-lactamases, with scores of 0.02 and 0.14 bits per chimera, respectively. Meyer et al. also concluded that SCHEMA was superior to mutation by comparing the energies of functional and nonfunctional beta-lactamases at a fixed level of mutation (Meyer et al., 2003). The functional chimeras had statistically significant lower energies.
SCHEMA’s use of the parental sequences, however minimal, contributes to its predictive accuracy. Consider an energy function WPS (Without Parental Sequences) that counts as disruptive any contact between residues from different parents, even if one or both positions are completely conserved. SCHEMA only penalizes a subset of these amino acid pairs, specifically those not present in any of the parents. WPS is less predictive than SCHEMA for both proteins. As shown in Figure III-2, it decreases the mutual information per chimera by 0.06 bits for the beta-lactamases and by 0.04 bits for the P450s.
which novel residue pairs are counted (Saraf & Maranas, 2003; Saraf et al., 2004). Inspired by their work, I developed the energy function CVHclash, which considers whether the additive charge, volume, or hydrophobicity (CVH) of a chimeric residue pair lies outside the range of values observed among the parents (see Methods). Unlike SCHEMA, CVHclash is able to recognize conservative substitutions and avoid penalizing novel chimeric pairs with parent-like CVH properties. Nonetheless, CVHclash does not predict folding better than SCHEMA (see Figure III-2).
I also evaluated the accuracy of the Miyazawa-Jernigan (MJ) potential, which assigns a unique energy (derived from the Protein Data Bank) to each residue-residue contact based on the identity of the interacting amino acids (Miyazawa & Jernigan, 1996). Given its easy implementation, the MJ potential has been widely used (over 800 citations) to explore folding and designability, often with lattice proteins. In their 1996 paper, Miyazawa and Jernigan showed that the potential could identify the native structure of 73 of the 88 proteins tested. In my hands the MJ potential predicts P450 and beta-lactamase folding poorly, with mutual information scores even worse than mutation (see Figure III-2).
Discussion
important for protein stability (Chen & Stites, 2001). SCHEMA then considers the structural context of each residue pair by checking whether it has been tested before by nature. This simple insight makes SCHEMA much more effective than a contact potential such as Miyazawa-Jernigan, which considers only the identity of the amino acids (Vendruscolo & Domany, 1998; Khatun et al., 2004).
By weighting amino acid pairs differently depending on their structural context, I believe SCHEMA is able to partially mimic the resolving power of rotamer-based potentials (Gordon et al., 1999; Mendes et al., 2002). After all, a rotamer-rotamer interaction is a context-dependent, residue-residue interaction. While I expect a rotamer potential could be used to predict cytochrome P450 folding better than SCHEMA, it is challenging to evaluate the energy of several hundred, 450-residue proteins bound to a heme cofactor. Preliminary attempts to score P450 chimeras with the rotamer potential used by ORBIT (Mooers et al., 2003) found that a fixed backbone approximation was too severe to compute realistic energies (E. Zollars, personal communication). The sensitivity of rotamer potentials requires a good homology model for each sequence, whereas SCHEMA is coarse enough to score all chimeras using the same parental structure.
0
0.1
0.2
0.3
0.4
0.5
0.6
0.7
0.8
0.9
1
P450
beta-lactamase
Bits
0 0.05 0.1 0.15 0.2 0.25 0.3 0.35 0.4
P450
beta-lactamase
Mutual information (bits
per chimera)
Mutation SCHEMA WPS CVHclash MJ
Figure III-3. Probability of folding vs. SCHEMA energy. The curves are maximum likelihood fits to Equation III-3. The best-fit parameters for P450 (dashed line) are a = -2.1, b = 0.059, c = 0.93. For beta-lactamase (solid line), the parameters are a =
Chapter IV
Inferring interactions from an alignment of
folded and unfolded protein sequences
Chapter III illustrated the difficulty of predicting which chimeras retain the parental function and/or fold. For example, SCHEMA captures less than 10% of the maximum information available in the cytochrome P450 data. This was the best score of any energy function I tried, but there could be others with better performance. On the other hand, the missing information may simply be impossible to capture with a pairwise potential. To assess the limits of the pairwise approximation, in this chapter I fit an empirical energy function to each data set using logistic regression, an analog of linear regression for binary data (e.g., 1 = folded, 0 = not folded) that is widely used in the medical and social sciences (Hosmer & Lemeshow, 2000; Menard, 2002). The energy function, derived from an alignment of folded and unfolded proteins, is a concise way of representing sequence-function relationships. Such relationships have been generated from residue-residue correlations in alignments of naturally occurring (and hence folded) proteins by a variety of methods (Gobel et al., 1994; Thomas et al., 1996; Larson et al., 2000; Saraf et al., 2003; Suel et al., 2003).
correlated. This correlation arises because, when inherited together, the residues are more likely to lower (or raise) the free energy beyond the threshold needed for thermodynamic stability (Wintrode & Arnold, 2001; Bloom et al., 2005).
To test how well different algorithms handle the confounding effect of the stability threshold, I created a library of fictitious proteins that fold according to a specified energy model. The proteins have one of three possible fragments at each of eight variable positions. While clearly inspired by the SDR libraries from Chapter III, this fictitious library represents other combinatorial strategies equally well (Moore & Maranas, 2004), such as synthetic shuffling of designed oligonucleotides (Hayes et al., 2002). In the hypothetical energy model, each peptide fragment makes an individual, or “one-body,” contribution, as well as seven “two-body” interactions with the other positions (Russ & Ranganathan, 2002). The physical interpretation of these terms depends on what the positions represent. For a single residue, one-body terms include interactions with the solvent, with the backbone, and with conserved residues. For a block of residues, one-body terms also include residue-residue interactions within the block. Two-body terms represent interactions between two non-conserved residues or, for the block-level alignment, between all non-conserved residues from two blocks. It is assumed that when the total energy of a fictitious protein is above an arbitrary threshold of zero, it is unfolded; otherwise it is folded.
Fodor & Aldrich, 2004) and statistical coupling (Lockless & Ranganathan, 1999; Suel et al., 2003) analysis, were developed for natural protein families and hence use only the folded subset of the MSA. The third method is excess information analysis, which, like logistic regression, makes use of both the folded and unfolded sequences. Excess information is based on the mutual information between folding and a pair of positions, which is different than (but related to) the mutual information between two positions in an MSA of folded proteins (Atchley et al., 2000; Fodor & Aldrich, 2004; Saraf et al., 2004). Of all four methods, logistic regression is the only one to correctly predict interactions in the hypothetical energy model.
When applied to the real samples of cytochromes P450 and beta-lactamases, logistic regression proposes several sequence-function relationships consistent with the protein structures.
Methods
Construction of the fictitious library
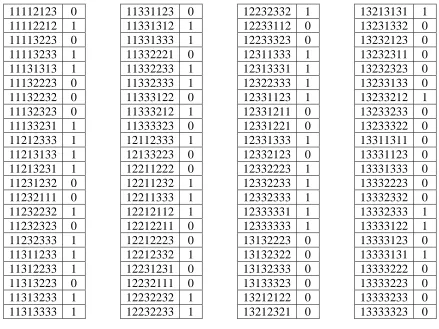
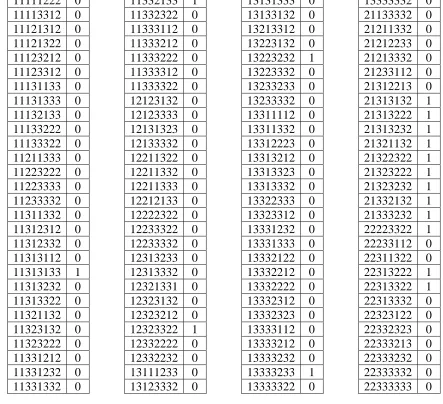
The fictitious library contains 6,561 sequences, representing all combinations of 3 fragments at 8 positions. Fragment i.x refers to fragment x at position i. The total energy of each sequence is the sum of 8 one-body terms (ε1) and 28 two-body terms (ε2):
( )
∑ ∑
(
)
∑
= =+
=
+
= 8
1 8
1 2 8
1
1 . . , .
i j i i
y j x i x
i
E ε ε . [IV-1]
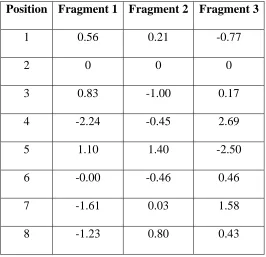
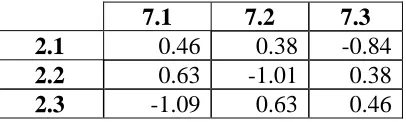
Of the 8 positions and 28 pairs, 7 positions and 1 pair were arbitrarily selected to make energetic contributions. The parameters for these variables, listed in Tables 1 and IV-2, were chosen randomly from the standard normal distribution and constrained to have zero average energy. All other energy parameters were set equal to zero. The larger the differences between parameters for a particular position or pair, the more strongly it affects folding. With a stability threshold of zero energy, roughly half the library is folded (3,272 out of 6,561 sequences).
Contingency table analysis
Several variations on contingency table analysis have been used to detect correlated residues in natural protein families (Larson et al., 2000; Kass & Horovitz, 2002; Fodor & Aldrich, 2004). For each pair i-j, first I tallied the number of times each fragment-fragment combination i.x-j.y was observed in the folded subset of the hypothetical library. Then I calculated the number expected if the two fragments were inherited independently (Bernstein & Bernstein, 1999). The chi-square statistic quantifies the significance of the differences between the observed and expected values:
(
)
(
)
[
]
(
)
∑∑
−=
x y ij
i.x-j.y
i.x-j.y i.x-j.y
Expected
Expected
Observed 2
2
χ . [IV-2]
Statistical coupling analysis
Statistical coupling analysis, developed by Ranganathan and co-workers to measure energetic coupling in natural protein families (Lockless & Ranganathan, 1999; Suel et al., 2003), was adapted for the folded subset of the combinatorial library. The statistical coupling between positions i and j measures the response at position i when the MSA is perturbed at position j (∆∆Gi,j) or vice versa (∆∆Gj,i). In general these energy vectors will be different. ∆∆Gi,j is the difference between the conservation energy for position i (∆Gi) and a perturbed energy vector ∆Gi,δj. The ∆Gixcomponent of ∆Gi measures the probability of finding fragment i.x relative to a reference probability:
∗ = ∆ P P N kT
Gix ix ln 1
. [IV-3]
x i
P is the binomial probability of fragment i.x appearing Nixtimes in a set of N folded proteins. Assuming a reference state where all three fragments are equally likely,
x i x i N N N x i x i N N
P ⎟⎟ −
⎠ ⎞ ⎜⎜ ⎝ ⎛
= 32
3
1 . [IV-4]
The reference probability P* obeys Equation IV-4 with the substitution N/3 forNix. The three components of the perturbed energy are defined similarly to Equation IV-3: ∗ = ∆ j x j i x P P N kT G j i δ δ δ , ln 1 ,
except now N is the number of sequences in a subalignment containing only those folded chimeras with fragment j.1. (Equivalently, one could perturb with respect to fragment 2 or fragment 3.) The binomial probabilities Pix,δj and Pδ∗j follow Equation IV-4 with the appropriate parameters from the subalignment.
Excess information analysis
The Shannon entropy H(F) measures the uncertainty about folding in a set of chimeras:
(
)
(
)
[
p p p p]
H =− log2 + 1− log2 1− , [IV-6]
where p denotes the fraction folded. This uncertainty can be reduced by knowing the chimeric energies, as discussed in Chapter III, or by knowing a specific sequence feature. The conditional entropy H(F|j.y), which must be less than or equal to H(F), measures uncertainty when the presence or absence of fragment j.y is known. It is defined by Equation IV-6 when p is replaced with the conditional probability p(F|j.y), which is the fraction of chimeras with fragment j.y that are also folded. When averaged over all three fragments, the conditional entropy for position j is written as
( ) (
)
∑
= y
y j F H y j p j
F
H( | ) . | . . [IV-7]
The mutual information between folding and pair i-j is defined similarly. Given that a sequence contains fragments i.x and j.y, its probability of folding is p(F|i.x,j.y), which when substituted into Equation IV-6 gives the conditional entropy H(F|i.x, j.y). The conditional entropy for pair i-j is the average over all nine fragment combinations:
(
) (
)
∑∑
= x y y j x i F H y j x i p j i FH( | , ) . , . | . , . . [IV-8]
The mutual information between folding and pair i-j is I(F:i, j) = H(F) – H(F|i, j). The excess information for a pair, defined as the difference between the mutual information for the pair and the mutual information of its constituent positions, I(F:i, j) - I(F:i) -I(F:j), was used to predict interactions.
Logistic regression analysis
Both logistic (Hosmer & Lemeshow, 2000; Menard, 2002) and linear regression are special cases of the statistical methodology known as generalized linear modeling (McCullagh & Nelder, 1989; Agresti, 2002). There are three components to a generalized linear model. The random component specifies a response variable Y and its probability distribution. The systematic component specifies a predictor variable
∑
= i i i X βη , [IV-9]
variable, E[Y] = µ, and the predictor variable via g(µ) = η. The choice of link function depends on the probability distribution of the response variable. Linear regression deals with normally distributed variables, for which the link is the identity function. In logistic regression, the response variable is binary and follows the Bernoulli (binomial) distribution, for which the logit function is the appropriate link:
⎟⎟ ⎠ ⎞ ⎜⎜ ⎝ ⎛ − = µ µ η 1
log . [IV-10]
Inverting Equation IV-10 expresses the mean, which equals the probability of observing Y = 1, in terms of the predictor variable:
(
)
µ ηe Y p + = = = 1 1
1 . [IV-11]
This framework was used to model whether a protein is folded (F = 1) or not (F = 0) in the fictitious library. Each of the 3µ8 = 24 fragments and 9µ28 = 252 fragment-fragment pairs has a corresponding binary explanatory variable to model its presence (= 1) or absence (= 0). If the regression coefficients of these variables (βi in Equation IV-9) are interpreted as one- and two-body energy terms (cf. Equation IV-1), then Equation IV-11 models the probability of folding p(F|E) as a sigmoidally decreasing function of the energy:
( )
Ee E F p + = 1 1
. [IV-12]
maximizing the mutual information between folding and energy (defined in Chapter III) as well as minimizing the deviance function D = -2 ln L. Upon removing a position from the reference model, i.e., constraining its three one-body parameters to equal zero, the minimum deviance must increase because there are fewer parameters to fit the data. The magnitude of this increase asymptotically follows the chi-square distribution with two degrees of freedom, which was used to compute a p-value for each position (i.e., the likelihood ratio test was applied). Conversely, adding a position pair to the reference model lowers the minimum deviance, and the significance of this change was computed from the chi-square distribution with four degrees of freedom.
As just mentioned, although each position has three one-body parameters (one for each fragment), there are only two degrees of freedom because the reference energy for each position is arbitrary. To uniquely determine the one-body parameters, the average energy for each position was set equal to zero:
( )
. 0 1 =∑
x x i
ε . [IV-13]
Similarly, there are only four degrees of freedom for each position pair despite the presence of 3µ3 = 9 two-body parameters. The two-body terms were uniquely determined by requiring the average over each fragment index to equal zero:
(
. , .)
2(
. , .)
02 =
∑
=∑
y x
y j x i y
j x
i ε
ε . [IV-14]
The five linearly independent constraints in Equation IV-14 were derived by considering the extent to which the two-body terms can be reconstructed with one-body parameters:
The space of matrices completely decomposable according to Equation IV-15 is five-dimensional, and Equation IV-14 makes the matrix of two-body terms perpendicular to this space. Thus I have chosen a two-body representation in which one-body effects are minimized.
Minimizing the deviance subject to the linear constraints in Equations IV-13 and IV-14 is a convex optimization problem in the one- and two-body energy parameters, which means local optimization algorithms converge to the global minimum (Boyd & Vandenberghe, 2004). I used the algorithm MINOS through the NEOS server for optimization (Czyzyk et al., 1998).
Logistic regression analysis of the cytochrome P450 and beta-lactamase data
removing each variable. When the score is positive, it indicates the variable is significant. The average increase ± standard deviation for the ten partitions is reported.
Results
Analysis of the fictitious library
The folding status for each of the 38 = 6,561 sequences in the fictitious library was determined according to the hypothetical energy model summarized in Figure IV-1A. The diagonal entries of this 8µ8 matrix represent the individual, or one-body, contributions of the 8 positions, and the off-diagonal entries represent the interaction, or two-body, strengths of the position pairs. In order of decreasing one-body strength, the positions are 4, 5, 7, 8, 3, 1, 6, and 2. The only nonzero two-body interaction is between positions 2 and 7.
Panels B through E in Figure IV-1 show the predictions of four different algorithms. Except for contingency table analysis (panel B), which does not score the one-body terms, the algorithms make qualitatively correct predictions about the relative importance of the individual contributions made by the positions.
to fragment i at position x). The stronger the individual contribution of a position, the more frequently it is predicted to make spurious interactions in panels B, C, and D of Figure IV-1. Statistical coupling analysis appears most susceptible to this error, followed by the contingency table and excess information algorithms. The one true interaction in the energy model, between positions 2 and 7, is barely in the top ten picked by statistical coupling analysis but fares better with the other two algorithms. All three methods assign pair 2-7 a lower score than at least one spurious pair, making it is impossible to separate true interactions from false ones.
This problem does not plague logistic regression, as is clear from a comparison of Figure IV-1E with the “answer key” in Figure IV-1A. No other pair even comes close to the score given 2-7. The success of logistic regression stems not only from its use of the unfolded sequences, a characteristic it shares with the excess information analysis depicted in Figure IV-1D. Its distinguishing feature is the ability to directly test for energetic coupling with a sigmoidal folding model (Equation IV-12). The other three algorithms are only able to test for probabilistic coupling, i.e., whether the probability distributions for two positions are independent. This is not a reliable indicator of energetic coupling when folding is a nonlinear function of energy.