comment
reviews
reports
deposited research
interactions
information
refereed research
Research
Evolutionary conservation of
otd/Otx2
transcription factor action:
a genome-wide microarray analysis in
Drosophila
Haiqiong Montalta-He*, Ronny Leemans*, Thomas Loop*, Martin Strahm
†
,
Ulrich Certa
‡
, Michael Primig
§
, Dario Acampora
¶
, Antonio Simeone
¶
and
Heinrich Reichert*
Addresses: *Institute of Zoology, Biozentrum/Pharmazentrum, Klingelbergstrasse 50, University of Basel, CH-4056 Basel, Switzerland. †Roche Bioinformatics and ‡Roche Genetics Pharmaceuticals Division, F. Hoffmann-La Roche Ltd, CH-4070 Basel, Switzerland. §Biozentrum, Klingelbergstrasse 70, University of Basel, CH-4056 Basel, Switzerland. ¶MRC Centre for Developmental Neurobiology, King’s College London, Guy’s Campus, New Hunt’s House, London SE1 1UL, UK.
Correspondence: Heinrich Reichert. E-mail: [email protected]
Abstract
Background: Homeobox genes of the orthodenticle(otd)/Otxfamily have conserved roles in the
embryogenesis of head and brain. Gene replacement experiments show that the Drosophila otd gene and orthologous mammalian Otxgenes are functionally equivalent, in that overexpression of either gene in null mutants of Drosophila or mouse can restore defects in cephalic and brain development. This suggests that otdand Otxgenes control a comparable subset of downstream target genes in either organism. Here we use quantitative transcript imaging to analyze this equivalence of otdand Otxgene action at a genomic level.
Results: Oligonucleotide arrays representing 13,400 annotated Drosophila genes were used to
study differential gene expression in flies in which either the Drosophila otdgene or the human Otx2 gene was overexpressed. Two hundred and eighty-seven identified transcripts showed highly significant changes in expression levels in response to otd overexpression, and 682 identified transcripts showed highly significant changes in expression levels in response to Otx2 overexpression. Among these, 93 showed differential expression changes following overexpression of either otdor Otx2, and for 90 of these, comparable changes were observed under both experimental conditions. We postulate that these transcripts are common downstream targets of the fly otdgene and the human Otx2gene in Drosophila.
Conclusion: Our experiments indicate that approximately one third of the otd-regulated
transcripts also respond to overexpression of the human Otx2gene in Drosophila. These common otd/Otx2 downstream genes are likely to represent the molecular basis of the functional equivalence of otdand Otx2gene action in Drosophila.
Published: 14 March 2002
GenomeBiology2002, 3(4):research0015.1–0015.15
The electronic version of this article is the complete one and can be found online at http://genomebiology.com/2002/3/4/research/0015 © 2002 Montalta-He et al., licensee BioMed Central Ltd
(Print ISSN 1465-6906; Online ISSN 1465-6914)
Received: 12 December 2001 Revised: 5 February 2002 Accepted: 13 February 2002
Background
Studies on developmental control genes involved in anterior patterning have revealed a set of homologous genes encoding transcription factors that are required for the development of
family, which includes the Drosophila orthodenticle (otd) and the murine Otx1and Otx2genes [6-9]. The Drosophila otd gene is expressed in the anterior region of the early embryo in a domain that includes the precursors of the pro-cephalic regions of the head, and it is also expressed in ante-rior brain regions and in midline CNS structures [6,10-15]. Mutational inactivation of otd in Drosophila results in defects in head structures and deletions in anterior parts of the brain as well as in ventral nerve cord defects [6,14,16]. The two otd-related genes in the mouse, Otx1and Otx2, are also expressed anteriorly in the embryo in nested domains that include the embryonic forebrain and midbrain [17]. Mutational inactivation of these genes results in specific defects in the head and anterior CNS; Otx2null mice die early in development and fail in specification of the rostral neuroectoderm and proper gastrulation [18-21]. Otx1 null mice are viable but have spontaneous epileptic seizures and abnormalities affecting the dorsal telencephalic cortex [22].
In addition to the remarkable similarities in expression pat-terns and mutant phenotypes of the otd/Otxgene family, in vivo gene replacement experiments provide further evi-dence for conservation of functional properties [3,23-25]. In these cross-phylum rescue experiments, human Otx1or
Otx2genes were overexpressed in Drosophila otdmutants and, conversely, murine Otx1or Otx2genes were replaced with the Drosophila otd gene in the mouse. Human Otx1
and Otx2genes were able to partially rescue the brain and cephalic defects in Drosophila, although Otx2rescues at a lower frequency than otd, and Otx1rescues less efficiently still [24,25]. Similarly, the Drosophila otd gene coding sequence introduced into the mice Otx1 locus was able to rescue most of the brain-patterning defects in Otx1 mouse mutants and, when provided with the appropriate Otx2
posttranslational control elements, also in Otx2 mouse mutants [23,26].
Drosophila and vertebrate otd/Otx gene products share structural homology that is confined mainly to the home-odomain. The 60 amino acid residues of the fly otd home-odomain differ from the homehome-odomains of the human Otx1
and Otx2protein in only three and two amino acids, respec-tively. It thus seems likely that most of the conserved func-tional action of the otd/Otx genes is mediated by the evolutionarily highly conserved homeodomain of the encoded transcription factor [25,27]. Given this highly con-served homeodomain, one might predict that the in vivo
functional equivalence of otd/Otxgenes demonstrated in the cross-phylum rescue experiments is due to the fact that both
otdand Otx genes can control a comparable set of down-stream target genes, irrespective of whether the otd/Otx
genes are expressed in flies or in mammals [27]. However, currently little is known about the downstream targets of either otdor Otxgenes in flies or in mammals, and no infor-mation on common targets of otdand Otxgenes is available in any species context [27,28].
To address this issue at a genome-wide level we have com-bined cross-phylum overexpression experiments with expres-sion profiling using oligonucleotide arrays. We sought to identify the common downstream target genes of fly otdand human Otx2in Drosophila. To this end, we used transgenic flies which carried either the fly otdgene or the human Otx2
gene under the control of a heat-inducible promoter [29-33]. These experiments identified 287 annotated genes that showed highly significant (p@0.001) changes in expression levels in response to otd overexpression in Drosophila. Among these genes, 93 also showed highly significant differ-ential expression changes in response to Otx2 overexpres-sion. Moreover, the expression levels of 90 of these 93 genes were influenced in the same direction, either upregulated or downregulated, by otd and by Otx2 overexpression. In summary, approximately one third of the candidate otd
downstream target genes in Drosophilaalso respond to over-expression of the human Otx2gene homolog and nearly all of them display identical patterns of either up- or downregula-tion under both experimental condidownregula-tions. From a genome-wide perspective, it is likely that the conserved genetic control of these common otd/Otx2downstream genes forms the mol-ecular genetic basis for the striking in vivofunctional similar-ity of otdand Otxgene action in Drosophila.
Results
In vivooverexpression and microarray analysis
In this study, transgenic fly strains carrying the otd coding sequence or the human Otx2 coding sequence under the control of the heat-inducible Hsp70 promoter were used [24]. Stage 10-17 embryos were given a 25-minute heat pulse in order to overexpress the otd or Otx2 genes and allowed to recover for 25 minutes (see Materials and methods). Ubiqui-tous overexpression of otdand Otx2 was verified by whole-mount in situ hybridization with otd- or Otx2-specific antisense RNA probes. These experiments demonstrated that RNA was strongly overexpressed 50 minutes after the onset of heat shock in these strains (data not shown). Wild-type control flies were subjected to the identical heat-shock conditions.
comment
reviews
reports
deposited research
interactions
information
refereed research
Overview of differentially expressed transcripts
An overview of the total number of transcripts that were differentially regulated following otd or Otx2 overexpres-sion is given in Table 1. Two levels of significance for the experimental data are considered in this overview. At a sig-nificance level of [email protected], a total of 287 genes were found to be differentially regulated following otdoverexpression, as compared to heat-shocked wild-type control embryos. This corresponds to 2.1% of the genes represented on the array. At a significance level of [email protected], a total of 762 genes
[image:3.609.56.556.86.548.2]were found to be differentially regulated following otd over-expression, as compared to heat-shocked wild-type control embryos. This corresponds to 5.7% of the genes repre-sented on the array. In both cases, approximately a quarter of the differentially regulated transcripts corresponded to known genes, and the rest corresponded to genes that are currently characterized only by sequence information and predicted function (CG-transcripts as described by Celera Genomics [34]).
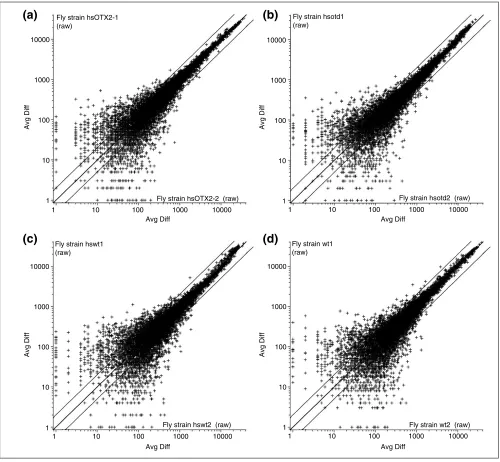
Figure 1
Normalized average difference (Avg Diff) of one pair of replicate arrays for each experimental condition in a log10scale. (a)Heat-shocked Otx2; (b) heat-shocked otd; (c)heat-shocked wild type; (d)wild type. Only probe sets with positive values in both arrays are used. The central line is y= x, and the flanking lines indicate the difference of a factor of two.
1 10 100 1000 10000
Fly strain wt2 (raw) Fly strain wt1
(raw)
1 10 100 1000
Avg Diff
Avg Diff
Avg Diff
Avg Diff
Avg Diff
Avg Diff
Avg Diff
Avg Diff
10000 Fly strain hsOTX2-1
(raw)
Fly strain hsOTX2-2 (raw)
1 10 100 1000 10000
Fly strain hsotd2 (raw) Fly strain hsotd1
(raw)
1 10 100 1000 10000
Fly strain hswt2 (raw) Fly strain hswt1
(raw) 1 10 100 1000 10000
1 10 100 1000 10000
1 10 100 1000 10000
10
1 100 1000 10000
(a)
(b)
Overexpression of the human Otx2 gene in Drosophila
embryos resulted in a larger number of differentially expressed transcripts than did overexpression of the
Drosophila otdgene. At a significance level of p@ 0.001, a total of 682 genes were found to be differentially expressed following Otx2overexpression, as compared to heat-shocked wild-type control embryos. This corresponds to 5.1% of the genes represented on the array. At a significance level of
[email protected], 1,395 genes were found to be differentially expressed following Otx2 overexpression as compared to heat-shocked wild-type control embryos. This corresponds to 10.4% of the genes represented on the array. Again, in both cases, approxi-mately a quarter of the differentially regulated transcripts corresponded to known genes, and the rest were CG-transcripts.
A subset of the transcripts found to be differentially regu-lated following otd overexpression were also differentially regulated following Otx2 overexpression. Among the tran-scripts that were differentially expressed at the significance level of [email protected], 93 transcripts were found to be differen-tially regulated following overexpression of either gene. This implies that 32% of the otd-regulated transcripts were also regulated by Otx2. Among the transcripts that were differen-tially expressed at the significance level of p@0.01, 351 tran-scripts were found to be differentially regulated following overexpression of either gene. This implies that 46% of the
otd-regulated transcripts were also regulated by Otx2. In the following, only genes that were differentially expressed at
the significance level of p@0.001 are considered further. We propose that these genes are potential direct or indirect downstream targets for the homeodomain transcription factors otdand Otx2.
Functional classification of differentially expressed transcripts
When ubiquitously expressed in the embryo, both otdand
Otx2caused a significant transcriptional response of genes encoding a wide variety of functionally different gene prod-ucts. A detailed classification of the otd- and Otx2-regulated transcripts into different functional classes was carried out according to Gene Ontology (GO) and is presented in Table 2. (In the GO classification scheme, a given gene can be grouped into more than one functional class [35]) The
otd- and Otx2-regulated transcripts fall into 92 GO classes, but only about half of these classes are characterized by more than one regulated transcript.
In terms of known function, the two classes with the highest absolute and relative numbers of regulated transcripts were ‘enzymes’ and ‘transcription factors’; this was the case for both otd-regulated and Otx2-regulated transcripts. Other functional classes with high numbers of differentially regu-lated genes were ‘signal transduction’, ‘DNA binding’, ‘transporter’, ‘protein kinase’, ‘motor’, ‘ligand binding or carrier’, and ‘endopeptidase’; again this was the case for both otd- and Otx2-regulated transcripts. Indeed, in most cases in which a functional class was characterized by both
otd- and Otx2-regulated transcripts, the relative number (n/M; see Table 2) of otd-regulated transcripts was similar to that of Otx2-regulated transcripts. For example, 2.79% of the otd-regulated transcripts versus 2.20% of the Otx2 -regulated transcripts were classified under ‘cell adhesion’, and 3.48% of the otd-regulated transcripts versus 3.67% of the Otx2-regulated transcripts were classified under ‘signal transduction’. Approximately half of both the otd-regulated and the Otx2-regulated transcripts belong to the class ‘func-tion unknown’.
Quantitative profiling of differentially expressed transcripts
[image:4.609.55.297.127.322.2]Figure 2 shows the otd-regulated transcripts that correspond to known Drosophilatranscripts and presents a quantitative representation of the change in expression levels for these transcripts. For clarity, these transcripts are only grouped into mother classes and not into the detailed GO classes. Most of the 63 known transcripts that were differentially expressed following otd overexpression showed increased expression levels; less than 20% of these transcripts were downregulated. The gene with the highest increase in expression level (78-fold) was otditself, in accordance with our experimental overexpression protocol. Increases in expression levels above 10-fold were also observed for fork-head domain 96cb (fd96Cb), which encodes a nucleic-acid-binding protein, for patched (ptc), which encodes a protein
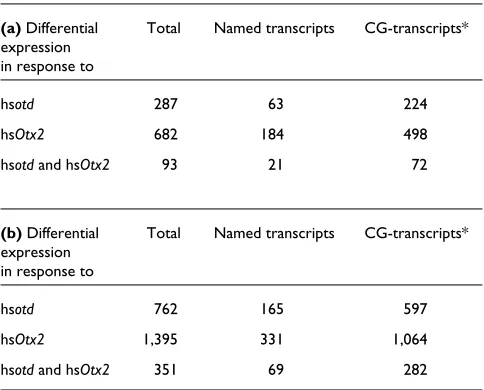
Table 1
Numbers of transcripts differentially regulated by overexpression of otd or Otx2
(a) Differential Total Named transcripts CG-transcripts* expression
in response to
hsotd 287 63 224
hsOtx2 682 184 498
hsotdand hsOtx2 93 21 72
(b)Differential Total Named transcripts CG-transcripts* expression
in response to
hsotd 762 165 597
hsOtx2 1,395 331 1,064
hsotdand hsOtx2 351 69 282
Overview of the numbers of transcripts that were differentially expressed following overexpression of hsp-otd(hsotd) or human hsp-Otx2 (hsOtx2) in
Drosophilaas a result of heat shock. (a)Number of transcripts that were differentially expressed at a significance level of p @0.001. (b)Number of transcripts that were differentially expressed at a significance level of
comment
reviews
reports
deposited research
interactions
information
[image:5.609.60.550.122.742.2]refereed research
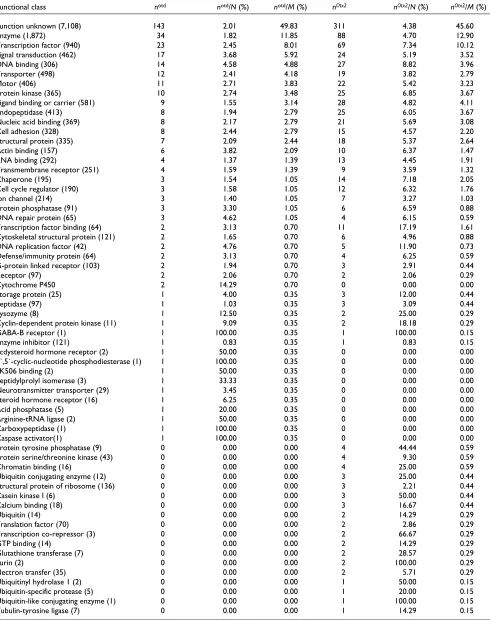
Table 2
Classification of transcripts differentially expressed in response to Otx2and otdoverexpression
Functional class notd notd/N (%) notd/M (%) nOtx2 nOtx2/N (%) nOtx2/M (%)
Function unknown (7,108) 143 2.01 49.83 311 4.38 45.60
Enzyme (1,872) 34 1.82 11.85 88 4.70 12.90
Transcription factor (940) 23 2.45 8.01 69 7.34 10.12
Signal transduction (462) 17 3.68 5.92 24 5.19 3.52
DNA binding (306) 14 4.58 4.88 27 8.82 3.96
Transporter (498) 12 2.41 4.18 19 3.82 2.79
Motor (406) 11 2.71 3.83 22 5.42 3.23
Protein kinase (365) 10 2.74 3.48 25 6.85 3.67
Ligand binding or carrier (581) 9 1.55 3.14 28 4.82 4.11
Endopeptidase (413) 8 1.94 2.79 25 6.05 3.67
Nucleic acid binding (369) 8 2.17 2.79 21 5.69 3.08
Cell adhesion (328) 8 2.44 2.79 15 4.57 2.20
Structural protein (335) 7 2.09 2.44 18 5.37 2.64
Actin binding (157) 6 3.82 2.09 10 6.37 1.47
RNA binding (292) 4 1.37 1.39 13 4.45 1.91
Transmembrane receptor (251) 4 1.59 1.39 9 3.59 1.32
Chaperone (195) 3 1.54 1.05 14 7.18 2.05
Cell cycle regulator (190) 3 1.58 1.05 12 6.32 1.76
Ion channel (214) 3 1.40 1.05 7 3.27 1.03
Protein phosphatase (91) 3 3.30 1.05 6 6.59 0.88
DNA repair protein (65) 3 4.62 1.05 4 6.15 0.59
Transcription factor binding (64) 2 3.13 0.70 11 17.19 1.61
Cytoskeletal structural protein (121) 2 1.65 0.70 6 4.96 0.88
DNA replication factor (42) 2 4.76 0.70 5 11.90 0.73
Defense/immunity protein (64) 2 3.13 0.70 4 6.25 0.59
G-protein linked receptor (103) 2 1.94 0.70 3 2.91 0.44
Receptor (97) 2 2.06 0.70 2 2.06 0.29
Cytochrome P450 2 14.29 0.70 0 0.00 0.00
Storage protein (25) 1 4.00 0.35 3 12.00 0.44
Peptidase (97) 1 1.03 0.35 3 3.09 0.44
Lysozyme (8) 1 12.50 0.35 2 25.00 0.29
Cyclin-dependent protein kinase (11) 1 9.09 0.35 2 18.18 0.29
GABA-B receptor (1) 1 100.00 0.35 1 100.00 0.15
Enzyme inhibitor (121) 1 0.83 0.35 1 0.83 0.15
Ecdysteroid hormone receptor (2) 1 50.00 0.35 0 0.00 0.00
3´,5´-cyclic-nucleotide phosphodiesterase (1) 1 100.00 0.35 0 0.00 0.00
FK506 binding (2) 1 50.00 0.35 0 0.00 0.00
Peptidylprolyl isomerase (3) 1 33.33 0.35 0 0.00 0.00
Neurotransmitter transporter (29) 1 3.45 0.35 0 0.00 0.00
Steroid hormone receptor (16) 1 6.25 0.35 0 0.00 0.00
Acid phosphatase (5) 1 20.00 0.35 0 0.00 0.00
Arginine-tRNA ligase (2) 1 50.00 0.35 0 0.00 0.00
Carboxypeptidase (1) 1 100.00 0.35 0 0.00 0.00
Caspase activator(1) 1 100.00 0.35 0 0.00 0.00
Protein tyrosine phosphatase (9) 0 0.00 0.00 4 44.44 0.59
Protein serine/threonine kinase (43) 0 0.00 0.00 4 9.30 0.59
Chromatin binding (16) 0 0.00 0.00 4 25.00 0.59
Ubiquitin conjugating enzyme (12) 0 0.00 0.00 3 25.00 0.44
Structural protein of ribosome (136) 0 0.00 0.00 3 2.21 0.44
Casein kinase I (6) 0 0.00 0.00 3 50.00 0.44
Calcium binding (18) 0 0.00 0.00 3 16.67 0.44
Ubiquitin (14) 0 0.00 0.00 2 14.29 0.29
Translation factor (70) 0 0.00 0.00 2 2.86 0.29
Transcription co-repressor (3) 0 0.00 0.00 2 66.67 0.29
GTP binding (14) 0 0.00 0.00 2 14.29 0.29
Glutathione transferase (7) 0 0.00 0.00 2 28.57 0.29
Furin (2) 0 0.00 0.00 2 100.00 0.29
Electron transfer (35) 0 0.00 0.00 2 5.71 0.29
Ubiquitinyl hydrolase 1 (2) 0 0.00 0.00 1 50.00 0.15
Ubiquitin-specific protease (5) 0 0.00 0.00 1 20.00 0.15
Ubiquitin-like conjugating enzyme (1) 0 0.00 0.00 1 100.00 0.15
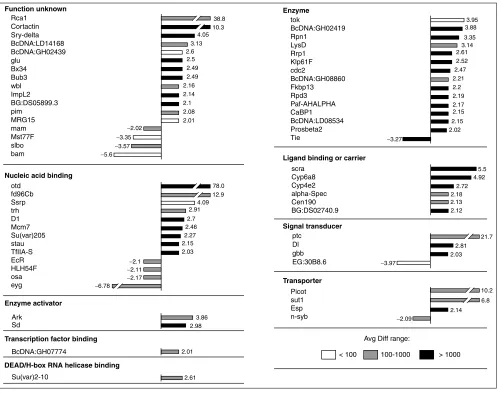
involved in signal transduction, for picot, which encodes a transporter, and for cortactin and Regulator of cyclin A1
(Rca1), which encode gene products of currently unknown molecular function. Only two transcripts showed increases in the 5-10-fold range, namely sugar transporter1 (sut1) encoding a protein involved in sugar transportation, and
scraps (scra) encoding an actin-binding protein. The major-ity of the upregulated transcripts had increases in the 2-5-fold range. The transcript with the most marked decrease in expression was eyegone (eyg), encoding a tran-scription factor known to be involved in eye development.
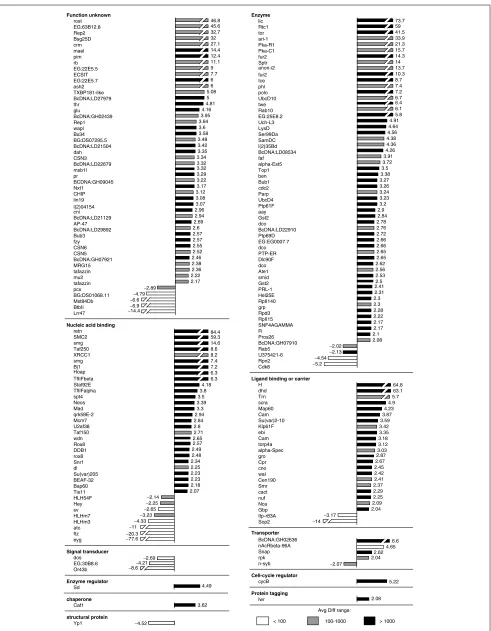
Figure 3 shows the Otx2-regulated transcripts that corre-spond to known Drosophilagenes and presents a quantita-tive representation of their expression level changes. Again, these transcripts are grouped into mother classes and not into detailed GO classes. As was the case for otd overexpres-sion, most of the known transcripts that were differentially
expressed following Otx2overexpression showed increased expression levels. For example, in the functional class of ‘enzyme’, 45 out of 49 transcripts were upregulated. In total, less than 13% of the 184 Otx2-regulated known transcripts were downregulated. Increases in expression levels above 10-fold were observed for 23 genes and for 6 of these genes,
retained (retn),SMC2,licorne (lic),Rtc1,Hairless (H) and
deadhead (dhd), the increases were greater than 50-fold. Twenty-two transcripts showed increases in the 5-10-fold range, and, similarly to the otd overexpression situation, increases of 2-5-fold dominated in most of the functional classes. The transcript with the most marked decrease in expression was once again eyg.
Common candidate downstream genes of otd
andOtx2
[image:6.609.55.560.115.433.2]Ninety-three transcripts were differentially expressed in response to both otdoverexpression and Otx2overexpression.
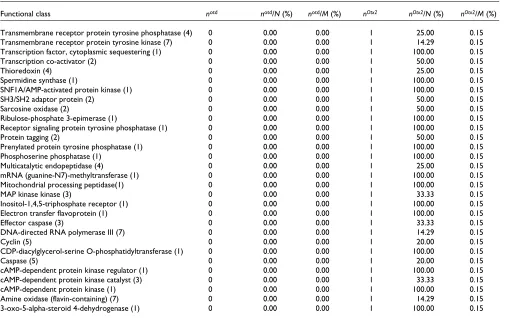
Table 2 (continued)
Classification of transcripts differentially expressed in response to Otx2and otdoverexpression
Functional class notd notd/N (%) notd/M (%) nOtx2 nOtx2/N (%) nOtx2/M (%)
Transmembrane receptor protein tyrosine phosphatase (4) 0 0.00 0.00 1 25.00 0.15
Transmembrane receptor protein tyrosine kinase (7) 0 0.00 0.00 1 14.29 0.15
Transcription factor, cytoplasmic sequestering (1) 0 0.00 0.00 1 100.00 0.15
Transcription co-activator (2) 0 0.00 0.00 1 50.00 0.15
Thioredoxin (4) 0 0.00 0.00 1 25.00 0.15
Spermidine synthase (1) 0 0.00 0.00 1 100.00 0.15
SNF1A/AMP-activated protein kinase (1) 0 0.00 0.00 1 100.00 0.15
SH3/SH2 adaptor protein (2) 0 0.00 0.00 1 50.00 0.15
Sarcosine oxidase (2) 0 0.00 0.00 1 50.00 0.15
Ribulose-phosphate 3-epimerase (1) 0 0.00 0.00 1 100.00 0.15
Receptor signaling protein tyrosine phosphatase (1) 0 0.00 0.00 1 100.00 0.15
Protein tagging (2) 0 0.00 0.00 1 50.00 0.15
Prenylated protein tyrosine phosphatase (1) 0 0.00 0.00 1 100.00 0.15
Phosphoserine phosphatase (1) 0 0.00 0.00 1 100.00 0.15
Multicatalytic endopeptidase (4) 0 0.00 0.00 1 25.00 0.15
mRNA (guanine-N7)-methyltransferase (1) 0 0.00 0.00 1 100.00 0.15
Mitochondrial processing peptidase(1) 0 0.00 0.00 1 100.00 0.15
MAP kinase kinase (3) 0 0.00 0.00 1 33.33 0.15
Inositol-1,4,5-triphosphate receptor (1) 0 0.00 0.00 1 100.00 0.15
Electron transfer flavoprotein (1) 0 0.00 0.00 1 100.00 0.15
Effector caspase (3) 0 0.00 0.00 1 33.33 0.15
DNA-directed RNA polymerase III (7) 0 0.00 0.00 1 14.29 0.15
Cyclin (5) 0 0.00 0.00 1 20.00 0.15
CDP-diacylglycerol-serine O-phosphatidyltransferase (1) 0 0.00 0.00 1 100.00 0.15
Caspase (5) 0 0.00 0.00 1 20.00 0.15
cAMP-dependent protein kinase regulator (1) 0 0.00 0.00 1 100.00 0.15
cAMP-dependent protein kinase catalyst (3) 0 0.00 0.00 1 33.33 0.15
cAMP-dependent protein kinase (1) 0 0.00 0.00 1 100.00 0.15
Amine oxidase (flavin-containing) (7) 0 0.00 0.00 1 14.29 0.15
3-oxo-5-alpha-steroid 4-dehydrogenase (1) 0 0.00 0.00 1 100.00 0.15
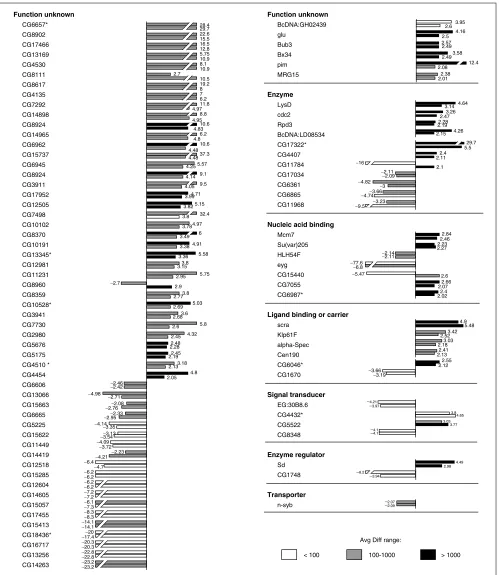
This indicates that approximately one third of the otd -regu-lated genes in Drosophilaalso respond to overexpression of the human Otx2gene homolog. Figure 4 shows the expres-sion levels for these transcripts, which are likely to represent the common downstream target genes for otd and Otx2. Twenty-one of these transcripts correspond to known
Drosophilagenes and 72 correspond to annotated CG-tran-scripts. The expression levels of all of the known transcripts were influenced in the same manner by overexpression of otd
and Otx2, in that a given downstream target gene was either upregulated in both cases or downregulated in both cases. Moreover, for most of these transcripts the absolute expres-sion levels were similar in response to otdand to Otx2. Two marked exceptions were pimple (pim), which was upregu-lated 12.4-fold following Otx2 overexpression and 2.1-fold
following otdoverexpression, and eyg, which was downregu-lated 77.6-fold following Otx2overexpression (but see PCR data below) and downregulated 6.8-fold following otd over-expression. Similarly, the expression levels of 68 of the CG transcripts were influenced in the same manner by overex-pression of otdand Otx2. Only in the three remaining cases were transcripts upregulated by overexpression of one of the
otd/Otxtransgenes and downregulated by overexpression of the other. Thus, approximately one third of the candidate otd
downstream target genes in Drosophilaare controlled in a comparable manner by the human Otx2gene homolog.
There are a number of interesting genes among these common candidate genes. The four known transcripts in class ‘ligand binding or carrier’, scra,Kinesin-like protein at
comment
reviews
reports
deposited research
interactions
information
[image:7.609.58.557.85.479.2]refereed research
Figure 2
Known transcripts differentially expressed in response to overexpression of otd, grouped according to functional classes. Bars represent the fold change between differentially expressed transcripts in heat-shocked wild-type embryos and heat-shocked otdembryos. Positive values indicate that the relative expression level of a gene is increased (upregulated) following otdoverexpression and negative values indicate a decrease (downregulated). Absolute average difference (Avg Diff) values are given for the otdoverexpression condition as follows: white bars, Avg Diff < 100; gray bars, Avg Diff from 100-1,000; black bars, Avg Diff > 1,000.
Function unknown Enzyme
Ligand binding or carrier Nucleic acid binding
Signal transducer
Transporter
Enzyme activator
Ark Sd
Transcription factor binding
BcDNA:GH07774
Su(var)2-10
4.05 3.13 2.6 2.5 2.49 2.49 2.16 2.14 2.1 2.08 2.01
−2.02
−3.35
−3.57
−5.6
38.8 10.3
3.95 3.88 3.35 3.14 2.61 2.52 2.47 2.21 2.2 2.19 2.17 2.15
5.5 4.92 2.72 2.18 2.13 2.12
21.7 2.81 2.03
−3.97
10.2 6.8 2.14
−2.09
2.15 2.02
−3.27
4.09 2.91 2.7 2.46 2.27 2.15 2.03
3.86 2.98
2.01
2.61
−2.1
−2.11
−2.17
−6.78
12.9 78.0
Avg Diff range:
< 100 100-1000 > 1000
Rca1 Cortactin Sry-delta BcDNA:LD14168 BcDNA:GH02439 glu
Bx34 Bub3 wbl ImpL2 BG:DS05899.3 pim
MRG15 mam Mst77F slbo bam
otd fd96Cb Ssrp trh D1 Mcm7 Su(var)205 stau TfIIA-S EcR HLH54F osa eyg
DEAD/H-box RNA helicase binding
tok
BcDNA:GH02419 Rpn1
LysD Rrp1 Klp61F cdc2
BcDNA:GH08860 Fkbp13 Rpd3 Paf-AHALPHA CaBP1 BcDNA:LD08534 Prosbeta2 Tie
scra Cyp6a8 Cyp4e2 alpha-Spec Cen190 BG:DS02740.9
ptc Dl gbb EG:30B8.6
Figure 3(see legend on the next page)
Function unknown Enzyme
rost lic EG:63B12.8 Rtc1 Rep2 tor Bsg25D ari-1 crm Pka-R1 mael Pka-C1 pim fur2 rb Sptr EG:22E5.5 anon-i2 ECSIT fur2 EG:22E5.7 Ice ash2 phl TXBP181-like polo BcDNA:LD27979 UbcD10 thr twe glu Rab10 BcDNA:GH02439 EG:25E8.2 Rep1 Uch-L3 wapl LysD Bx34 Ser99Da BG:DS07295.5 SamDC BcDNA:LD21504 l(2)35Bd dah BcDNA:LD08534 CSN3 faf BcDNA:LD22679 alpha-Est5 msb1l Top1 pr ben BCDNA:GH09045 Bub1 Nxt1 cdc2 CHIP Parp lin19 UbcD4 l(2)04154 Ptp61F cni aay BcDNA:LD21129 Gst2 AP-47 dco BcDNA:LD29892 BcDNA:LD22910 Bub3 Ptp69D fzy EG:EG0007.7 CSN6 dco CSN5 PTP-ER BcDNA:GH07921 Dlc90F MRG15 dco tafazzin Ate1 mu2 smid tafazzin Gst2 pcx PRL-1 BG:DS01068.11 Hel25E Mst84Db RpII140 BtbII grp Lrr47 Rpd3 RpII15
Nucleic acid binding SNF4AGAMMA
retn R SMC2 Pros26 smg BcDNA:GH07910 Taf250 Rab5 XRCC1 U375421-6 smg Rpn2 Bj1 Cdk8 Hoap
TfIIFbeta Ligand binding or carrier
Stat92E H TfIIFalpha dhd spt4 Trn Neos scra Mad Map60 qrk58E-2 Cam Mcm7 Su(var)2-10 U2af38 Klp61F Taf150 ebi wdn Cam Rox8 torp4a DDB1 alpha-Spec rox8 gro Snr1 Cpr dl cno Su(var)205 wal BEAF-32 Cen190 Bap60 Smr Tis11 cact HLH54F nuf Hey Nca sv Gbp HLHm7 Itp-r83A HLHm3 Sop2 ato ftz Transporter eyg BcDNA:GH02636 nAcRbeta-96A
Signal transducer Snap
dos rpk
EG:30B8.6 n-syb
Or43b
Cell-cycle regulator Enzyme regulator cycB
Sd Protein tagging chaperone lwr Caf1 structural protein Yp1 5.08 5 4.81 4.16 3.95 3.64 3.6 3.58 3.48 3.42 3.35 3.34 3.32 3.32 3.29 3.22 3.17 3.12 3.08 3.07 2.96 2.94 2.69 2.6 2.57 2.57 2.55 2.52 2.46 2.38 2.36 2.22 2.17 −2.89 −4.79
−−14.4 6.9 −6.6 6 6 7.7 9 11.1 12.4 14.4 27.1 32 32.7 45.6 46.8 4.91 4.64 4.56 4.38 4.36 4.26 3.91 3.72 3.5 3.38 3.27 3.26 3.24 3.23 3.2 2.9 2.84 2.78 2.76 2.72 2.66 2.66 2.65 2.65 2.62 2.56 2.53 2.5 2.41 2.31 2.3 2.3 2.28 2.22 2.17 2.17 2.1 2.08 −2.02 −2.13 −4.54 −5.2 4.18 3.8 3.5 3.39 3.3 2.94 2.84 2.8 2.71 2.65 2.57 2.49 2.48 2.34 2.25 2.23 2.23 2.18 2.07 −2.14 −2.25 −2.65 −3.23 −4.33 −77.6 84.4 59.3 14.6 8.6 8.2 7.4 7.2 6.3 6.3 −11 −20.3 5.7 4.9 4.23 3.87 3.59 3.42 3.35 3.18 3.12 3.03 2.87 2.67 2.45 2.42 2.41 2.37 2.29 2.25 2.09 2.04 −3.17 −14 63.1 64.8 4.65 2.62 2.04 −2.07 6.6 −2.69 −4.21 −8.6 4.49 5.22 3.62 2.08 −4.52
Avg Diff range:
61F(Klp61F),alpha-Spectrin (alpha-spec) and Centrosomal protein 190kD(Cen190), are all involved in actin or micro-tubule binding or movement [36-39]. This finding is intrigu-ing as one of the Otx2downstream genes identified in the mouse is a tropomyosin gene, which also encodes an actin-binding protein [40]. Among the four known transcripts in the class ‘nucleic acid binding’ are the genes Minichromo-some maintenance 7 (Mcm7) and Suppressor of variegation 205 (Su(var)205) [41,42] which encode chromatin-binding proteins, and the genes eyg and HLH54F, which encode transcription factors [43,44]. The four known transcripts in the functional class ‘enzymes’ are Lysozyme D (LysD), cdc2,
Rpd3, and BcDNA:LD08534 [45-48]. Although the cdc2
gene product is classified as ‘enzyme’, it also acts at the G2/M transition of the mitotic cell cycle [47]. Moreover,
Rpd3 encodes a histone deacetylase which is involved in chromatin structure [46]. In the class ‘transporter’ the
n-synaptobrevin (n-syb) gene, encoding a SNAP receptor, is involved in synaptic-vesicle docking and fusion and is expressed in the embryonic CNS [49]. In the class ‘signal transducer’, the gene EG:30B8.6 encodes a putative GABA-B receptor [50]. Finally, the gene Segregation distorter (Sd), classified as ‘enzyme regulator’, encodes a Ran GTPase acti-vator [51]. Among the transcripts of known genes are several genes whose precise functional role is not well defined at the molecular level. These are the Bx34 and MRG15 genes [52,53] which encode components of the nucleus and the
gluon, Bub3and pimgenes which are all involved in mitosis.
gluon encodes a putative component of the condensin complex, and gluon mutants show peripheral nervous system defects during embryogenesis [54]. The gene product of Bub3is localized to the kinetochore and may function in the mitotic checkpoint [55]. pim is expressed in the embry-onic CNS and encodes a protein implicated in mitotic sister-chromatid separation [56].
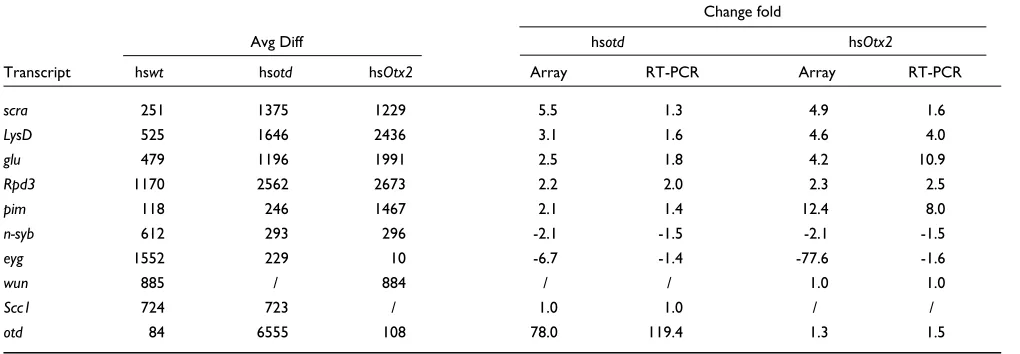
Verification of microarray expression data with RT-PCR
To confirm the differences in gene expression levels after heat-shock induced overexpression of otdand human Otx2
as compared to heat-shocked wild-type embryos, quantita-tive reverse transcription polymerase chain reaction (RT-PCR) was carried out on selected candidate target genes. Changes in expression levels were determined for eight genes that were differentially regulated by otd or human Otx2, namely scra,LysD,glu,Rpd3,pim,n-syb,eyg
andotd. The genes wunen (wun) and Scc1, whose expres-sion levels remained unchanged in response to otdor Otx2
overexpression, were used as controls. As indicated in
Table 3, these experiments showed that the changes in rela-tive expression level, as measured by RT-PCR, are generally consistent with the data obtained with the oligonucleotide arrays. An exception is the data on the response of the eyg
gene to Otx2overexpression; RT-PCR data indicate a weak downregulation (-1.62) whereas oligonucleotide array data indicate a strong downregulation (-77.6).
Discussion
Common downstream target genes for otdand Otx
Cross-phylum gene replacement experiments have shown that the fly otdgene and the homologous human Otxgenes are functionally equivalent in vivo, in that overexpression of either gene in Drosophila otdnull mutants can lead to the restoration of defects in cephalic and brain development [23-26]. We have used a combination of transgenic overex-pression genetics and functional genomics to gain insight into the equivalence of otd and Otx gene expression in
Drosophilaat a comprehensive, genome-wide level. Using inducible overexpression and quantitative transcript imaging through oligonucleotide arrays representing the total number of 13,400 currently annotated Drosophila
genes, we have identified hundreds of candidate down-stream genes for both the fly otdgene and the human Otx2
gene. A comparison of these candidate downstream genes reveals that both otd and Otx genes appear to control an overlapping set of genes; we refer to these genes as common downstream genes. The number of identified common downstream genes for otdand Otx2depends on the statisti-cal level of significance used to determine whether a given gene showed differential expression in response to transgene overexpression. If the analysis is restricted to highly signifi-cant ([email protected]) datasets, we find 93 common downstream genes, equivalent to 32% of the candidate otddownstream genes or approximately 1% of transcripts in the annotated fly genome. If, in contrast, the analysis is based on significant (p@0.01) datasets, we find 351 common downstream genes, equivalent to 46% of the candidate otddownstream genes or approximately 3% of transcripts in the annotated fly genome. In either case, a substantial, but far from complete, set of the otd regulated genes are common downstream targets of both fly and human transgenes.
It is interesting that, at the genome-wide transcript level, the
Otx2gene does not appear to be able to replace otdaction in full; over half of the transcripts that are influenced by otd
overexpression are not influenced by Otx2overexpression. Given the pronounced differences in amino acid sequence
comment
reviews
reports
deposited research
interactions
information
refereed research
Figure 3 (see figure on the previous page)
Figure 4
Transcripts differentially expressed in response to overexpression of otdand in response to overexpression of human Otx2, grouped according to functional classes. Bars represent the fold change between differentially expressed transcripts in heat-shocked wild type embryos and heat-shocked otd or heat-shocked Otx2embryos. The upper bars represent the fold change of differentially expressed transcripts following overexpression of Otx2and the lower bars represent the fold change of differentially expressed transcripts following overexpression of otd. Positive values indicate that the relative expression level of a gene is increased (upregulated) following otdoverexpression and negative values indicate a decrease (downregulated). Avg Diff values are given for the otdoverexpression condition as follows: white bars, Avg Diff < 100; gray bars, Avg Diff from 100-1,000; black bars, Avg Diff > 1,000.
Function unknown Function unknown
CG6657* BcDNA:GH02439
CG8902 glu
CG17466 Bub3
CG13169 Bx34
CG4530 pim
CG8111 MRG15
CG8617
CG4135 Enzyme
CG7292 LysD
CG14898 cdc2
CG8924 Rpd3
CG14965 BcDNA:LD08534
CG6962 CG17322*
CG15737 CG4407
CG6945 CG11784
CG8924 CG17034
CG3911 CG6361
CG17952 CG6865
CG12505 CG11968
CG7498
CG10102 Nucleic acid binding
CG8370 Mcm7
CG10191 Su(var)205
CG13345* HLH54F
CG12981 eyg
CG11231 CG15440
CG8960 CG7055
CG8359 CG6987*
CG10528*
CG3941 Ligand binding or carrier
CG7730 scra
CG2980 Klp61F
CG5676 alpha-Spec
CG5175 Cen190
CG4510 * CG6046*
CG4454 CG1670
CG6606
CG13066 Signal transducer
CG15663 EG:30B8.6
CG6665 CG4432*
CG5225 CG5522
CG15622 CG8348
CG11449
CG14419 Enzyme regulator
CG12518 Sd
CG15285 CG1748
CG12604
CG14605 Transporter
CG15057 n-syb
CG17455 CG15413 CG18436* CG16717 CG13256 CG14263 5.75 2.7 5.57 4.71 5.15 4.97 4.91 5.58 3.8 5.75 −2.7 3.8 5.03 3.6 5.8 4.32 2.48 2.45 3.18 4.8 −2.46 −4.98 −2.08 −2.33 −4.14 −3.13 −4.09 −2.23 4.25 4.14 4.05 3.99 3.82 3.8 3.78 3.49 3.38 3.36 3.15 2.95 2.9 2.77 2.69 2.68 2.6 2.45 2.28 2.19 2.13 2.05 −2.42 −2.71 −2.76 −2.95 −3.35 −3.54 −3.72 −4.21 −6.2 −6.4 28.4 22.6 16.5 8.1 19.2 7 11.8 8.8 10.6 6.2 10.6 37.3 9.1 9.5 32.4 6 −6.2 −7.2 −6.1 −8.3 −20 −20.3 −22.8 −23.2 −14.1 −6.2 29.7 15.5 12.8 10.9 10.9 10.5 8 6.2 −6.2 −7.2 −7.3 −8.3 −17.4 −20.3 −22.8 −23.2 −14.1 4.48 4.48 −4.7 4.97 4.95 4.8 4.83 2.4 −2.11 −4.82 −3.66 −3.23 2.11 2.1 −2.09 −3 −4.74 29.7 −16 5.5 −9.5 −5.47 2.66 2.4 2.6 2.07 2.02 2.55
−3.66 2.12
−3.19 3.95 4.16 2.57 3.58 2.38 2.6 2.5 2.49 2.49 2.08 2.01 12.4 4.64 3.26 2.28 4.26 3.14 2.19 2.47 2.15 2.84 2.23 −2.14 2.46 2.27 −2.11 −77.6 −6.8 4.9 3.42 3.03 5.48 2.18 2.132.41 2.52 −4.21 −3.97 3.8 3.03 4.65 3.77 −4.1 −4.1 4.49 2.98 −3.94 −6.2 −2.07 −2.09
Avg Diff range:
between the OTD and OTX2 proteins, this may not be alto-gether surprising. The OTD and OTX2 proteins consist of 548 and 289 amino acids, respectively. Shared homology between them is restricted to the homeodomain and to a short domain immediately upstream of the homeodomain as well as a tripeptide at the amino terminus [25]. Moreover, as
Otxgenes cannot completely replace the otdgene in cross-phylum rescue experiments in vivo, a complete correspon-dence of otd downstream genes and common otd/Otx
downstream genes might not be expected [3,24,25]. However, approximately one third of the otd-regulated genes do also respond to Otx2overexpression. We suggest that these common downstream genes are likely to explain the overlapping roles of the otd/Otxgenes in cross-phylum rescue experiments in vivo. These target genes reflect the evolutionarily conserved roles of the members of the otd/Otx
gene family in Drosophila. To investigate this further, it will now be important and interesting to carry out similar func-tional genomic analyses of otd and Otx gene action in a mammalian system such as the mouse [27].
otdoverexpression: a genomic perspective on
candidate downstream genes
The experiments reported here identify approximately 300 genes that showed highly significant (p@0.001) changes in expression levels in response to otd overexpression in
Drosophila. The genomic perspective of these identified otd
downstream target genes reveals several features of otd
action at a higher level of insight. First, this finding indicates that the otd gene product, a homeodomain transcription factor, regulates a limited and distinct set of candidate downstream genes. At a significance level of [email protected], 287
genes were found to be differentially regulated, correspond-ing to approximately 2.1% of the transcripts in the annotated fly genome. At a significance level of p@ 0.01, 762 genes were found to be differentially regulated, corresponding to approximately 5.7% of the transcripts in the annotated fly genome. This is further evidence for the notion that homeo-proteins in Drosophila control only a subset and not the majority of the genes in the genome [30]. Indeed, in similar experiments in which the homeobox gene labial(lab) was overexpressed using the same heat-shock protocol as described here, 6.4% of the genes represented on the array used were shown to be differentially regulated at a signifi-cance level of p@ 0.01 [30]. (It should however, be noted that the array used in these laboverexpression experiments represents only 10% of the genes in the fly genome.) Thus the relative number of putative otdtargets appears to be in the same range as the number of putative labtargets.
Second, these experiments show that the OTD home-odomain transcription factor acts on numerous candidate target genes that also encode transcription factors, consis-tent with the idea that homeodomain proteins act through a cascade of transcription factors which regulate the expres-sion of their own subset of downstream genes [57]. Cur-rently, we do not know which of the downstream target genes are direct OTD targets and are, thus regulated directly by OTD protein binding to DNA regulatory sequences, and which are indirect targets. At present, little is known about temporal response of putative target genes following pulsed expression of a transcription factor. Some studies have been carried out on the basis of the assumption that direct targets respond immediately whereas indirect targets respond with
comment
reviews
reports
deposited research
interactions
information
[image:11.609.54.564.123.300.2]refereed research
Table 3
Comparison of change folds between oligonucleotide arrays and RT-PCR
Change fold
Avg Diff hsotd hsOtx2
Transcript hswt hsotd hsOtx2 Array RT-PCR Array RT-PCR
scra 251 1375 1229 5.5 1.3 4.9 1.6
LysD 525 1646 2436 3.1 1.6 4.6 4.0
glu 479 1196 1991 2.5 1.8 4.2 10.9
Rpd3 1170 2562 2673 2.2 2.0 2.3 2.5
pim 118 246 1467 2.1 1.4 12.4 8.0
n-syb 612 293 296 -2.1 -1.5 -2.1 -1.5
eyg 1552 229 10 -6.7 -1.4 -77.6 -1.6
wun 885 / 884 / / 1.0 1.0
Scc1 724 723 / 1.0 1.0 / /
otd 84 6555 108 78.0 119.4 1.3 1.5
RT-PCR was carried out on cDNA derived from heat-shocked wild type (hswt), heat-shocked otd (hsotd) or heat-shocked Otx2 (hsOtx2) embryos. Change folds determined by RT-PCR are represented as the mean value of eight independent replicates, derived from two different cDNA preparations.
a delay due to the time required for intermediary gene expression. Nasiadka and Krause used a kinetic approach to identify direct and indirect targets of the ectopically expressed homeodomain transcription factor fushi tarazu
(ftz) [58]. Their results show that target genes respond to pulses of ftz expression within two distinct temporal windows. Direct responses (no intermediary gene transcrip-tion is required) are 50% complete within about 18 minutes after heat shock. Indirect responses do not reach the same level of response until 26 minutes after heat shock. Assum-ing that otdexpression follows a similar kinetic profile to ftz, it is likely that we have identified primary targets as well as genes whose response was caused by indirect effects requir-ing intermediate transcription.
Third, these results show that the primary consequence of
otdoverexpression in Drosophilais the upregulation of its downstream target genes. Indeed more than 80% of the genes that were differentially expressed following otd over-expression showed increased over-expression levels. This con-trasts with the action of the homeotic gene lab; overexpression of labunder comparable conditions resulted in an approximately equal number of upregulated and down-regulated target genes [30].
The majority of potential downstream target genes of otdare annotated CG-transcripts and, hence, correspond to pre-dicted genes which have not yet been studied in detail in an
in vivocontext. This is surprising given the fact that numer-ous classical genetic screens for genes involved in cephalic and CNS embryogenesis have been carried out [59]. This may indicate that many of the genes involved in those aspects of cephalic and CNS embryogenesis that are under the control of otdin Drosophilahave not yet been identified. Alternatively, this finding may reflect specific constraints of the overexpression experiment. For example, the overex-pression protocol used makes it difficult to control OTD protein concentration and stability. As different levels of a homeoprotein may have different developmental conse-quences, the relatively high level of OTD protein attained may influence target genes that are not affected by the endogenously attained protein level [60,61]. Moreover, the fact that otdoverexpression is not accompanied by simulta-neous overexpression of cofactors, which can act together with homeodomain transcription factors to determine their
in vivotarget specificity, may also lead to nonspecific activa-tion of target genes [62].
Functional genomics of a human transgene
overexpressed in Drosophila
In several cases, human transgenes have been overexpressed in
Drosophilain order to gain insight into the evolutionary con-servation of developmental control gene action [24,25,63-66]. This has also been the primary goal of the overexpression of human Otx2in Drosophilareported here. In addition to the identification of common otd/Otx downstream genes, the
genomic level of analysis reported here has uncovered remarkable similarities in the activity of the human trans-gene in the fly as compared to that of its fly homolog. Thus,
otd and Otx2 both upregulate most of their target genes upon overexpression. Moreover, the target genes of both transcription factors fall into the same functional categories. For example, the classes ‘enzymes’ and ‘transcription factors’ had the highest absolute and relative number of transcripts.
The striking difference in the action of the two transgenes is that overexpression of human Otx2causes expression changes in many more downstream genes than does overexpression of the fly otd gene. The experiments reported here identify approximately 700 genes that showed highly significant ([email protected]) changes in expression levels in response to Otx2; this is more than double the number observed in response to
otd. It is unlikely that this difference is due to corresponding differences in the expression levels attained for Otx2 versus
otdtranscripts. Indeed, the transcript abundance of otdwas higher than that of Otx2in these experiments (see Materials and methods). Nevertheless, these data should be interpreted with caution, as several explanations, not mutually exclusive, are possible for the observation that more genes respond to overexpression of Otx2. First, only one single-transgenic strain of otd and only one single-transgenic strain of Otx2
were used. Thus, strain differences or insertion effects might account for the fact that more genes show differential expres-sion following overexpresexpres-sion of Otx2 compared to overex-pression of otd. Second, it is conceivable that overexpression of Otx2affects more downstream genes in Drosophilathan
otd because the OTX2 transcription factor binds to many more DNA regulatory regions than does OTD. The smaller OTX2 protein might, therefore, have a lower specificity for target gene regulatory regions. Similarly, the OTX2 protein might be more promiscuous than OTD in its interactions with the numerous cofactors that determine target specificity. Third, it has been shown that the DNA-binding specificity of homeoproteins is low in vitro. But given that the home-odomain is conserved and Otx2rescues the otd phenotype, this suggests that they should recruit a similar subset of cofac-tors and regulate a common subset of downstream genes, at least in those tissues where otd is endogenously expressed. Furthermore, the Otx2 product, which is not a fly protein, could influence the expression of a small number of transcrip-tion factors that are not affected by OTD and which then regu-late the expression of their own subset of downstream genes. Whatever the molecular basis for this unexpected difference in the result of Otx2and otdoverexpression may be, its discovery is a further demonstration of the new level of insight that can be attained from a genome-wide functional perspective.
Materials and methods
Embryosby Royet and Finkelstein [67]. For overexpression of human
Otx2, we used the hsp-Otx2 line generated by Leuzinger et al. [24]. All fly stocks were kept on standard cornmeal/yeast/agar medium at 25°C. Embryos were col-lected overnight for 12 h on grape juice plates, kept for a further 4 h at 25°C and then subjected to a 37°C heat shock for 25 min, followed by a recovery period of 25 min at 25°C before RNA isolation. Therefore, at the time of RNA isola-tion these embryos were at embryonic stages 10-17 [29]. Embryos younger than embryonic stage 10 were not used, as heat shock in these earlier stages results in lethality [68]. Embryos used for in situhybridization studies were collected and heat-shock treated in the same way.
Whole-mount in situhybridization
For in situ hybridization, digoxigenin-labeled sense and antisense otd/Otx2 RNA probes were generated in vitro, with a DIG labeling kit (Roche Diagnostics) and hybridized to whole-mount embryos following standard procedure [69]. Hybridized transcripts were detected with an alkaline-phosphatase conjugated anti-digoxigenin Fab fragment (Roche Diagnostics) using Nitro blue tetrazolium (NBT) and 5-bromo-4-chloro-3-indolyl phosphate (BCIP) (Sigma) as chromogenic substrates.
High-density oligonucleotide arrays and hybridization
In this study, a custom-designed Drosophilaoligonucleotide array (roDROMEGAa, Affymetrix, Santa Clara, CA) was used. It contains 14,090 sequences representing Drosophila -spe-cific transcripts, prokaryotic control sequences and custom-chosen sequences for transgenes such as gal4, gfp, andlacZ.
Of the sequences included, 13,998 correspond to Drosophila -specific transcripts annotated by Celera Genome Release 1 [34] and deposited in SWISS-PROT/TrEMBL databases. These 13,998 sequences represent approximately 13,400 genes in the Drosophilagenome and therefore some genes are represented by more than one probe set. Each sequence is represented on the array by a set of 14 oligonucleotide probes (25mers) matching the sequence. To control the specificity of hybridization, the same probes are represented on the array with a single nucleotide mismatch in a central position. As such, each sequence is represented by 14 perfect match and 14 mismatch probes. The average difference (Avg Diff) between the perfect-match hybridization signal and the mis-match signal is proportional to the abundance of a given tran-script [32]. RNA was isolated, labeled, and hybridized to the arrays as described [29,30] with minor modifications.
Data analysis
Probe arrays were scanned with a commercial confocal laser scanner (Hewlett-Packard). Pixel intensities were measured, and expression signals were analyzed with commercial soft-ware (GENECHIP 3.1, Affymetrix). Data processing was carried out using RACE-A (F. Hoffmann-La Roche), Access 97 and Excel 97 (Microsoft) software. Scatter plots were pre-pared using GeneSpringTM software version 4.1 (Silicon
Genetics, Redwood City, CA). For quantification of relative transcript abundance, Avg Diff value was used [32]. Four replicates were carried out for hsp-otdand hsp-Otx2. Three and five replicates were done for heat-shocked wild type and wild type respectively. All arrays were normalized against the mean of the total sums of Avg Diff values across all 16 arrays. In order to avoid huge fold changes, genes with a normalized Avg Diff below 20 were automatically assigned an Avg Diff of 20 (RACE-A protocol). An unpaired t-test for each individual gene was carried out for the following pair-wise comparisons: heat-shocked wild type versus wild type, heat-shocked wild type versus heat-shocked otd, and heat-shocked wild type versus heat-heat-shocked Otx2. For differential transcript imaging, only transcripts that had highly signifi-cant or signifisignifi-cant changes in Avg Diff ([email protected] and
[email protected], respectively) and whose changes were in the two-fold and above range are presented. Additionally, the higher mean Avg Diff of a pairwise comparison for a given tran-script had to be above or equal to 50. To obtain a compre-hensive analysis of the number and identity of genes differentially regulated by otd/Otx2, candidates that were already differentially expressed in heat-shocked wild-type embryos compared to non-heat-shocked wild-type controls were excluded from further analysis (data not shown [30]). For a comprehensive list of all genes with their fold changes and significance levels, see Additional data.
RT-PCR
Poly(A)+RNA (300 ng) was isolated from embryos of wild
type, heat-shocked wild type, heat-shocked otd and heat-shocked Otx2(mRNA isolation kit; Roche Diagnostics) and reverse transcribed with AMV-RT and random hexamers (RT-PCR kit; Roche Diagnostics). PCR was performed with 100 pg template DNA and gene-specific primers (Seq Web, Winsconsin Package Version 10.0, GCG) on a light cycler (LightCycler, Roche Diagnostics). Continuous fluorescence observation of amplifying DNA was possible using SYBR Green I (Roche Diagnostics) After cycling, a melting curve was produced by slow denaturation of the PCR end products, to validate the specificity of amplification. To compare the relative amounts of PCR products we monitored the amplifi-cation profile on a graph, displaying the log of the fluores-cence against the number of cycles. Relative fold changes for a given gene under both conditions (heat-shocked otdversus heat-shocked wild type or heat-shocked Otx2 versus heat-shocked wild type) were calculated using the fit point method (Light Cycler Manufacturer, Roche).
Quantification of otdand human Otx2transcripts by
RT-PCR
Plasmids containing fly otdor human Otx2cDNA were lin-earized with appropriate restriction enzymes and purified. The concentrations of the linearized plasmids were spec-trophotometrically quantified using a GeneQuant RNA/DNA calculator (Pharmacia Biotech) and serial dilutions were made. To quantify the concentration of the otd and Otx2
comment
reviews
reports
deposited research
interactions
information
transcripts from heat-shocked otd and heat-shocked Otx2
embryos, a standard curve was established using the serial dilution of the corresponding linearized plasmid on a light cycler (Roche). RT-PCR was carried out when the standard curve was established. Thereafter, the steady-state concen-trations of the otdand human Otx2were calculated in rela-tion to their standard curves, using the second derivative maximum method (Roche). This showed that the concentra-tions of otdand Otx2transcripts were 1.5 x 10-62g/2l and
3.6 x 10-72g/2l, respectively.
Additional data
The following additional data files are available: a list of the genes on the microarray; Primary data (Avg Diff values, both raw and normalized) for each microarray experiment: heat-shocked otd embryos (replicates 1, 2, 3, 4); heat-shocked
Otx2embryos (replicates 1, 2, 3, 4); heat-shocked wild-type embryos (replicates 1, 2, 3); wild-type embryos (replicates 1, 2, 3, 4, 5); normalization factors for each replicate; compar-isons between pairs of experiments, including the fold change for each gene and the results of a t-test: heat-shocked wild-type embryos compared with heat-shocked otd
embryos; heat-shocked wild-type embryos compared with heat-shocked Otx2 embryos; heat-shocked wild-type embryos compared with wild-type embryos.
These data have been submitted to the Gene Expression Omnibus at the National Center for Biotechnology Informa-tion [70], accession numbers GSM1351-GSM1366 (platform accession GPL70, series accession GSE32).
Acknowledgements
We thank Jan Mous, Adrian Roth, Michel Tessier, Monika Seiler, and Reto Brem for essential contributions and helpful advice. We are particularly grateful to Clemens Broger and Martin Neeb (F. Hoffman-La Roche) for allowing us to use their RACE-A CHIP analysis software and to Volker Schmid and Natalie Yanze for help with the light cycler. We especially thank Reinhold Koch for contributions to standardizing the description of the statistics. We thank all members of our laboratory, especially Boris Egger, Frank Hirth and Martin Mueller for constant and encouraging discus-sions, and Lars Kammermeier for help with the photography. This research was supported by grants from the SNSF and by F. Hoffmann-La Roche.
References
1. Finkelstein R, Boncinelli E:From fly head to mammalian fore-brain: the story of otdand Otx. Trends Genet 1994,10:310-315. 2. Thor S: The genetics of brain development: conserved
pro-grams in flies and mice.Neuron 1995, 15:975-977.
3. Sharman AC, Brand M: Evolution and homology of the nervous system: cross-phylum rescues of otd/Otxgenes.Trends Genet
1998, 14:211-214.
4. Holland LZ, Holland ND: Chordate origins of the vertebrate central nervous system.Curr Opin Neurobiol 1999, 9:596-602. 5. Galliot B, Miller D: Origin of anterior patterning. How old is
our head?Trends Genet 2000, 16:1-5.
6. Finkelstein R, Smouse D, Capaci TM, Spradling AC, Perrimon N: The orthodenticle gene encodes a novel homeo domain protein involved in the development of the Drosophila
nervous system and ocellar visual structures.Genes Dev 1990, 4:1516-1527.
7. Simeone A, Gulisano M, Acampora D, Stornaiuolo A, Rambaldi M, Boncinelli E: Two vertebrate homeobox genes related to the Drosophila empty spiracles gene are expressed in the embryonic cerebral cortex.EMBO J 1992, 11:2541-2550. 8. Simeone A, Acampora D, Mallamaci A, Stornaiuolo A, D’Apice MR,
Nigro V, Boncinelli E: A vertebrate gene related to orthodenti-cle contains a homeodomain of the bicoid class and demar-cates anterior neuroectoderm in the gastrulating mouse embryo.EMBO J 1993, 12:2735-2747.
9. Acampora D, Simeone A: The TINS Lecture. Understanding the roles of Otx1 and Otx2 in the control of brain morpho-genesis.Trends Neurosci 1999, 22:116-122.
10. Gao Q, Wang Y, Finkelstein R: Orthodenticle regulation during embryonic head development in Drosophila.Mech Dev 1996, 56:3-15.
11. Cohen SM, Jurgens G: Mediation of Drosophila head develop-ment by gap-like segdevelop-mentation genes.Nature 1990, 346:482-485. 12. Grossniklaus U, Cadigan KM, Gehring WJ: Three maternal coor-dinate systems cooperate in the patterning of the
Drosophilahead.Development 1994, 120:3155-3171.
13. Schmidt-Ott U, Gonzalez-Gaitan M, Jackle H, Technau GM: Number, identity, and sequence of the Drosophilahead seg-ments as revealed by neural eleseg-ments and their deletion patterns in mutants.Proc Natl Acad Sci USA 1994, 91:8363-8367. 14. Wieschaus E, Perrimon N, Finkelstein R: orthodenticleactivity is
required for the development of medial structures in the larval and adult epidermis of Drosophila. Development 1992, 115:801-811.
15. Finkelstein R, Perrimon N: The orthodenticlegene is regulated by bicoidand torsoand specifies Drosophilahead develop-ment.Nature 1990, 346:485-488.
16. Klambt C, Jacobs JR, Goodman CS: The midline of the
Drosophilacentral nervous system: a model for the genetic
analysis of cell fate, cell migration, and growth cone guid-ance.Cell 1991, 64:801-815.
17. Simeone A, Acampora D, Gulisano M, Stornaiuolo A, Boncinelli E: Nested expression domains of four homeobox genes in developing rostral brain.Nature 1992, 358:687-690.
18. Suda Y, Matsuo I, Kuratani S, Aizawa S: Otx1 function overlaps with Otx2 in development of mouse forebrain and mid-brain. Genes Cells 1996, 1:1031-1044.
19. Matsuo I, Kuratani S, Kimura C, Takeda N, Aizawa S: Mouse Otx2 functions in the formation and patterning of rostral head.
Genes Dev 1995, 9:2646-2658.
20. Ang SL, Jin O, Rhinn M, Daigle N, Stevenson L, Rossant J: A tar-geted mouse Otx2 mutation leads to severe defects in gas-trulation and formation of axial mesoderm and to deletion of rostral brain. Development 1996, 122:243-252.
21. Acampora D, Mazan S, Lallemand Y, Avantaggiato V, Maury M, Simeone A, Brulet P: Forebrain and midbrain regions are deleted in Otx2-/- mutants due to a defective anterior neu-roectoderm specification during gastrulation. Development
1995, 121:3279-3290.
22. Acampora D, Mazan S, Avantaggiato V, Barone P, Tuorto F, Lalle-mand Y, Brulet P, Simeone A: Epilepsy and brain abnormalities in mice lacking the Otx1gene.Nat Genet 1996, 14:218-222. 23. Acampora D, Avantaggiato V, Tuorto F, Barone P, Reichert H,
Finkelstein R, Simeone A: Murine Otx1 and Drosophila otd
genes share conserved genetic functions required in inverte-brate and verteinverte-brate brain development. Development 1998, 125:1691-1702.
24. Leuzinger S, Hirth F, Gerlich D, Acampora D, Simeone A, Gehring WJ, Finkelstein R, Furukubo-Tokunaga K, Reichert H: Equivalence of the fly orthodenticle gene and the human OTXgenes in embryonic brain development of Drosophila. Development
1998, 125:1703-1710.
25. Nagao T, Leuzinger S, Acampora D, Simeone A, Finkelstein R, Reichert H, Furukubo-Tokunaga K: Developmental rescue of
Drosophila cephalic defects by the human Otx genes. Proc
Natl Acad Sci USA 1998, 95:3737-3742.
26. Boyl PP, Signore M, Acampora D, Martinez-Barbera JP, Ilengo C, Annino A, Corte G, Simeone A: Forebrain and midbrain develop-ment requires epiblast-restricted Otx2 translational control mediated by its 3´ UTR. Development 2001, 128:2989-3000. 27. Reichert H, Simeone A: Developmental genetic evidence for a