Journal of Chemical and Pharmaceutical Research, 2016, 8(4):1246-1252
Research Article
CODEN(USA) : JCPRC5
ISSN : 0975-7384
Development and Validation of Stability-indicating HPTLC Method for
Determination of Rizatriptan as Bulk Drug and in Tablet Dosage Form
Ganesh Sarowar, Padmanabh Deshpande*, Yogesh Gandhi and Janvi Bhatt
Department of Pharmaceutical Analysis, AISSMS College of Pharmacy, Kennedy Road, Near R. T. O., Pune – 411 001
_____________________________________________________________________________________________
ABSTRACT
A new simple, accurate, precise and selective stability- indicating high performance thin layer chromatographic (HPTLC) method has been developed and validated for estimation of Rizatriptan in tablet dosage form. The mobile phase selected was Benzene: Methanol (8: 2, v/v) with UV detection at 227 nm. The retention factor for Rizatriptan was found to be 0.50 ± 0.006. The method was validated with respect to linearity, accuracy, precision and robustness as per ICH guidelines. The drug was subjected to stress condition of hydrolysis (acid, base), oxidation and thermal degradation. Results found to be linear in the concentration range of 500-2500 ng band-1. The method has been successfully applied for the analysis of drug in pharmaceutical formulation. The % assay (Mean±S.D.) was found to be 99.78±1.38. The developed method can be used for quantitative determination and checking the stability of Rizatriptan in bulk drug and pharmaceutical dosage form.
Keywords: Rizatriptan, HPTLC, Forced degradation, Validation
_____________________________________________________________________________________________
INTRODUCTION
Rizatriptan (RIZT), chemically, N,N- dimethyl amino-2-[5-(1H-1,2,4-triazol-1-yl methyl) -1H- indol -3-yl] ethanamine is a selective serotonin receptor agonist of the 1B and 1D sub types andused in the acute treatment of migraine attacks [1]. Literature survey revealed that UV spectrophotometric [2, 3], HPLC [4, 5] and LC-MS [6, 7] methods have been reported for the determination of RIZT in pharmaceutical dosage form and in human plasma. Optimization and validation of HPLC assay for RIZT and its impurities in tablets by using chemometric approach has also been reported [8].
to 400 nm.
Preparation of standard stock solution
Working standard solution was prepared by dissolving 10 mg of drug in 10 mL of methanol to get concentration of 1 mg mL-1 from which 5 mL was further diluted to 10 mL with methanol to get solution of 500 ng µL-1.
Selection of detection wavelength
After chromatographic development bands were scanned over the range of 200-400 nm. It was observed that drug showed considerable absorbance at 227 nm. So, 227 nm was selected as the wavelength for detection.
Tablet formulation analysis
Twenty tablets were weighed accurately and finely powdered. A quantity of powder equivalent to 10 mg of Rizatriptan was weighed and transferred to a 10 mL volumetric flask containing approximately 5 mL of methanol and the content was sonicated for 15 min. The solution was filtered using Whatman paper No. 41 and the volume was made up to the mark with methanol to obtain the final concentration of 1000 ng band-1. Fivemililitre volume of above solution was diluted with methanol to obtain final concentration of 500 ng band-1. Two µL volume of this solution was applied on TLC plate to obtain final sample concentration of 1000 ng band-1. After chromatographic development peak areas of the bands were measured at 227 nm and the amount of drug present in sample was estimated from the respective calibration curve. Procedure was repeated six times for the analysis of homogenous sample.
Stress degradation studies of bulk drug
The forced degradation studies were carried out on bulk drug substance in order to prove the stability-indicating property and selectivity of the developed method. The degradation was carried out under acid/base hydrolytic, oxidative, thermolytic stress conditions.
Acid induced degradation
Fig. 1. Representative densitogram acid treated RIZT with degradation product D1(Rf = 0.13) and D2 (Rf = 0.53)
Alkali induced degradation
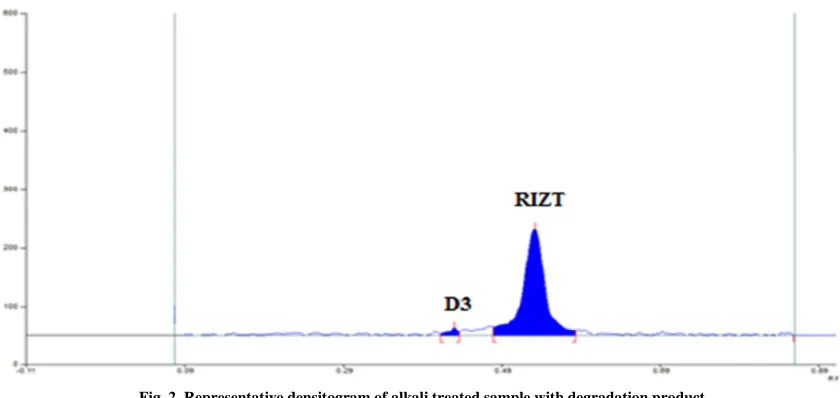
[image:3.595.87.507.406.605.2]From working standard solution of RIZT (1000 ng µL-1), 1 mL of solution was mixed with 1 mL of 0.1 N methanolicNaOH and 8 mL of methanol. The solution was kept at room temperature for 1 h and 15µL of resulting solution was applied on TLC plate and developed under optimized chromatographic conditions. The drug was found to be susceptible to alkali with 12.26 % of degradation. The representative densitogram after alkali treatment is shown in Figure 2.
Fig. 2. Representative densitogram of alkali treated sample with degradation product D3 (Rf = 0.43)
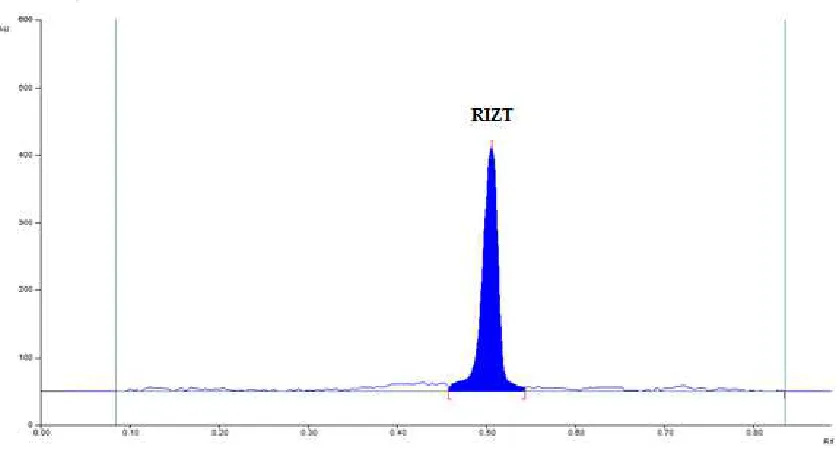
Fig. 3. Representative densitogram obtained after neutral degradation
Oxidative degradation
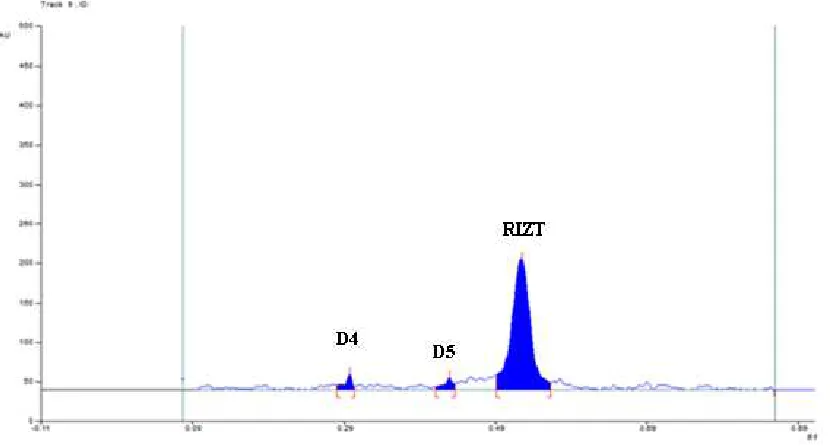
To 1 mL standard solution of RIZT (1000 ng µL-1), 1 mL of 3 % solution of H2O2 and 8 mL of methanol was added
and solution was kept at room temperature for 30 min. 15 µL of resulting solution was applied on TLC plate and developed under optimized chromatographic conditions. Two additional degradation products with 26.62 % of degradation were observed when treated with 3 % H2O2. The representative densitogram after oxidative degradation
is shown in Figure 4.
Fig. 4. Representative densitogram of sample subjected to oxidative degradation with degradation product D4 (Rf = 0.29) and D5 (Rf = 0.45)
Degradation under dry heat
[image:4.595.88.503.384.608.2]Fig. 5. Representative densitogram of sample subjected to dry heat with degradation product D6 (Rf = 0.68)
RESULTS AND DISCUSSION
Optimization of chromatographic conditions
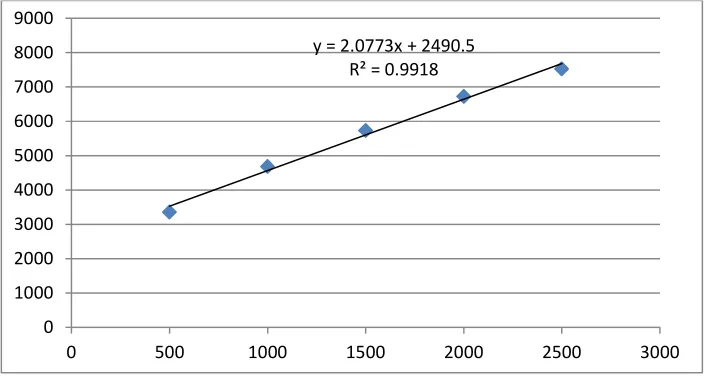
[image:5.595.85.504.419.647.2]linomat sample applicator under nitrogen stream. TLC plates were dried, developed and densitometrically analyzed as described earlier. The linear regression data for calibration curves (n = 6) showed good linear relationship over a concentration range of 500-2500 ng band-1 with high correlation coefficient > 0.991. The calibration curve obtained by plotting peak area against respective concentration is shown in Figure 7.
.
Fig. 7. Calibration curve for RIZT
Precision
Set of three different concentrations in three replicates of standard solutions of RIZT were prepared. All the solutions were analyzed on the same day in order to record any intraday variations in the results. Intra-day variation, as RSD (%), was found to be in the range of 0.22 to 0.31. For Inter day variation study, three different concentrations of the standard solutions in linearity range were analyzed on three consecutive days. Interday variation, as RSD (%) was found to be in the range of 0.36 to 0.61. The lower values of % R.S.D. (< 2) indicated that method was found to be precise.
Limit of detection (LOD) and Limit of quantitation (LOQ)
LOD and LOQ were calculated as 3.3 σ/S and 10 σ/S, respectively; where σ is the standard deviation of the response (y-intercept) and S is the slope of the calibration plot. The LOD and LOQ were found to be 99.90 ng band-1 and 302.73 ng band-1, respectively.
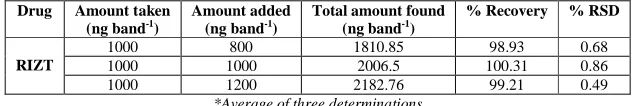
Recovery Studies
y = 2.0773x + 2490.5 R² = 0.9918
0 1000 2000 3000 4000 5000 6000 7000 8000 9000
[image:6.595.121.474.324.512.2]indicated that the method is accurate for estimation of drug in tablet dosage form. The results obtained are shown in Table 2.
Table 2. Recovery Studies of RIZT
Drug Amount taken (ng band-1)
Amount added (ng band-1)
Total amount found (ng band-1)
% Recovery % RSD
RIZT
1000 800 1810.85 98.93 0.68
1000 1000 2006.5 100.31 0.86
1000 1200 2182.76 99.21 0.49
*Average of three determinations
Specificity
The specificity of the method was ascertained by peak purity profiling studies. The peak purity values were found to be more than 995, indicating the no interference of any other peak of degradation product, impurity or matrix.
Robustness Studies
Robustness of the method was determined by carrying out the analysis under conditions during which mobile phase composition, chamber saturation time was altered and the effect on the area of drug was noted. Robustness of the method checked after deliberate alterations of the analytical parameters showed that areas of peaks of interest remained unaffected by small changes of the operational parameters (% R.S.D. < 2). The results are given in Table 3.
Table 3. Robustness Data in Terms of Peak Area (% RSD)
Sr. No. Parameter (% RSD)
1 Mobile phase saturation (± 2 % methanol) 0.34
2 Chamber saturation time (± 10 %) 1.32
*Average of three determinations
CONCLUSION
A new stability- indicating HPTLC method has been developed and validated for estimation of RIZT in bulk and tablet dosage form. The developed method was found to be simple, precise, accurate, and robust and it can be used for the routine analysis of RIZT in both bulk and tablet dosage forms. The forced degradation studies revealed suitability of the method to study stability of RIZT under various degradation conditions like acid, base, oxidative, thermal degradations.
Acknowledgements
The authors express their gratitude to Getz Pharma Research Pvt. Ltd. (Thane, India) for the gift sample of pure RIZT. Thanks are also extended to Dr. Ashwini R. Madgulkar, Principal, A. I. S. S. M. S. College of Pharmacy for providing necessary facilities and her constant support.
REFERENCES
[1] https://en.Wikipedia.Org/Wiki/Rizatriptan (accessed on 21/10/2015)
[2] GP Senthilkumar; PS Yadav; TT Mani; T Tamizh, IJPSR, 2011, 2(8), 2041-2044. [3] S Altinoz; G Ucar; E Yildiz, Analytical Letters, 2002, 35(15), 2471-2485.