Journal of Chemical and Pharmaceutical Research, 2016, 8(3):165-169
Research Article
CODEN(USA) : JCPRC5
ISSN : 0975-7384
Optimization and validation of rapid and simple method for determination of
Isoniazid and Pyrazinamide in plasma by HPLC-UV
O. El Bouazzi
1,2, N. Badrane
1,2, F. Zalagh
1, R. Soulaymani Bencheikh
1,3,
Bengueddour R.
2and L. Ait Moussa
1,21Centre Anti Poison et de Pharmacovigilance du Maroc- Rabat-Maroc
2Faculté des sciences, Universités Ibn Tofail- Kénitra-Maroc
3Faculté de médecine et de pharmacie, Université Mohammed V - Rabat- Maroc
Faculté de Médecine, Université Abd Malek ESSAADI – Tanger - Maroc
_____________________________________________________________________________________________
ABSTRACT
Clinical studies on tuberculosis treatment have shown a correlation between drug exposure and treatment failure and acquired drug resistance. Therefore, a therapeutic monitoring of TB drugs is needed to reduce side effects and to optimize treatment efficacy. The Objective of our study was to develop a high performance liquid chromatography (HPLC) method for the quantification of isoniazid and pyrazinamide. After preparation of the calibration range, the samples were processed by deproteinization solution and then injected into HPLC. The mobile phase used was a mixture of 99% of ammonium acetate solution pH 6 and 1% of acetonitrile, circulating in a column of Wakosil C18
HG (250 mm x 4,6mm; 5 µm) at 20 ° C. Firstly, a specificity and a selectivity for INH and PZA have been
demonstrated, and secondly a linearity and a correlation coefficient close to 1 have been found. The coefficient of variation was less than 15% in repeatability. This rapid and rapid method was validated according to guidelines of COFRAC, and therefore applicable to therapeutic monitoring of antituberculosis drugs.
Keywords: HPLC, Isoniazid, Pyrazinamide, method validation.
_____________________________________________________________________________________________
INTRODUCTION
Figure 1: Molecular structures of rifampicin (a), pyrazinamide (b), ethambutol (c) and isoniazid (d) [8]
EXPERIMENTAL SECTION
2.1 Apparatus
All analysis was performed on a Shimadzu HPLC with a solvent delivery pump (LC-20AD), a UV-visdetector (SPD-10A), anautosampler (SIL-20A), and degasser (FCV-10A-ALVP).The result analysis and data integration was acquired using the Shimadzu LC-Solution software. A centrifuge from HERMLE was used to accelerate phase separation. All solutions were degassed by ultrasonification( Transsonic DIGITALS).
2.2 Chemical reagents and samples
The chemical reagents were HPLC grade solvents (Glacial acetic acid, ammonia, trichloroacetic acid, acetonitrile), all from Fluka. INH, PZA and nicotinamide (IS) standards (≥99,9%) were purchased from Fluka. HPLC grade water was from Chromanorm. Human plasma was acquired from the National Blood Transfusion Center (Rabat, Morocco).
2.3 Chromatography conditions
The separation was made with a column of Wakosil C18 HG (250 mm x 4,6mm;5 µm). The HPLC mobile phase was a mixture of acetonitrile and ammonium acetate solution 0.05 M (1:99, v/v). The pH was adjusted to 6 with ammonia 1N,and the flow rate was constant at 1.2ml/min. 80µl of the preparation was injected into HPLC at 20°C and detection was performed at 275nm.
2.4 Sample preparation
The extraction of analytes from the plasma was carried out using liquid-liquid extraction. In short, 500 µl of plasma and 250 µl of deprotenization solution (IS + trichloroacetic acid) were mixed in a vortex for 1 min, after It was centrifuged at 630×g for 10 min. Finally, the supernatant was dilutedin ammonium acetate solution 0.5 M, pH 8.2.
2.5 Validation of HPLC method
This method was validated according to the COFRAC (SH GTA 04) for specificity, selectivity, precision and stability.
RESULTS AND DISCUSSION
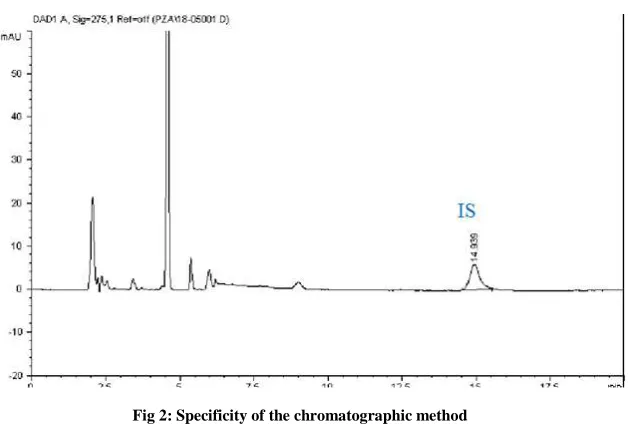
3.1 Specificity of the chromatographic method
Fig 2: Specificity of the chromatographic method
3.2 Selectivity
The method is selective for INH and PZA. At each injection, we obtained the same retention time (RT): 9.628±0.25 min for specific peak of INH, 13.220±0.20 for PZA and 14.960±0.18for IS. The same retention times prove the selectivity of column (Fig3).
Fig 3: Chromatogram showing separations of isoniazid (1), pyrazinamide (2), nicotinamide (IS) (3)
3.3 Limits of Quantification and Detection
The limit of quantification (LOQ), defined as the lowest concentration that could be measured. The LOQ results for both molecules were0.5µg/ml. The lower limits of detection of INH and PZA were respectively 0.10 and 0.12 µg/ml.
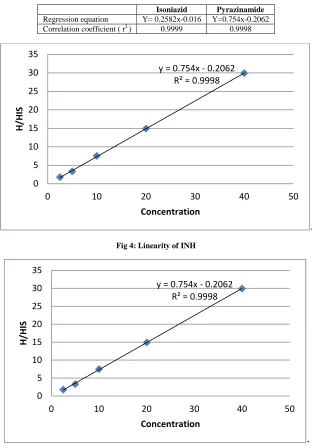
3.3 Linearity
Calibration curve was plotted by getting average of ratio of the height of drug/ height of IS (H/HIS), against the concentrations in µg/ml.
[image:3.595.146.472.339.555.2]Table 1: Linearity parameters for INH and PZA analyzed by HPLC method
Isoniazid Pyrazinamide
Regression equation Y= 0.2582x-0.016 Y=0.754x-0.2062 Correlation coefficient ( r2 ) 0.9999 0.9998
[image:4.595.150.462.86.534.2].
Fig 4: Linearity of INH
.
Fig 5: Linearity of PZA
3.4 Precision
The repeatability was analyzed in the same sample and under the same conditions for each level of concentration. Results were expressed as means of relative standard of deviation (RSD) in percent (Tab2).
The intermediate precision was analyzed from 3 independent series, each consisting of five levels of concentrations. Results were expressed as coefficient of variation (CV) in percent (Tab 2). The values that ≤ 15 % were accepted.
Table 2: parameters of precision for INH and PZA analyzed by HPLC method
Concentrations of Isoniazid (µg/ml)
Concentrations of pyrazinamide (µg/ml)
0.5 1 2 4 8 2.5 5 10 20 40 RSD(%) 1.5 1.8 2 5 8.3 1.5 1.6 4.8 5.3 9.4
CV(%) 9.2 11 13.2 2.2 13.2 10.5 8.1 5.2 12.2 14.4
The values obtained for each concentration level prove the precision of the method.
y = 0.754x - 0.2062 R² = 0.9998
0 5 10 15 20 25 30 35
0 10 20 30 40 50
H
/H
IS
Concentration
y = 0.754x - 0.2062 R² = 0.9998
0 5 10 15 20 25 30 35
0 10 20 30 40 50
H
/H
IS
3.5 Stability
Stability is a very important parameter that ensures the absence of significant changes in the response of the analyte with time. Stock solution stability, and plasma samples stability for 1, 2, and 3 months at −20° were evaluated. Stability was also evaluated on bench at room temperature for 8 hours and at the autosamplerfor 24 h. All stability tests were performed on each drug analyzed by comparison of the peak area of fresh stock solution with those at different storage times. Stability studies showed that stock solutions and quality controls (QCs) are stable (degradation less than 20%) in the storage for at least 3 months. Bench top stability test showed that the two analytes in plasma samples are stable if placed at room temperature for 8 hours. The same results were obtained for samples placed in the autosampler.
CONCLUSION
The purpose of this assay was to validate a simple HPLC method for the quantification of isoniazid and pyrazinamide in order to make the treatment more effective by reducing the severity of side effects, and optimizing the doses administered. The results: linearity, repeatability, intermediate precision, selectivity and specificity confirm that the method is reliable and can be applied to patients.
Acknowledgements
The authors thank the CAPM- LAB (Centre Anti Poison et de Pharmacovigilance du Maroc) and Faculty of science, Ibn Tofail University for supporting this study.
REFERENCES
[1] World Health Organization. Global tuberculosis report 2014. Geneva: World Health Organization, 2014.
[2] World Health Organization. Treatment of tuberculosis: guidelines. 4th ed. Geneva: World Health Organization,
2010.
[3]P-Y Wang; S-Y Xie; Q Hao; C Zhang; B-F Jiang. The International Journal of Tuberculosis and Lung Disease,
2012, 16(5), 589–595.
[4] J Ray; I Gardiner; D Marriott. Internal Medicine Journal, 2003, 33,229–234.
[5] F Marra; CA Marra; N Bruchet; K Richardson; S Moadebi; RK Elwood; JM FitzGerald. International Journal of
Tuberculosis and Lung Disease. 2007. 11(8). 868–875.
[6] A Tavares; E Castroa; M Mendesb; S Freitasa; P CravoRoxo. Portuguese journal of pulmonology.
2015.21(3).144-150.
[7] SW Um; SW Lee; SY Kwon; HI Yoon; KU Park; J Song; CT Lee; JH Lee. The International Journal of
Tuberculosis and Lung Disease. 2007. 11(9). 972–978.
[8] DH Shewiyo; E Kaaleb; PG Rishab; B Dejaegherc; J Smeyers-Verbekec; Y Vander Heydenc. Journal of
![Figure 1: Molecular structures of rifampicin (a), pyrazinamide (b), ethambutol (c) and isoniazid (d) [8]](https://thumb-us.123doks.com/thumbv2/123dok_us/8745028.890562/2.595.161.446.77.270/figure-molecular-structures-rifampicin-pyrazinamide-ethambutol-and-isoniazid.webp)