Output Response Analysis of an 8
th
Order Active RC
Band-Pass Filter Using Matlab
Gabriel A. Igwue*, Nentawe Y. Goshwe**, and Teryima D. Kureve**
*
Department of Electrical and Electronics Engineering,
**
Federal University of Agriculture, Makurdi, Nigeria.
Abstract- In this paper, an active eighth order band-pass filter is implemented. The filter has a center frequency of 15 kHz and roll-off rate of -80dB/decade. The architecture used is the Sallen-Key configuration. The filter parameters and values for the passive components were calculated and the gain magnitude and phase output response is then analyzed with MATLAB software. The simulation shows that the filter has high gain, a wide bandwidth and a good roll-off at the pass band.
Index Terms- Quality factor, centre frequency, Band-pass filter, MATLAB.
I. INTRODUCTION
n modern electronic circuits today, unwanted signals are a major challenge to contend with. This is due to interferences, in the form of noise and harmonics which these unwanted signals pose to certain specified wanted signal frequencies in a band in electronic systems [5-10]. In state-of-the-art RF receivers, high performance filters are required to remove undesired signals at different stages of the receiving process, such as noise from incoming signals the antenna receives, undesired signals at the image frequency, and the effects of harmonics after the mixing operation which attenuates the desired signal [3]. Active filters are used because of the following advantages:
i. Active filters can generate a gain larger than one.
ii. Higher order filters can easily be cascaded in the order
of rising quality factor.
iii. filters are smaller in size as long as no inductors are
used, which makes them very useful in integrated circuits.
The most common filter responses are the Butterworth, Chebyshev, and Bessel types. Among these responses, Butterworth type is used to get a maximally-flat response. Also, it exhibits a nearly flat pass band with no ripple. The roll-off is smooth and monotonic, with a low-pass or high-pass roll-off of 20dB/dec for every pole [1-4].
In this paper, an Eighth order active band pass filter is designed to meet the specifications of different quality factors using MATLAB.
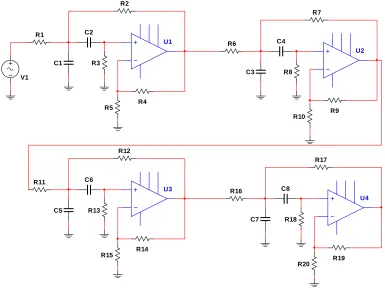
II. DESIGNIMPLEMENTATION
In this paper, the architecture that has been used to
implement the eighth (8th) order band-pass filter is the
Sallen-Key Topology. This topology is chosen due to its simplicity compared to other known architectures such as multiple feedback and state variable.
The 8th order active band pass filter is achieved by cascading
4 identical 2nd order stages with different gains. The cascading is
in the order of rising quality factor; this is done so as to reduce the filter saturation.
Table.1 illustrates the specifications for the desired band-pass filter. By using the following filter parameters, the required filter characteristic is simulated with MATLAB.
Table 1: Sallen key band pass Filter specifications
Centre frequency 15 kHz
Stop band attenuation -80dB
Pass band ripple 0.1dB
U1
R1
R2
R3
R4 R5 C1
C2
U2
R6
R7
R8
R9 R10
C3 C4
U3
R11
R12
R13
R14 R15
C5 C6
U4
R16
R17
R18
R19 R20
[image:2.612.114.499.59.350.2]C7 C8 V1
Fig. 2: Cascaded 8th order active band-pass filter
Individual 2nd order units are evaluated to obtain their transfer function as shown in equations (1-4) below:
C = 10 nF, R3 = 10 k, R4 = 10 k, fo = 15 kHz
R = 1/ (2*π*15000 * 10 x 10-9
) = 1.06k
Bandwidth = fo/Q = 15 kHz/ 1 = 15 kHz For the 1st stage: R1 = R2 = R, R5 = 2R, C1 = C2 = C,
(1)
where
For the 2nd stage: R6 = R7 = R, R8 = 2R, C3 = C4 = C,
(2)
For the 4th stage: R16 = R17 = R, R18 = 2R, C7 = C8 = C,
(4) where
The transfer function for the cascaded Sallen-key 8th order active band pass filter is
H(s) = H1(s)*H2(s)*H3(s)*H4(s)
H(s) = s4C4R4 G4 (5)
s8C8R8 + 4s7C7R7(3-G) + 2s6C6R6[3(3-G)2 + 2] + 4s5C5R5(3-G)[ (3-G)2 + 3] + s4C4R4[(3-G)4 + 12(3-G)2 + 6 ] + 4s3C3R3[(3-G)3 +
3(3-G) ] + 2s2C2R2[3(3-G)2 + 2] + 4sCR(3-G) + 1
in standard form, the above transfer function can be written as
H(s) = A4(ωo4/Q4) s4 (6)
s8 + 4(ωo/Q)s7 + 4(ωo2/Q2)[1.5 + Q2]s6 + 4(ωo3/Q3)[3Q2 + 1]s5 + (ωo4/Q2)[4Q2 + 9]s4 + 4 (ωo5/Q3)[3Q + 1]s3 + 2(ωo6/Q2)[2Q + 3]s2 +
4(ωo7/Q)s + ωo8
III. RESULTS
The results of MATLAB simulation for the second order Active-RC band-pass filter is shown in Fig. 2 and 3 below
10-2 100 102 104 106
-300 -250 -200 -150 -100 -50 0 50
Gain response of 8th-order band-pass filter
frequency, kHz
G
ai
n (
H
db)
[image:3.612.177.424.371.572.2]dB
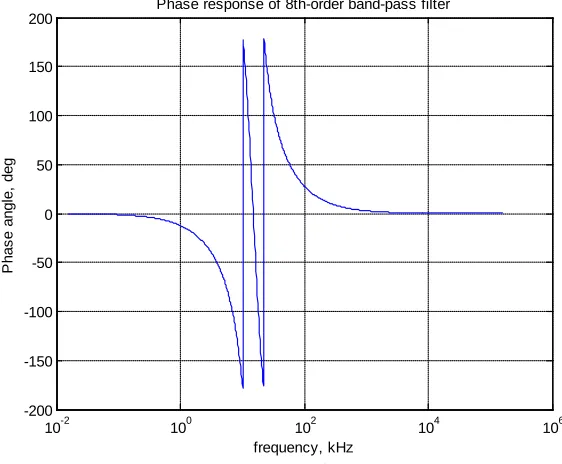
10-2 100 102 104 106 -200 -150 -100 -50 0 50 100 150 200
Phase response of 8th-order band-pass filter
[image:4.612.159.440.67.299.2]frequency, kHz P has e angl e, deg
Fig. 3: Phase response of an 8th order band pass filter
TABLE 3: Characteristic values obtained from the simulation of the 8th order band-pass filter using MATLAB
Quality Factor (Q)
Maximum Gain
FL at
-3dB (kHz)
FH at
-3dB (kHz) Bandwidth (kHz) Center Freq. (kHz)
2.90 35.15 12.63 17.84 5.21 15.01
From Fig. 2 and Table 3, it is observed that, the filter has a maximum gain of 35.15 dB, at a centre frequency of 15.01 kHz, lower and upper cut-off frequencies of 12.63 kHz and 17.84 kHz respectively and a bandwidth of 5.21 kHz at an overall quality factor of 2.90.
It can also be noted from the graph of Fig. 3 that the Phase
response is negative for ω < ωo and positive for ω > ωo
(capacitive). The phase angle of the output signal is in phase
with that of the input by +0o and starts lagging the input up to
the centre or resonant frequency (ωo) point were it becomes
"-180o" degrees lagging the input signal and "out of-phase" and
then changes to lead the input by +180o as the output frequency
increases.
IV. CONCLUSION
An Eighth order active RC band-pass filter with equal stages
[2] James Karki, “Analysis of the Sallen-Key Architecture” Texas Instrument application report, 2002.
[3] Igwue, G.A. (2007), Basic circuit theory and Industrial Electronics for Physicist. Aboki Publishers, Makurdi. Nigeria.
[4] Mark N. Horenstein. Microelectronic Circuits and Devices, 2nd - Edition. Prentice Hall, 1996.
[5] Thomas Kugelstadt, “Active Filter Design Techniques” Texas instrument, pp 16-1, 2008
[6] Reddy M.A. “An Insensitive Active R.C. Filter for high Q and high frequencies”. IEEE Trans. CAS 23 No 7 pp. 429-433, 1976.
[7] Rudolf F. Graf, “Modern Dictionary of Electronics”, seventh-edition, Butterworth-Heinemann, 1999.
[8] Seema Rana, Kapil Dev Sharma and Kirat Pal. “A High Q Band Pass Filter Using Two Operational Amplifiers” Journal of Physical Sciences, Vol. 11, pp 133-138, 2007.
[9] S. Winder, “Analog and Digital Filter Design”, 2nd ed. Woburn, MA: Newnes 2002.
[image:4.612.59.556.345.394.2]University of Agriculture, Makurdi, Nigeria and [email protected]
Third Author – Kureve D. Teryima, M.Eng, B.Eng, Department of Electrical and Electronics Engineering, Federal University of Agriculture, Makurdi, Nigeria and [email protected].