Physical and Sensory Analysis of High Fiber Bread
Incorporated with Jackfruit Rind Flour
Feili R.
1,Wahidu Zzaman
1, Wan Nadiah Wan Abdullah
2, Tajul A. Yang
1,*1Food Technology Division,School of Industrial TechnologyUniversitiSains Malaysia, 11800 Penang, Malaysia
2Divisin of Bioprocess Technology, School of Industrial Technology UniversitiSains Malaysia, 11800 Penang, Malaysia
*Corresponding Author: [email protected]
Copyright © 2013 Horizon Research Publishing All rights reserved.
Abstract
The main objectives of this study were to develop jackfruit-based high fiber bread by utilizing jackfruit rind flour in bread formulation, and to characterize physical properties of produced high fibre bread. Jack fruit rind pieces were undergone few soaking and washing steps prior to get dried and milled. Obtained Jackfruit rind flour (JRF) was incorporated into wheat flour (WF) in three different ratio (5, 10 and 15%) to produce partially substituted wheat flour (WF) with JRF. Allbread samples including bread sample based on WF [BC (as control)], bread based on WF substituted with 5% JRF (B5JRF), bread based on WF substituted with 10% JRF (B10JRF) and bread based on WF substituted with 15% JRF (B15JRF) were undergone proximate and physical analysis. The incorporation of JRFcaused significant influence on bread volume and texture attributes. Increasing the level of JRF incorporated into WF caused an increase in hardness and darkness of bread samples, and decrease in their volume compared to the control. Bread samples substituted with 5% JRF had the highest mean scores of overall acceptance.Keywords
Physical, Sensory Analysis, High Fibre Bread, Jackfruit and Rind Flour1. Introduction
Recently, innovative food products promoted with health benefits are increasingly becoming popular. “Functional Foods” is an interesting research area in processed food industry. Several professional and international health organizations have defined functional foods as a functional food is a food given an additional function by adding new ingredients or more of existing ingredientsthat provide beneficial physiological or health (IFIC, 1998; ILSI, 1999).
High fiber bread is one of the known products categorized in ‘Functional food’ which is health beneficial. According to reports by Guillon and Champ (2000),andGalisteo (2008), high dietary fibre intake has been proved to be beneficial for
human health with reducing effect on colonic cancer. White bread has more popular because of its organoleptic properties (Ingram and Shapter, 2006),however, there are increasing demands toward consumption of high fibre breads due to their health prompting properties.Meanwhile, utilizing some bread enhancer such as calcium propionate and proper processing can significantly improve the texture of high-fiber breads (Stanley and Linda, 2006).
Jackfruit is one of the most important local products in Malaysia whichhas multiple uses in industry and food applications. Food products from jackfruit are varied e.g. fresh jackfruit meat, jackfruit dried slice, jackfruit puree, and jackfruit essence. Jackfruit rind flour is produced from jackfruit residue, a by-product of the jackfruit processing industry. Jackfruit residue represents approximately 2% of the freshly grated meat with a low market value (Asquiri et al., 2008). Upgrading the use of jackfruit residue from animal feed to functional food will be of great benefit to meet the food demands. Bakery products using Jackfruit rind flour as a source of dietary fibre can provide value added income, employment, opportunities and health benefits (Haq, 2002). Moreover the utilization of Jackfruit rind flour is an environment friendly technology since it could solve the waste disposal problem of residues.The aim of this research is to utilize Jackfruit rind flour as dietary fiber ingredient in breadto produce value added bakery product based on jackfruit. Moreover, the physical properties of jack fruit-based high fiber bread were investigated and discussed.
2. Materials and Methods
Materials
milk, etc were purchased from Sunshine Trading, Penang, Malaysia.
Chemicals
Hydrochloric acid (HCl) obtained from Lab Scan (Lab Scan Asia, Thailand), glacial acetic acid obtained from QReC (Brightchem Co., Pulau Pinang, Malaysia). Sodium bisulfite (NaHSO3) was obtained from Bendosen
(Progressive Scientific chemicals Co., Selangor, Malaysia). Other chemicals were purchased from Sigma Aldrich Chemicals (St. Louis, USA). All chemicals were analytical grade.
Preparation of Jackfruit rind flour (JRF)
Jackfruit rind needed to be processed before drying and milling in order to obtain JRF. They were rinsed with running tap water, followed by deionized water and soaked in boiling water for 10 min to soften the texture and then rinsed. Thereafter, they were soaked in a boiling solution of 0.1% w/w sodium bisulfite (NaHSO3) for 10 min and rinsed.
Pieces of jackfruit rind were soaked in another boiling solution of sodium bicarbonate (NaHCO3) for 15 min and
rinsed three times. They were dried in a convection dryer (AFOS Mini Kiln, England) for 24 h at 50° C. The dried samples were ground using a miller and further sieved through a 355-µm mesh sieve. The obtained jackfruit rind flour (JRF) were kept in airtight plastic containers and stored in a fridge at 4°C prior to use.
Proximate analysis of JRF
Proximate compositions of the flour used in this study were important to be evaluated before producing a new
formulation of a dietary fiber-rich bakery product. Proximate analysisfor samples was done according to the standard AOAC method (AOAC, 1998). Moisture, crud fat, crude protein, ash, crude fibre, carbohydrate (by difference) and calorie were analyzed and calculated. All measurement was conducted in triplicates. The results were expressed as g/100 g of dry matter.
Preparation and formulation of bread samples
Wheat flour was replaced by jack fruit rind flour at the level of 5%, 10% and 15 % for the preparation of bread substituted with 5% JRF, (B5JRF), bread substituted with 10% JRF (B10JRF) and bread substituted with 15% JRF (B15JRF) respectively.
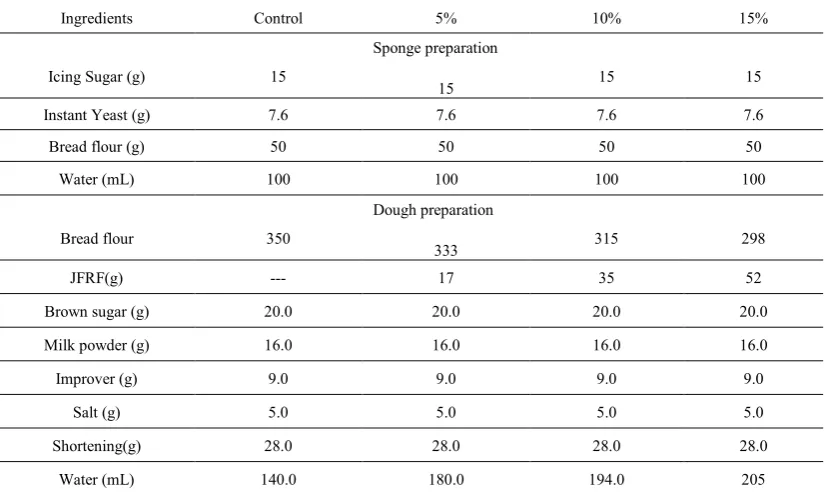
[image:2.595.99.512.488.734.2]A sponge mixture was prepared by using 50 g wheat flour (WF), 15 g of sugar, 7.6 g instant yeast and 100 g water. The ingredients for dough were wheat flour (350 g), sugar (20 g), milk powder (16 g), improver (9 g), salt (5 g), shortening (28 g) and water was calculated according to the Farinograph water absorption method (AACC, 2000). Formulation for bread preparation is summarized in Table 1. The sponge mixture was mixed with the ingredients of dough in a mixer (Spar mixer SP-800, Taichung Hsien, Taiwan) to obtain a smooth and elastic dough. The dough was allowed to rest in a proofer (Bakbar E81, New Zealand) at temperature of 37° C and 85% relative humidity for 40 min. Thereafter, dough was moulded manually and proofed for another 1 h in an aluminum baking pan. It was baked at 180°C for 20 min in an oven (Commercial Turbofan Bakbar E32, New Zealand). After baking, the baked loaf was cooled in room temperature for 1h prior to analysis.
Table 1. Formulation of BC, B5JRF, B10JRFand B15JRF
Ingredients Control 5% 10% 15%
Icing Sugar (g) 15
Sponge preparation
15 15 15
Instant Yeast (g) 7.6 7.6 7.6 7.6
Bread flour (g) 50 50 50 50
Water (mL) 100 100 100 100
Bread flour 350
Dough preparation
333 315 298
JFRF(g) --- 17 35 52
Brown sugar (g) 20.0 20.0 20.0 20.0
Milk powder (g) 16.0 16.0 16.0 16.0
Improver (g) 9.0 9.0 9.0 9.0
Salt (g) 5.0 5.0 5.0 5.0
Shortening(g) 28.0 28.0 28.0 28.0
Water (mL) 140.0 180.0 194.0 205
Volume, specific volume and density measurement
To determine the loaf volume, specific volume and density of samples method 10-05.01 described in AACC (2000) was used which is based on rapeseed displacement. The rapeseeds were poured in a container to measure the volume, and then were measured in a graduated cylinder and marked as V1. Thereafter, a sample was placed in the same
container and seeds poured till the test bread covered. Again the rapeseeds were measured in a graduated cylinder and marked as V2. The volume of sample was then calculated
based on the equation 3.15
Loaf volume (mL)=V1-V2Equation 1
Where V1 represents the volume of rapeseeds in the empty
container (mL), V2 represents volume of the rapeseeds in the
container containing sample (ml).
The specific volume also was calculated as shown in equation 2.
Specific volume (cm3/g)=
𝑙𝑙𝑙𝑙𝑙𝑙𝑙𝑙 𝑣𝑣𝑙𝑙𝑙𝑙𝑣𝑣𝑣𝑣𝑣𝑣 𝑙𝑙𝑙𝑙 𝑏𝑏𝑏𝑏𝑣𝑣𝑙𝑙𝑏𝑏
𝑤𝑤𝑣𝑣𝑤𝑤𝑤𝑤 ℎ𝑡𝑡 𝑙𝑙𝑙𝑙 𝑏𝑏𝑏𝑏𝑣𝑣𝑙𝑙𝑏𝑏
Equation 2The bread density was calculated as shown in equation 3. Density=
(g/cm3)=
𝑊𝑊𝑣𝑣𝑤𝑤𝑤𝑤 ℎ𝑡𝑡 𝑙𝑙𝑙𝑙 𝑏𝑏𝑏𝑏𝑣𝑣𝑙𝑙𝑏𝑏
𝐿𝐿𝑙𝑙𝑙𝑙𝑙𝑙 𝑣𝑣𝑙𝑙𝑙𝑙𝑣𝑣𝑣𝑣𝑣𝑣 𝑙𝑙𝑙𝑙 𝑏𝑏𝑏𝑏𝑣𝑣𝑙𝑙𝑏𝑏
Equation 3Texture Profile Analysis
Texture parameters (hardness, adhesiveness, springiness, cohesiveness, gumminess and chewiness of bread samples were measured objectively by using a texture analyzer TA-XT2i (TAHDI, Stable Microsystem, UK) as adopted by the standard method by AACC, method 74-09 (AAC, 2000). All samples were prepared and baked on the day of test. The probe was calibrated according to the instruction before conducting the test. A cube sample (2cm *2cm* 2cm) was cut from the middle of sample (bread) and was placed centrally beneath the probe [(p/36 cylinder probe (36mm)] in order to meet with a consistent flat surface. The compression test was selected in texture analysis using a 5 kg load cell and sample was compressed to 45% of its original height. The strain required for 45%compression was recorded using the following conditions: pretest speed: 1.0 mm/s, test speed: 1.7 mm/s, post test speed: 10 m/s, compression distance: 25% and trigger type: auto 5 g. the values reported were the average of three readings. Data was analyzed using Texture expert Version 1.05 (Stable Micro system Ltd) software.
Color measurement
To measure the color of samples a Minolta colorimeter (CM, 3500d, Japan) was used based on (CIE) L*a*b* scale. After calibrating the instrument by covering a zero calibration mask (CM-A124) followed by white calibration plate (CM-A120), samples were analyzed by placing on the petri dish (CM-A128) and covered with a black container.
The color attributes i.e. Hunter lightness (L*), redness (a*) yellowness (b*), hue angle and chroma values were recorded by using the spectromagic software version V.3.61G (Minolta Co., Ltd, CyberChrome, Inc). The hue angle ranged 0-360, where 0° indicates as red, 90° indicated yellow, 180°
indicates green and 270° indicates blue color.
Sensory evaluation
Sensory evaluation was conducted for the freshly baked breads by 30 semi-trained panelists consisting of students and staffs (male and female) aged from 25-43 years old from food division, school of industrial technology, university science Malaysia. The sensory was conducted in a laboratory under fluorescent light and ambient temperature using a 7-point hedonic scale as described by Watts et al.(1899). Panellists evaluated the sensory properties of the bread samples based on their degree of like (scale of 1-7) where 1= dislike very much, 2: dislike moderately, 3=dislike slightly, 4=neither like nor dislike, 5=like slightly, 6= like moderately, 7=like very much. The sensory attributes which were evaluated were color, aroma, softness, gumminess, taste and overall acceptability. Those samples were considered as acceptable which their average scores for the overall acceptability were greater than 4.00 which means neither like nor dislike (Lazaridou et al., 2007; Sabanis et al., 2009).
Statistical Analysis
All samples were analyzed in triplicates and results averaged. Statistical analysis was assessed by using SPSS 18.0 Software (SPSS Inc., Chicago, USA). The significant difference between mean values were determined by independent t-test at significance level of p<0.05. Furthermore, significant differences between the mean values were determined by using the analysis of variance (ANOVA) and Duncan’s multiple range test was conducted at a significance level of p<0.05.
3. Results and Discussion
Proximate composition
explained by additional steps during processing the fruit to produce the flour. For example, boiling the jackfruit rind pieces in water may cause loosing water-soluble proteins of the final sample (Rodriguez-Ambriz et al., 2008). On the other hand, higher content of crude fiber in JRF shows that it has the potential to be applied as a high fiber source in bakery products. Generally, since the bran fractions are removed during the milling process of wheat, commercial WF is not known as a rich source of high dietary fiber [Klava, (2004) Bodroza-Solarov et al., 2008)].
Table 2. Proximate composition of wheat flour and jackfruit rind flour (dry weight basis)
Composition (g/100 g of dry
matter) WF JRF
Moisture 12.92±0.03a 9.43±0.13b
Crude fat 0.72±0.01b 0.82±0.04a
Crude protein 12.84±0.73a 4.52±0.04b
Ash 0.78±0.02b 5.91±0.22a
Crude fiber 0.53±0.00b 11.32±2.14a
*Carbohydrate 72.74±1.24a 79.32±2.01b
*Calorie (Kcal/100g of dry matter) 348.80±0.43a 342.74±0.93a
Data are average value of triplicate ± standard deviation. Values in the same row with different superscripts are statistically significant (p<0.05).
The moisture content of JRF is below10% and is within the range of standard category (James, 1995). This low value
may indicate the suitability of JRF for storage and processing also prevention of the triglycerides degradation during the storage (Rodge et al., 2012). Our results showed that JRF contents higher values of crude fat, protein and fiber compared to jackfruit.
Volume, specific volume and density measurement
Results of physical attributes of bread samples including, volume, specific volume and density are indicated in Table 3. As can be seen, substitution of JRF in formula of bread samples caused a significant decrease (p<0.05) of the volume tested breads. According to a report by Ragaee et al. (2011), partial substitution of wheat flour with some grains such as barely, cellulose and oat caused a reduction in volume of loaves of bread. This could be explained by the fact that substitution of bread samples with JRF, cause gluten dilution and consequently, affect the optimal gluten matrix formation during the mixing, fermentation and baking steps. Hung et al., (2007) suggested that increase in water content of dough can be helpful to solve the negative effect of substitution and protein dilution on the loaf volume of tested bread.
Table 3. Volume, specific volume and density of different bread samples
Parameter BC B5JRF B10 JRF B15JRF
Volume 796.04±22.53a 753.26±10.14a 714.78±33.36b 679.32±19.37c
Specific volume 6.21±0.21a 5.33±0.06b 4.42±0.27c 3.73±0.34c
Density 0.17±0.03c 0.18±0.02c 0.23±0.01b 0.26±0.02a
BC: white wheat bread, B5JRF: Bread substituted with 5% JRF, B10JRF: bread substituted with 10% JRF, B15JRF: Bread substituted with 15% JRF Values in the same row with different superscripts are significantly different (p<0.05).
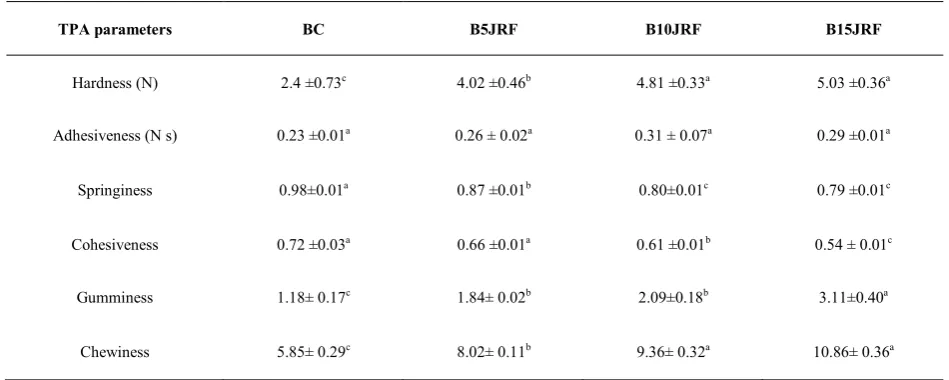
Table 4. Texture parameters of different bread samples
TPA parameters BC B5JRF B10JRF B15JRF
Hardness (N) 2.4 ±0.73c 4.02 ±0.46b 4.81 ±0.33a 5.03 ±0.36a
Adhesiveness (N s) 0.23 ±0.01a 0.26 ± 0.02a 0.31 ± 0.07a 0.29 ±0.01a
Springiness 0.98±0.01a 0.87 ±0.01b 0.80±0.01c 0.79 ±0.01c
Cohesiveness 0.72 ±0.03a 0.66 ±0.01a 0.61 ±0.01b 0.54 ± 0.01c
Gumminess 1.18± 0.17c 1.84± 0.02b 2.09±0.18b 3.11±0.40a
Chewiness 5.85± 0.29c 8.02± 0.11b 9.36± 0.32a 10.86± 0.36a
[image:4.595.92.516.390.488.2] [image:4.595.67.542.535.725.2]Texture profile analysis
The results of texture profile analysis are shown in Table 4. As can be seen, addition of JRF in formulation of bread samples significantly affected the textural properties of the product. Hardness of bread samples were significantly (p<0.05) increased by increasing the JRF in their formula from 2.4 in BC to 5.3 in B15JRF. Bread samples substituted with 15% JRF were not significantly (p<0.05) harder than those with 10% JRF. Hardness is mainly attributed to the amylose and amylopectin matrix which contribute to overall bread texture (Schiraldi and Fessas, 2000). Gomez et al, (2013) reported that bread hardness was due to interactions between gluten and fibrous materials.
Springiness of the bread samples significantly were reduced by addition of JRF in their formulation. The springiness of bread samples containing 10% and 15% JRF were not significantly different (p>0.05). According to a report by Hoseney et al., (1994) interaction between gelatinized starch and gluten dough which cause dough to be more elastic can form continuous sponge structure of bread after heating. Therefore, the high springiness in BC could be attributed to dilution of the gluten structure in composite breads (B5JRF, B10JRF and B15JRF). Lower amount of gluten cause lower ability to hold gases which caused an elasticity reduction in breads (Pyler, 1973).
Adhesiveness was not affected by addition of JRF into bread samples. In contrary, cohesiveness was significantly (p<0.05) affected by addition of JRF in composite breads. It decreased from 0.72 in BC to 0.54 in B15JRF. This reduction indicates that the breads formulated with JRF have low ability to resist before the bread structure deformed under the teeth. Bread samples substituted with JRF showed significantly (p<0.05) higher values of gumminess and chewiness. A report by Wang et al., also showed similar trend for breads with addition of fibers since they caused an
increase in gumminess and chewiness of tested breads.
Color Measurement
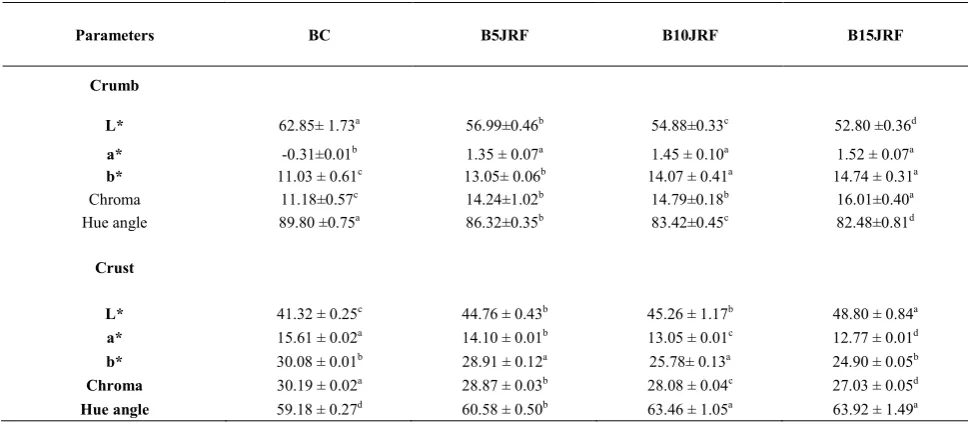
The colour (L*, a*, b*characteristics of crumb and crust of bread samples are given in Table 5. As can be seen, crumb of bread samples partially substituted with JRF had significantly (p<0.05) lower L* value compared to BC (control). As can be seen by increasing the amount of JRF in bread formula, darkness gradually increased with significant difference among all composite breads. This could be visually seen since the crumb of bread samples containing JRF were brownish compared to white color of control.
However, the crust of composite breads which contained JRF tended to be lighter by increasing the JRF ratio. As can be seen, crust of B15JRF was significantly (p<0.05) lighter than those of B10JRF, B5JRF and BC. This increase in lightness could be due to decrease in protein content of composite breads which can affect the Maillard reaction in the crust of bread. The crust characteristic is known to be associated with Maillard reaction, thus containing more protein can increase the Maillard reaction and browner color (Gomez et al., 2003). Yellowness (b*) value of bread crumbs were also significantly (p<0.05) increased by addition of JRF. This might be due to the yellow pigment of JRF. However, opposite trend observed in bread crust which showed significantly lower b* compared to the BC (control).
The crumb of breads with JRF, had significantly (p<0.05) higher chroma values compared to BC. This might be due to higher b* values in crumb of breads. In contrary, crust of breads showed reduction in chroma value by addition of JRF. The Hue angle values of bread crumb containing JRF also were significantly (p<0.05) lower, while it showed an opposite trend in bread crust (Table 5).
Table 5. Color parameters of different bread samples
Parameters BC B5JRF B10JRF B15JRF
Crumb
L* 62.85± 1.73a 56.99±0.46b 54.88±0.33c 52.80 ±0.36d
a* -0.31±0.01b 1.35 ± 0.07a 1.45 ± 0.10a 1.52 ± 0.07a
b* 11.03 ± 0.61c 13.05± 0.06b 14.07 ± 0.41a 14.74 ± 0.31a
Chroma 11.18±0.57c 14.24±1.02b 14.79±0.18b 16.01±0.40a
Hue angle 89.80 ±0.75a 86.32±0.35b 83.42±0.45c 82.48±0.81d
Crust
L* 41.32 ± 0.25c 44.76 ± 0.43b 45.26 ± 1.17b 48.80 ± 0.84a
a* 15.61 ± 0.02a 14.10 ± 0.01b 13.05 ± 0.01c 12.77 ± 0.01d
b* 30.08 ± 0.01b 28.91 ± 0.12a 25.78± 0.13a 24.90 ± 0.05b
Chroma 30.19 ± 0.02a 28.87 ± 0.03b 28.08 ± 0.04c 27.03 ± 0.05d Hue angle 59.18 ± 0.27d 60.58 ± 0.50b 63.46 ± 1.05a 63.92 ± 1.49a
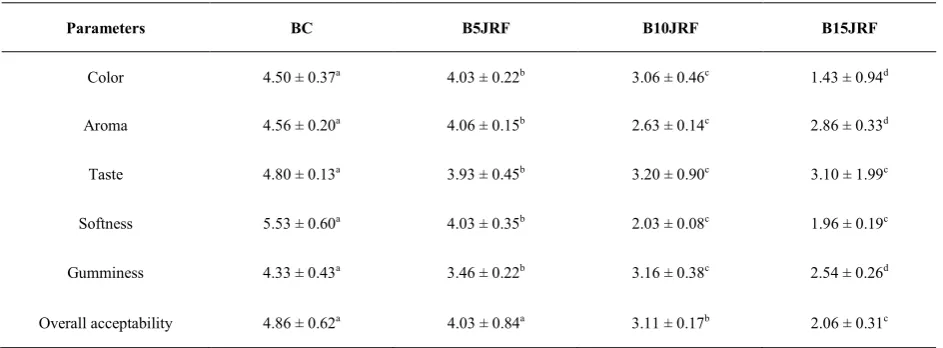
[image:5.595.50.539.521.733.2]Table 6. Average scores of sensory evaluation of bread samples
Parameters BC B5JRF B10JRF B15JRF
Color 4.50 ± 0.37a 4.03 ± 0.22b 3.06 ± 0.46c 1.43 ± 0.94d
Aroma 4.56 ± 0.20a 4.06 ± 0.15b 2.63 ± 0.14c 2.86 ± 0.33d
Taste 4.80 ± 0.13a 3.93 ± 0.45b 3.20 ± 0.90c 3.10 ± 1.99c
Softness 5.53 ± 0.60a 4.03 ± 0.35b 2.03 ± 0.08c 1.96 ± 0.19c
Gumminess 4.33 ± 0.43a 3.46 ± 0.22b 3.16 ± 0.38c 2.54 ± 0.26d
Overall acceptability 4.86 ± 0.62a 4.03 ± 0.84a 3.11 ± 0.17b 2.06 ± 0.31c
BC: commercial wheat bread, B5JRF: Bread substituted with 5% JRF, B10JRF: bread substituted with 10% JRF, B15JRF: Bread substituted with 15% JRF Values in the same row with different superscripts are significantly different (p<0.05).
Sensory evaluation
Table 6 summarized the mean scores of hedonic sensory evaluation for color, aroma, taste, softness, gumminess and overall acceptability of bread samples. As can be seen, substitution of BC with 5%, 10% and 15% JRF had a significant (p<0.05) effect on all sensory parameters of the bread samples. According to ANOVA, taste and softness were not significantly (p<0.05) different in B10JRF and B15JRF. However, both of them showed significantly lower scores in taste and softness compared to B5JRF and BC (control). Generally, addition of JRF had significant effects on sensory attributes and overall acceptability of bread samples.
Addition of JRF caused darker color and denser texture, which at level of 5% seem acceptable for consumers (Table 6). However, increasing incorporation of JRF to 10% or 15% seems to have negative effect on consumer’s overall acceptability. For consumers, color of the bread is one of the important factors in sensory evaluation (Matos and Rossel, 2012) depending on their perception of bread type. Average scores of bread aroma which can be determined by the sense of smell, was significantly (p<0.05) lower in B10JRF and B15JRF compared to B5JRF and BC (control) which showed addition of JRF more than 5% has a negative effect on final product in terms of aroma. As shown in Table 6, same trend observed in taste, softness and gumminess. Scores of softness attribute were in accordance with the results of texture analysis which showed increase in JRF of bread formula can cause harder breads. However, increase in gumminess seems was not acceptable for panelists.
Bread samples which received scores higher than 4 (neither like nor dislike) were considered as acceptable. Therefore, only B5JRF received acceptable scores since had an overall acceptability of 4.03.
4. Conclusion
Based on obtained results, the incorporation of JRF in different ratiocaused significant influence on bread volume and texture attributes. By addition the level of JRF incorporated into WF, the hardness and darkness of bread samples were significantly (p<0.05) increased while their volume significantly (p<0.05) reduced compared to the control (white wheat bread). Bread samples substituted with 5% JRF had the highest mean scores of overall acceptance among samples.Therefore, this knowledge can be used to make commercial products. The introduction of such new technology, would increase overall economic, society health and well-being.
Acknowledgement
Authors are grateful to the Food technology division, School of Industrial Technology, USM, Penang,for the laboratory facilities to conduct the whole study.
REFERENCES
[1] APAARI. 2012. Jackfruit Improvement in the Asia-Pacific
Region– A Status Report. Asia-Pacific Association of Agricultural ResearchInstitutions, Bangkok, Thailand.p.182
[2] Asquieri, E. R.,Rabelo, A. M. D. S., Silva, A. G. M. 2008.
Fermented jackfruit: study on its physicochemical and sensorial characteristics. Ciência e Tecnologia de Alimentos, 28, 4, p. 881-887.
[3] Haq, N. 2002. Improvement of Underutilized Fruits in
Asia.Annual Report.Community Fund, UK.
[4] Galisteo, M., Duarte, J. and Zarzuelo, A. 2008. Effects of
dietary fibers on disturbances clustered in the metabolic syndrome. Journal of Nutritional Biochemistry 19: 71-75.
[image:6.595.70.542.88.262.2]Apestegula, A. 2003.Effect of dietary fibre on dough rheology and bread quality.European Food Research and Technology, 216, 51-56.
[6] Guillon, F., and Champ, M 2000. Structural and physical
properties of dietary fibres, an consequences of processing on human physiology. Journal of Food Research International in the Tropics, 33, 233-245.
[7] Hoseney, R. C. 1994. Principles of Cereal science and
technology. 3rd edition, United Kingdom: American association of cereal chemists, Inc. P. 203-206.
[8] Hung, P.V., Yamamori,, M. and Morita, N. 2005. Formation
of enzyme- resistant starch in bread as affected by high-amylase wheat flour substitution. Cereal Chemistry, 82, 690-694.
[9] Ingram, C., Shapter, S., 2006, Bread, Anness Publishing,
Dewey Edition.
[10] James, C. S., 1995. Analytical Chemistry of Foods, United
Kingdom, Chapman and Hall publishers, P. 39-80
[11] Lazaridou, A., Duta, D., Papageorgiou, M., Belc, C., and
Biliaderis, C. G. 2007. Effects of hydrocolloids on dough rheology and bread quality parameters in gluten-free formulations.Journal of Food Engineering, 79, 1033-1047
[12] Plyer, E. j. 1988. Baking Science and Technology. 3rd
edition, Merriam, Kansas USA, Sosland publishing Co.,pp.
998-1012.
[13] Ragaee, S., Guzar, I., Dhull, K. and Seetharaman, K. 2011.
Effects of fibre addition on antioxidant capacity and nutritional quality of wheat bread.Journal of food Science and Technology, 44, 2147-2153
[14] Rodge, A. B., Sonkamble, S. M., Salve, R. V., and Hashmi,
S. I. 2012. Effect of hydrocolloid (guar gum) incorporation on the quality characteristics of bread.Journal of Food
Processing and Technology.DOI 104172/2157-7110.1000136.
[15] Rodriguez-Ambriz, S. L., Islas-Hernandez, J. J., Agama-
Acevedo, E., Tovar, J., and Bello-Perez, L A. 2008. Characterization of a fibre rich powder prepared by liquefaction of unripe banana flour.Food Chemistry, 107, 1515-1521.
[16] Schiraldi, A., and Fessas, D. (2000). Mechanism of staling.
In C. Pavinee, Vodovotz, (eds). Bred Staling, New York :CRC Press, Inc. P. 2-10.
[17] Stanley, P. C. and Linda, S. Y. 2006. Baked products:
Science, technology and practice. Blackwell Publishing Ltd. 36-37.
[18] Watts, B. M., Ylimaki, G. L., and Jeffery, L. E. 1989, Basic