Effect of Field Plot Design on the Efficacy of
Boom Sprayer
Khurram Yousaf
1, Muhammad Iqbal
1, Tahir Iqbal
2,*, Muhammad Hanif
31Faculty of Agri. Engg. & Tech., University of Agriculture, Faisalabad 2Faculty of Agri. Engg & Tech., PMAS Arid Agriculture University Rawalpindi 3Department of Statistics & Mathematics, PMAS Arid Agriculture University Rawalpindi
*Corresponding Author: [email protected]
Copyright © 2014 Horizon Research Publishing All rights reserved.
Abstract
Field performance of the boom sprayer was evaluated at three different plot sizes, three different operating pressures and at three different forward speeds of tractor. Four spraying operations were performed. At the first two sprays only the sucking insects (Jassid, and Whiteflies) were analyzed for mortality as there were no bollworms at that stage. In third and fourth spray bollworms were analyzed for mortality. The experiment was done to find out the effects of pressure and velocity on mortality of white fly, jassid and bollworms and the effect of field size on field efficiency of boom sprayer. The results indicated that increase in velocity decreases the mortality or sucking insects as well as bollworm insects. Best field speed for crop spraying operation was observed to be 4.0 km/h. Working pressure of 400 kPa has a significant effect on insect mortality. For same width of fields, longer the field more the productive time, therefore, more will be the field efficiency of the sprayer. Lower field speed had more sprayer field efficiency than the greater field speed. The reason could be the more time required for turning at field ends to less maneuverability of tractor the operator might had found difficulty in controlling over the tractor holding more wider sprayer mounted behind.Keywords
Field Plot Design, Boom Sprayer, Cotton Crop and Cotton Insects1. Introduction
Agriculture is the major source of Pakistan’s economy. Nearly 24% of the Gross Domestic Product and 44 % of the total employment are generated in agriculture. Not only that 44 % of country’s man power is engaged in agriculture but also 67.5 % of our population living in rural areas is directly or indirectly associated with agriculture for its living. The estimate of cotton production is about 12.7 million bales for the year 2009-2010. The cotton yield is affected by 8.6 % due to the pest attack in cotton belt. When cotton plants are
examined from above, generally only the upper surfaces of leaves are visible. This upper foliage presents such a barrier that only a small proportion of spray applied reaches downwards to reach stems and petioles. Ideally, nozzles need to direct spray upwards and between branches so that some under-leaf coverage is obtained which would be less expected to be washed off by rain. (Tunstall et al., 1961).
Pesticides have contributed to dramatic increases in crop yields and in the quantity and variety of the diet. Also, they have helped to limit the spread of certain diseases. But pesticides have harmful effects also; like that of injury to human health as well as to the environment. For many reasons, the severity of pesticide hazards is much pronounced in Third World Countries. A number of long persistent organ chlorines and highly toxic organophosphates, which have been banned or severely restricted, are still marketed and used in many developing countries. The misuse of pesticides by concerned individuals, in addition to lack of or weak national controlling plans is behind the outbreak of adverse effects in developing countries (Monsour, 2004).
The operating pressure of any type of hydraulic sprayer critically affects the nozzle’s flow rate/discharge and droplet size. Too low pressure result in poor coverage and bigger droplets which are undesirable for contact action type pesticides. Too high pressure on the other hand results in too small droplets which in turn decreases terminal velocity and may result in increased hazards of excessive drift and evaporation. Therefore, the sprayer should be provided pressure gauges so that the desired pressure could be maintained (Hameed and Rehman, 1996). This study has been designeda) to asses the effect of field plot design on the efficacy of designed boom sprayer. b) to check the effect of different tractor velocities and spray pressures on the mortality rate of insects.
2. Materials and Methods
graduate agricultural research station (PARS), University of Agriculture Faisalabad. Cotton variety BT-448 was sown at beds with row to row spacing of 0.762 m during cotton growing season of 2010. A 2-hectares field (Figure 1) was divided into three sub fields of different sizes (32.31 m * 228.5 m, 32.31 m * 167.65 m and 32.31 m * 103.04m). An improved drop-pipe boom sprayer designed and developed in department of farm machinery and Power, University of agriculture Faisalabad was employed for the control of cotton insects and pests at four stages of crop growth.
First spray Plolo-500 SC (200 ml/acre) was completed when the crop height was 75 cm. The drop-pipes were adjusted vertically hanging down from the main boom pipe. Number of sucking insects i.e. whiteflies and jassid, were counted on the leaves both before and after spraying. Three leaves were picked from the three levels of cotton plants (upper, middle and lower) from each treatment block. (Arif, 2001) Jassid and whitefly mortality was calculated 1-day and 7-day after spraying with the following relationship:
M = N
n
N− x 100 ……….. (1)
Where,
M = % age insect mortality N = No. of insects before spraying n = No. of insects after spraying
Second spray was done on August 15, 2010 in response to serious damage by whiteflies and jassid. Imedaclopride 20 % SL was sprayed at the rate of 100 ml/acre. Average height of a plant was 98 cm. Pest scouting was done just one day before and one day and one week after spraying and mortality of insects calculated using equation 1.
Third spray was done on September 9, 2010. At this stage cotton plants were nearly reached to maturity. The medicine
used was Lamda cyhalothrin 2.2 EL. Very small number of sucking insects at this stage were seen which were less harmful at this stage. Only the target insects were American and Spotted bollworms (ABW, SBW). Pest scouting was done just one day before and one day and one week after spraying and mortality of insects calculated using equation 1.
Fourth spray was done on October 17, 2010. Pest scouting was done just before one day and after one day and one week of fourth spraying. Only the target insects were American and Spotted bollworms. The attack of American bollworms again started after the first week of October due to rainfall. Pest scouting was done just one day before and one day and one week after spraying and mortality of insects calculated using equation 1.
A 3×3×3 factor factorial was employed in randomized complete block design to evaluate the effects of three levels of tractor forward speeds (2.5, 4.0 and 5.5 km/h), three levels of spraying pressures (300, 400 and 500 kpa) at three levels of field plot design (32.31 m * 228.5 m, 32.31 m * 167.65 m and 32.31 m * 103.04m) on field performance of sprayer for insects mortality. Statistical analysis was performed with GLM procedures of SAS (SAS, 2002-03).
3. Results and Discussions
The percentage death rate of the insects with a specific pesticide and equipment is known as insect mortality. It was calculated from the pest scouting data before and after the spraying. The mortality of sucking insects was calculated as per leaf basis while for the bollworms; their mortality was determined for each plant basis.
Effect of spraying pressure on mortality (%) of white fly and jassid after one day (AOD) and after one week (AOW) of first spray
The effects spraying of pressure on % age mortality of white fly and jassid presented in table 1 showed that mortality rate of white fly were significantly greater at pressure P2 (400 kPa) and P3 (500 kPa) than that at pressure P1 (300 kPa) both after one day and after seven days of spraying. At P3 (500 kPa) droplets would have been so small that might not had enough potential to hit the target insects resulting in low mortality. At P1 (300 kPa) the droplets might have not reached at target. Mortality rate of jassid follows the same trend but were not significantly different after one day of spraying. The % age mortality of white fly at P2 was 70.00 % and 93.00 % after one day and after one week respectively. The % age mortality of jassid at P2 was 71.07 % and 95.00 % after one day and after one week respectively. No doubt P2 and P3 did not significantly differ in mortality rate of white fly; however, P2 resulted in 1.02 times greater in mortality rate than that at pressure P3 after one day. Pressures P2 resulted in 1.06 and 1.04 times greater in mortality rate than that at pressure P1 and P3 after one day. The pressures P2 and P3 significantly differ in mortality rate of white fly after one week. The table 1 also depicted that mortality rate of white fly at P1, P2 and P3 pressures were 1.33, 1.32 and 1.30 times greater and mortality rate of jassid at P1, P2 and P3 pressures were 1.29, 1.33 and 1.38 times greater after one week than that at after one day.
Table 1. Effect of Pressure on mortality (%) of white fly and jassid after one day (AOD) and after one week (AOW) of first spray
Pressure White fly Jassid
AOD AOW AOD AOW
P1 62.11b* 83.07c 66.81a* 86.19b
P2 70.00a 93.00a 71.07a 95.00a
P3 68.81a 89.96b 68.00a 94.41a
Mean 66.97 88.49 68.63 91.86
LSD(0.05) 3.33 2.80 5.60 6.79
*Means in each column followed by the same letter are not significantly different at 5 % probability level.
P1 = 300 kPa, P2 = 400 kPa, P3 = 500 kPa, AOD = after one day and AOW = after one week
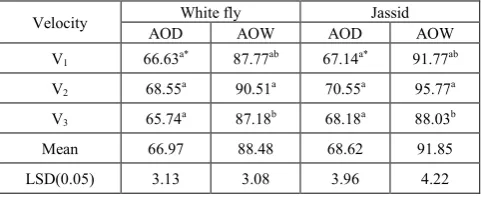
Effect of Velocity on mortality (%) of white fly and jassid after one day (AOD) and after one week (AOW) of first spray
The statistically analyzed data showed in table 2 indicated that spraying velocities significantly effected mortality rate of both white fly and jassid. The % age mortality of white fly at velocity V2 (4.0 km/h) was 68.55 % and 90.51 % after one day and after one week respectively and the % age mortality of jassid at V2 (4.0 km/h) was 70.55 % and 95.77 % after one day and after one week respectively. Velocity V2 resulted in
[image:3.595.312.553.300.399.2]1.02 and 1.04 times greater in mortality rate than that at velocity V1 and V3 after one day. The velocities V1 and V3 did not significantly differ in mortality rate of white fly after one week; however, V2 resulted in 1.03 times greater than that at V1. Velocities V1, V2 and V3 did not significantly differ in mortality rate of jassid; however, V2 resulted in 1.05 and 1.03 times greater in mortality rate than that at velocity V1 and V3 after one day. The table 2 depicted that mortality rate of white fly at V1, V2 and V3 velocities were 1.31, 1.32 and 1.32 times greater and in case of jassid 1.36, 1.35 and 1.29 times greater after one week than that at after one day. Too low V1 (2.5 km/h) field speed might not be suitable due to bending of cotton plants for long time and spray exposure might be away from the target. At too high V3 (5.5 km/h) field speed, the spray might have not hit directly to the target due to fast movement of plants with drop pipes.
Table 2. Effect of Velocity on mortality (%) of white fly and jassid after one day (AOD) and after one week (AOW) of first spray
Velocity AOD White fly AOW AOD Jassid AOW
V1 66.63a* 87.77ab 67.14a* 91.77ab
V2 68.55a 90.51a 70.55a 95.77a
V3 65.74a 87.18b 68.18a 88.03b
Mean 66.97 88.48 68.62 91.85
LSD(0.05) 3.13 3.08 3.96 4.22
* Means in each column followed by the same letter are not significantly different at 5 % probability level. V1 = 2.5 km/h, V2 = 4.0 km/h, V3 = 5.5 km/h, AOD = after one day and AOW = after one week
Effect of spraying pressure on mortality (%) of white fly and jassid after one day (AOD) and after one week (AOW) of second spray
Table 3. Effect of Pressure on mortality (%) of white fly and jassid after one day (AOD) and after one week (AOW) of second spray
Pressure White fly Jassid
AOD AOW AOD AOW
P1 66.11b* 83.66b 66.00b* 85.44b
P2 69.81a 93.66a 71.55a 94.92a
P3 68.40ab 93.48a 67.14b 92.88a
Mean 68.10 90.26 68.23 91.08
LSD(0.05) 2.97 3.32 2.71 4.78
* Means in each column followed by the same letter are not significantly different at 5 % probability level. P1 = 300 kPa, P2 = 400 kPa , P3 = 500 kPa, AOD = After one day and AOW = After one week
the % age mortality of jassid at P2 (400 kPa) was 71.55 % and 94.92 % after one day and after one week respectively. No doubt P2 and P3 did not significantly differ in mortality rate of white fly and jassid; however, P2 resulted in 1.02 times greater in mortality rate of both white fly and jassid than that at pressure P3 after one day. The pressures P2 and P3 did not significantly differ in mortality rates after one week. The table 3 depicted that mortality rate of white fly at P1, P2 and P3 Pressures were 1.26, 1.34 and 1.36 times greater and mortality rate of jassid at P1, P2 and P3 pressures were 1.29, 1.32 and 1.38 times greater after one week than that after one day.
Effect of Velocity on mortality (%) of white fly and jassid after one day (AOD) and after one week (AOW) of second spray
The results showed in table 4 indicated that more mortality of white fly and jassid were achieved at V2 (4.0 km/h) followed by V3 and V1. The % age mortality of white fly at V2 (4.0 km/h) was 68.96 % and 92.03 % after one day and after one week respectively and the % age mortality of jassid at V2 (4.0 km/h) was 69.59 % and 92.00 % after one day and after one week respectively. V1 and V2 did not significantly differ in mortality rate of white fly; however, V2 resulted in 1.03 times greater in mortality rate than that at velocity V1 after one day. The velocities V2 and V3 did not significantly differ in mortality rate after one week; however, V2 resulted in 1.01 times greater than that at V3. No doubt V1, V2 and V3 did not significantly differ in mortality rate of jassid; however, V2 resulted in 1.02 and 1.03 times greater in mortality rate than that at velocity V1 and V3 after one day. The velocities V1, V2 and V3 did not significantly differ in mortality rate after one week; however, V2 resulting in 1.02 times greater than that at V1. The table 4 depicted that mortality rate of white fly at V1, V2 and V3 velocities were 1.31, 1.33 and 1.32 times greater and mortality rate of jassid at V1, V2 and V3 velocities were 1.32, 1.32 and 1.35 times greater after one week than that after one day
Table 4. Effect of Velocity on mortality (%) of white fly and jassid after one day (AOD) and after one week (AOW) of second spray
Velocity White fly Jassid
AOD AOW AOD AOW
V1 66.85a* 88.00b 67.40a* 90.00a
V2 68.96a 92.03a 69.59a 92.00a
V3 68.51a 90.77ab 67.70a 91.25a
Mean 68.10 90.26 68.23 91.08
LSD(0.05) 2.54 3.43 4.69 5.64
* Means in each column followed by the same letter are not significantly different at 5 % probability level. V1 = 2.5 km/h, V2 = 4.0 km/h, V3 = 5.5 km/h, AOD = after one day and AOW = after one week
Effect of spraying pressure on mortality (%) of spotted bollworms (SBW) and American bollworms (ABW) after one day (AOD) and after one week (AOW) of third spray
The results indicated in table 5 that significantly more
[image:4.595.313.553.250.354.2]mortality of spotted bollworms (SBW) and American bollworms (ABW) were achieved at P2 (400 kPa) followed by P3 (500 kPa) and P1 (300 kPa). The % age mortality of spotted bollworms at P2 (400 kPa) was 71.07 % and 94.07 % after one day and after one week and the % age mortality of American bollworms at P2 (400 kPa) was 72.11 % and 94.74 % after one day and after one week respectively. The table 6 depicted that mortality rate of spotted bollworm at P1, P2 and P3 pressures were 1.26, 1.32 and 1.35 times greater and mortality rate of American bollworm at P1, P2 and P3 pressures were 1.22, 1.31 and 1.42 times greater after one week than that after one day.
Table 5. Effect of Pressure on mortality (%) of SBW and ABW after one day (AOD) and after one week (AOW) of third spray
Pressure SBW ABW
AOD AOW AOD AOW
P1 66.11c* 83.66b 68.37b* 83.77b
P2 71.07a 94.07a 72.11a 94.74a
P3 68.66b 93.14a 65.44b 92.96a
Mean 68.61 90.29 68.64 90.49
LSD(0.05) 2.39 2.22 3.15 2.67
* Means in each column followed by the same letter are not significantly different at 5 % probability level. P1 = 300 kPa, P2 = 400 kPa, P3 = 500 kPa, SBW = Spotted bollworm, ABW = American bollworm AOD = after one day and AOW = after one week
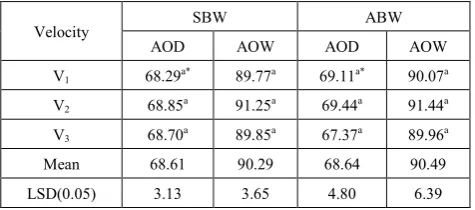
Effect of Velocity on mortality (%) of spotted bollworms (SBW) and American bollworms (ABW) after one day (AOD) and after one week (AOW) of third spray
[image:4.595.314.552.604.709.2]The results presented in table 6 indicated that significantly more mortality of spotted bollworms and American bollworms were achieved at V2 (4.0 km/h) followed by V3 (5.5 km/h) and V1 (2.5 km/h). The % age mortality of spotted bollworms at V2 was 68.85 % and 91.25 % after one day and after one week and the % age mortality of American bollworms at V2 was 69.44 % and 91.44 % after one day and after one week respectively. The velocities V1, V2 and V3 did not significantly differ in mortality rate of spotted bollworms and American bollworms after one day and after one week
Table 6. Effect of Velocity on mortality (%) of SBW and ABW after one day (AOD) and after one week (AOW) of third spay
Velocity SBW ABW
AOD AOW AOD AOW
V1 68.29a* 89.77a 69.11a* 90.07a
V2 68.85a 91.25a 69.44a 91.44a
V3 68.70a 89.85a 67.37a 89.96a
Mean 68.61 90.29 68.64 90.49
LSD(0.05) 3.13 3.65 4.80 6.39
Effect of spraying pressure on mortality (%) of spotted bollworms (SBW) and American bollworms (ABW) after one day (AOD) and after one week (AOW) of Fourth spray
[image:5.595.57.300.320.425.2]The table 7 depicted that mortality rate of spotted bollworm at P1, P2 and P3 pressures were 1.29, 1.31 and 1.37 times greater and mortality rate of American bollworm at P1, P2 and P3 pressures were 1.25, 1.33 and 1.34 times greater after one week than that after one day. The results indicated that significantly more mortality of spotted bollworms and American bollworms were achieved at P2 (400 kPa) followed by P3 (500 kPa) and P1 (300 kPa). The % age mortality of spotted bollworms at P2 (400 kPa) was 72.03 % and 94.92 % after one day and after one week and the % age mortality of American bollworms at P2 (400 kPa) was 69.74 % and 93.37 % after one day and after one week respectively.
Table 7. Effect of Pressure on mortality (%) of SBW and ABW after one day (AOD) and after one week (AOW) of fourth spray
Pressure SBW ABW
AOD AOW AOD AOW
P1 64.25c* 83.03b 67.62a* 84.88b
P2 72.03a 94.92a 69.74a 93.37a
P3 68.00b 93.51a 67.70a 91.29a
Mean 68.09 90.48 68.35 89.94
LSD(0.05) 2.84 2.32 2.17 4.81
* Means in each column followed by the same letter are not significantly different at 5 % probability level. P1 = 300 kPa, P2 = 400 kPa, P3 = 500 kPa, SBW = Spotted bollworm, ABW = American bollworm AOD = after one day and AOW = after one week
[image:5.595.314.552.357.448.2]Effect of Velocity on mortality (%) of spotted bollworms (SBW) and American bollworms (ABW) after one day (AOD) and after one week (AOW) of Fourth spray
Table 8. Effect of Velocity on mortality (%) of SBW and ABW after one day (AOD) and after one week (AOW) of fourth spray
Velocity SBW ABW
AOD AOW AOD AOW
V1 68.11a* 89.25a 67.88a* 88.44a
V2 68.55a 91.44a 69.03a 92.18a
V3 67.63a 90.77a 68.14a 88.92a
Mean 68.09 90.48 68.35 89.84
LSD(0.05) 3.69 4.65 4.98 5.69
* Means in each column followed by the same letter are not significantly different at 5 % probability level. V1 = 2.5 km/h, V2 = 4.0 km/h, V3 = 5.5 km/h, SBW = Spotted bollworm, ABW = American bollworm AOD = after one day and AOW = after one week
The results of table 8 indicated that significantly more mortality of spotted bollworms and American bollworms were achieved at V2 (4.0 km/h) followed by V3 (5.5 km/h) and V1 (2.5 km/h). The % age mortality of spotted bollworms at V2 was 68.55 % and 91.44 % after one day and
after one week and the % age mortality of American bollworms at V2 was 69.03 % and 92.18 % after one day and after one week respectively. The table 8 depicted that mortality rate of spotted bollworm at V1, V2 and V3 velocities were 1.31, 1.33 and 1.34 times greater mortality rate of American bollworm at V1, V2 and V3 velocities were 1.30, 1.33 and 1.30 times greater and after one week than that at after one day.
Effect of field size on field efficiency of boom sprayer
The statistically analyzed data presented in table 9 showed that field efficiency was greatly influenced by the field size. Table 9 showed that sprayer efficiency in field F1 was significantly greater than those of F2 and F3. The field efficiency of sprayer in field F1 was more because of its more length as compared to the other two fields. Second field had more sprayer efficiency than that of third field but less efficient than first field. Therefore, it can be concluded that for same width of fields, longer the field more the productive time, therefore, more will be the field efficiency of the sprayer.
Table 9. Effect of field size on field efficiency of boom sprayer
Field Field Efficiency (%)
F1 74.00a
F2 67.00b
F3 52.92c
Mean 64.64
LSD(0.05) 4.46
*Means in each column followed by the same letter are not significantly different at 5 % probability level. F1 = 228.5 m * 32.31 m, F2 = 167.65 m * 32.31 m and F3 = 103.04 m * 32.31 m
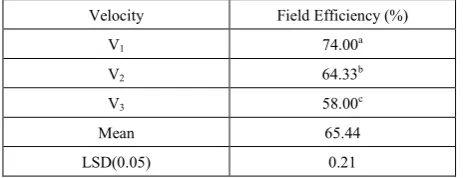
Effect of field speed of boom sprayer on field efficiency
[image:5.595.57.298.545.650.2]The statistically analyzed results showed in table 10 depicted that with increase in field speed, the field efficiency decreased. The reason could be the more unproductive time for turning at field ends which might had been due to less maneuverability of tractor. That’s why the first field speed was more efficient than the other two lower speeds. Second field speed was more efficient than third field speed but less efficient than first field speed for field efficiency of sprayer. Similarly third field speed was less efficient as compared to other two field speeds.
Table 10. Effect of field speed of boom sprayer on field efficiency
Velocity Field Efficiency (%)
V1 74.00a
V2 64.33b
V3 58.00c
Mean 65.44
[image:5.595.317.549.649.738.2]REFERENCES
[1] Anonymous. 2010. Economic Survey of Pakistan. Government of Pakistan, Finance Division, Economic Advisors Wing, Islamabad.
[2] Arif, M. J. 2001. Pest scouting, forecasting, nature and extent of damage. Class notes. Assistant professor, Department of Agri. Entomology, University of Agriculture, Fisalabad.
[3] Hameed, A. and R.Rehman. 1996. Test Report, Pam Penyem Galas PB-16. Knapsack Manual Sprayer. Agricultural Mechanization Research Institute, Multan.
[4] Mazari, R.B. 2005. Country report on international code of conduct on the distribution and use of pesticides. Department of Plant Protection, Ministry of Food, Agriculture & Livestock Government of Pakistan.
[5] Monsour, S.A. 2004. Pesticide exposure-Egyptian scene. Pesticides & Environmental Toxicology, National Research Centre, Dokki, Cairo, Egypt. 198: 91-115.
[6] SAS. 2002-03. SAS/STAT user’s guide. Version 9.1 SAS institute, Lnc. Carg, NC.