Journal of Chemical and Pharmaceutical Research, 2013, 5(12):1258-1262
Research Article
ISSN : 0975-7384
CODEN(USA) : JCPRC5
U.V. spectroscopy technique for analysis to clarithromycin for gastric pH
sensitive formulation
Girish Kumar Tripathi, Satyawan Singh and Baljee Vishwaindu Pandey
Nanoparticulate Analytical Laboratory, Saroj Institute of Technology & Management, Lucknow, India
_____________________________________________________________________________________________
ABSTRACT
The present study describes a simple, specific, sensitive, rapid and economical U.V. spectroscopy method for estimation clarithromycin concentration for gastric pH sensitive formulation. The absorption maxima or λmax of the drug was found to be 353 nm. A linear response was observed in the range of 2-40 µg/ml in simulated buffer solution (pH 1.2) and phthalate buffer solution (pH 3.4) with a regression coefficient (r2) of 0.9812 and 0.9808 respectively. The characteristics analyzed in simulated gastric fluid like slope, intercept, correlation coefficient(r), standard deviation, LOD, and LOQ, were found to be 0.63, 0.053, 0.9822, 0.261, 1.242 µg/ml and 4.14 µg/ml respectively whereas in phthalate buffer (pH 3.4) the value of slope, intercept, correlation coefficient, standard deviation, LOD, and LOQ were found to be 0.62, 0.045, 0.9295, 0.198, 0.958 µg/ml and 3.19 µg/ml respectively. The low values of LOQ and LOD of the proposed method can be used for the determination of amoxicillin trihydrate in quality control of acidic pH sensitive formulation without interference of the excipients.
Keywords: pH sensitive, intercept, Limit of detection, Limit of quantification, U.V.VIS spectroscopy.
_____________________________________________________________________________________________
INTRODUCTION
Oral pH sensitive drug delivery systems are gaining importance as these systems deliver the drug at specific part of the GI as per the pH of gastrointestine, resulting in improved patient therapeutic efficacy and compliance. The pH range of fluids in various segments of the GI may provide environmental stimuli for the response drug release [2]. Oral gastro retentive pH sensitive systems like floating and bioadhesive drug delivery systems would be improve the targeting of gastric and duodenum infection of Helicobacter pylori [1-4].
Clarithromycin (CL) a semisynthetic macrolide antibiotic derived from erythromycin, inhibits bacterial protein synthesis by binding to the bacterial 50S ribosomal subunit. Binding inhibits peptidyl transferase activity and interferes with amino acid translocation during the translation and protein assembly process. CL may be bacteriostatic or bactericidal depending on the organism and drug concentration. CL is first metabolized to 14-OH, which is active and works synergistically with its parent compound. Like other macrolides, it then penetrates bacterial cell wall and reversibly binds to domain of the 23S ribosomal RNA of the 50S subunit of the bacterial ribosome, blocking translocation of aminoacyl transfer-RNA and polypeptide synthesis [5].
performance of drug product [6]. Clarithromycin is a UV-absorbing molecule with specific chromophores in the structure that absorb at a particular wavelength and this fact was successfully employed for their quantitative determinations using the UV spectrophotometric method . Regression characteristics like slope, intercept, correlation coefficient, limit of detection (LOD), and the limit of quantification (LOQ), correlation coefficients (r), standard deviation are summarized in .The scope of developing and validating analytical method is to ensure a suitable method for a particular analyte more specific, accurate and precise the main objective for that is to improve the condition and parameter, which should be followed in the development and validation CL has been the foremost anti-infective agent used in clinical medicine for more than a century. The purpose of this analytical method validation is to demonstrate that this method is suitable for the intended purpose and capable of giving reproducible results.
EXPERIMENTAL SECTION
Reference standard of amoxicillin trihydrate was kind gift from Ranbaxy Laboratory Dawash, India. All other ingredients used were of analytical grade. Instruments: UV-Visible spectro-photometer (Shimadzu UV-1601 PC and UV-1700), Electric balance (Type AUY 120 Shimadzu).
METHOD DEVELOPMENT Solubility Test
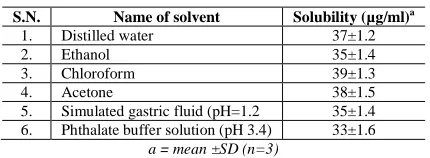
[image:2.595.191.406.445.524.2]Phase solubility studies were performed according to the method reported by Higuchi and Connors, 1965 [7]. The solubility of the drug was analyzed in distilled water, ethanol, chloroform, acetone, stimulated gastric fluid (pH=1.2) and phthalate buffer solution (pH 3.4). The excess amounts of drug (100 mg) were transferred in to 10 ml stopper conical flask. The mixture was diluted by the solvent with stirring up to the mark. The mixture was shaken in thermostatic shaker bath for 24 hr at 37±5 0C .The aliquots of 5 ml were withdrawn and filter through a 0.45-µm Whatman filter paper for determining drug concentration by U.V. spectrophotometer at 334.5 nm. All assays were performed in triplicate (Table 1). However, stimulated gastric fluid (SGF) and phthalate buffer solution (PBS) were chosen as a solvent for developing the method. The solvents used in vitro drug release in gastric stimuli sensitive formulation [1, 4].
Table 1 Solubility of clarithromycin in aqueous and organic solvents
S.N. Name of solvent Solubility (µg/ml)a
1. Distilled water 37±1.2
2. Ethanol 35±1.4
3. Chloroform 39±1.3
4. Acetone 38±1.5
5. Simulated gastric fluid (pH=1.2 35±1.4 6. Phthalate buffer solution (pH 3.4) 33±1.6
a = mean ±SD (n=3)
Preparation of stock solution
Standard stock solution of CL was prepared by dissolving 100 mg of CL in 100 ml of the solvent to produce a concentration of 1 mg/ml.
Preparation of working standard solution
One ml was pippetted into a 100 ml volumetric flask and the volume was made up to mark and final to produce the solution of 10 µg/ml. Then 10 µg/ml sample was scanned in UV-VIS spectrophotometer in the range 400-200nm using the respective solvent as a blank. The wavelength corresponding to maximum absorbance (λmax) was found to be 353nm.
Preparation of calibration curve
y = 0.65x + 0.053 R2 = 0.9822
0
0.2
0.4
0.6
0.8
1
1.2
0
10
20
30
40
Concentration(µg/ml)
A
b
s
o
rb
a
n
c
[image:3.595.84.517.77.551.2]e
Figure 1 Calibration curve of clarithromycin in simulated gastric fluid (1.2 pH)
y = 0.62x + 0.045 R2 = 0.9295
0
0.1
0.2
0.3
0.4
0.5
0.6
0.7
0.8
0.9
0
10
20
30
40
Concentration(µg/ml)
A
b
s
o
rb
a
n
c
e
Figure 2 Calibration curve of clarithromycin in phthalate buffer solution (3.4 pH)
Method of validation [8]
Validation is a process of establishing documented evidence, which provides a high degree of assurance that a specific activity will consistently produce a desired result or product meeting its predetermined specifications and quality characteristics. The method was validated for different parameters like Linearity, Accuracy, Precision, Specificity , Limit of Detection (LOD) and Limit of Quantification (LOQ).
Regression characteristics like slope, intercept, correlation coefficient, limit of detection (LOD), and the limit of quantification (LOQ), correlation coefficients (r), standard deviation are summarized in (Table 2).The limit of detection is defied as the lowest concentration of an analyte that an analytical process can reliably differentiate from back-ground levels. The limit of quantification is defined as the lowest concentration of the standard curve that can be measured with an acceptable accuracy, precision, and variability. In this study, LOD and LOQ were based on the standard deviation of the response and the slope of the corresponding curve using the following eq 1 and eq 2.
LOQ = 10 S/M ……… (2)
Where S, the noise of estimate is the standard deviation of the absorbance of the sample and M is the slope of the related calibrations graph.
[image:4.595.120.478.221.381.2]Linearity: Various aliquots were prepared form the stock solution (1 mg/ml) ranging from 2- 35 µ g/ml (Table 3 and Figure 1 , Figure 2).
Table 2 Absorbance of clarithromycin for preparation of standard calibration curve in simulated gastric fluid (pH 1.2) and phthalate buffers solution (pH 3.4)
S.N.
Concentration and absorbance of clarithromycin in simulated gastric fluid (1.2 pH )
[image:4.595.115.483.409.513.2]Concentration and absorbance of clarithromycin in phthalate buffer ( 3.4 pH ) Concentration (µg/ml) Absorbance (average) Standard deviation (n=3) Concentration (µg/ml Absorbance (average) Standard deviation (n=3) 1. 2. 3. 4. 5. 6. 7. 8. 9. 10. 11. 13. 2 5 8 11 14 17 20 23 26 29 32 35 0.02 0.12 0.24 0.36 0.42 0.56 0.59 0.64 0.74 0.82 0.86 0.92 ±0.04 ±0.05 ±0.03 ±0.08 ±0.02 ±0.05 ±0.02 ±0.08 ±0.02 ±0.03 ±0.02 ±0.08 2 5 8 11 14 17 20 23 26 29 32 35 0.02 0.04 0.14 0.36 0.48 0.52 0.58 0.56 0.64 0.66 0.73 0.76 ±0.02 ±0.08 ±0.04 ±0.03 ±0.04 ±0.05 ±0.07 ±0.03 ±0.08 ±0.04 ±0.03 ±0.02
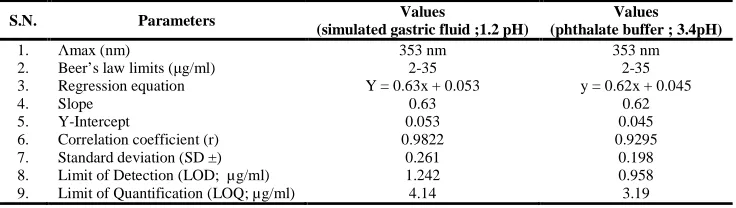
Table 3 Regression data of the calibration lines for quantitative determination of clarithromycin by UV method
S.N. Parameters (simulated gastric fluid ;1.2 pH) Values (phthalate buffer ; 3.4pH) Values
1. Λmax (nm) 353 nm 353 nm
2. Beer’s law limits (µg/ml) 2-35 2-35 3. Regression equation Y = 0.63x + 0.053 y = 0.62x + 0.045
4. Slope 0.63 0.62
5. Y-Intercept 0.053 0.045
6. Correlation coefficient (r) 0.9822 0.9295 7. Standard deviation (SD ±) 0.261 0.198 8. Limit of Detection (LOD; µg/ml) 1.242 0.958 9. Limit of Quantification (LOQ; µg/ml) 4.14 3.19
RESULTS AND DISCUSSION
The analytical method development recommends the quality, purity and specificity of the drug during the manufacturing process and hence the standard of the drug may not vary, which produce the desirable therapeutic effect. The drug obeyed Beer's law in the concentration range of 2-35 µg/ml in acidic buffer. The characteristics analysed in simulated gastric fluid like slope, intercept, correlation coefficient(r), standard deviation, LOD, and LOQ, were found to be 0.63, 0.053, 0.9822, 0.261, 1.242 µg/ml and 4.14 µg/ml respectively whereas in phthalate buffer (pH 3.4) the value of slope, intercept, correlation coefficient, standard deviation, LOD, and LOQ were found to be 0.62, 0.045, 0.9295, 0.198, 0.958 µg/ml and 3.19 µg/ml respectively.
acceptance criteria. Thus it has been concluded that the method is validated for the analysis of CL in acidic pH sensitive delivery system.
CONCLUSION
The proposed method for estimation of AM was found to be simple, accurate, precise, economical and rapid. LOD values of calibration curves indicates the lowest concentration of analyte in a sample that can be detected under a stated experimental conditions and LOQ values of calibration curves indicates the lowest concentration of analyte(s) in a sample that can be determined with acceptable precision and accuracy under the stated experimental conditions. Hence, it can be employed for routine analysis in quality control in gastric pH sensitive delivery system.
Acknowledgements
The authors are thankful to Director Pharmacy (Dr Diptendu Goswami), Saroj Institute of Technology and Management Lucknow India for providing laboratories facilities. Thanks also go to Dr. P.R. Misra, Scientist, and division of Pharmaceutics Central Drug Research Institute Lucknow for providing support.
REFERENCES
[1]G.K. Tripathi , S. Singh . Daru, 2010, 4, 247-53.
[2]C. Swati, S. Jagdale, J. Amit , V. Sudhir . AAPS PharmSciTech, 2009, 10, 1071.
[3]S. Miyazaki, N. Kawasaki, W. Kudo, D. Attwood, Int. J. Pharm, 2001, 220, 161–168. [4]G. K. Tripathi, S. Singh, Tropical J.Pharm. Res., 2010, 9 6, 533-539.
[5]J. Lindhe, T. Warring, N.B. Lang. Blackwell Munsgaard(Ed-4th) Clinical Periodontology and Implant Dentistry (Oxford, U.K. 2000) 499.
[6]L.V. Allen, N. G. Popovich, H.C. Ansel, Pharmaceutical Dosage Forms and Drug Delivery Systems, (Lippincott Williams & Wilkin 2005) 260-275.
[7]T. Higuchi, K. Connors K. Adv. Anal. Chem. Instrum. , 1965, 4, 117–123.