ISSN: 1992-8645 www.jatit.org E-ISSN: 1817-3195
472
VOLCANIC ASH FLOW MODELLING
AS AN EARLY WARNING SYSTEM TO NATIONAL
DISASTER
(KELUD ERUPTION 2014)
1AHMAD LUBAB, 2AHMAD HANIF ASYHAR, 3 MOH. HAFIYUSHOLEH, 4DIAN C. RINI, 5YUNIAR FARIDA.
1, 2, 3, 4, 5
Sunan Ampel Islamic State University, Department of Mathematics, Surabaya, Indonesia
E-mail: [email protected], [email protected], [email protected], 4
[email protected], [email protected]
ABSTRACT
The Aims of this research are modelling and simulate volcanic ash direction caused by Kelud eruption in 2014. Due to the simulation the ash flow path at 12 pm 14th February spreaded and formed a circle as an ellipse, flew to the north passed Jombang, Mojokerto, and Bojonegoro. It also approached Yogyakarta in Central Java in 120,000 metres above sea level but, it moved to the Southwest in half of this area and most particles flew to Indian Ocean in 17,000 metres above sea level.
Keywords: Mathematics Modelling, Gaussian Box Model, Simulation, Kelud, Volcanic Ash
1.
INTRODUCTIONKelud eruptions kill more than 15,000 people. In 1586 more than 10,000 people died. This mountain erupts periodically on 1901, 1919, 1951, 1966, and 1990. In 2007, it started to be actived and eventually erupted in 2014.
In 1926 government builded a system in order to direct the lava but, it cannot avoid the others impact such as social activities, school, economic, and transportation.
According to Dinas Kesehatan Pelabuhan Semarang [2], there are several factors that influence the level of volcanic ash for example size, concentration, times, ingredients, and the human exposure. Ash sizes are heterogeneous. A 10 micron ash is hard to absorb but smaller ash are absorbsed. If the ash size is less then 5 micron it will get in to alveolus. People who absorb more ash and absorb it in a long period will get worst effect. Ash component is acid and base. The acid ash ruins system. Susceptible people such as babies, old people, childrens, pregnants, and lung’s problems have higher risk than other.
Kelud eruption affected transport systems. People predicted the Kelud eruption effect is only around East Java. In fact, Yogyakarta had worse impact as in Surabaya. Land transportation had stopped, buses and trains did not operate for a few
day. Air transportation were affected, there are seven airports stopped for operate such as Juanda and Abdurrahman Saleh in East Java Adisumarmo, Adisucipto, and Ahmad Yani, in central Java Tunggul Wulung, and Husein Sastranegara in West Java.
The aim of this research is to develop mathematical modeling of volcanic ash, spreading term and to simulate impact mapping due to Kelud eruption in 2014.
2.
TRAINING OF PARAMETERS2.1 Particulate Dispersion
[image:1.612.346.494.607.710.2]Volcano eruption is a big disaster, but the effect is bigger than the eruption. It is affecting wheather and aviation industry. Ash and sulfur dioxide emitted during the eruption. This particulate releases to the traposphere and the stratosphere
ISSN: 1992-8645 www.jatit.org E-ISSN: 1817-3195
473 Basically, mass particulate (the Kelud volcanic ash) transport process are gravitational precipitation. Particulate precipitation velocity ( ) is variable determine particulate downward movement. It determine by particulate characteristic and gravitational acceleration. This velocity determined by [9]:
g
18 g 1
where
= particulate precipitation velocity (m/s) g = gravitational acceleration (m/s2) dp = particle diameter ( )
= particle density (gr/cm)
g = dynamic viscosity ( )
This velocity holds sway particulate dispersion in the atmosphere because it influence wind in disperse volcanic ash particulate. In determining particulate concentration, element which are contain z will affected by velocity of .
2.2 Gaussian-Box’s Model
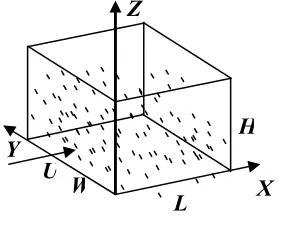
[image:2.612.132.276.449.562.2]Gaussian-Box Model is an approach to dispersion model by generate mathematical model based on particulate concentration formula (the volcanic ash). It uses Gauss dispersion formula as an algorithm in steady state [2].
Figure 2: Volcanic Ash Sketch.
U Velocity and Wind Come, W Study Area Width, LStudy Area Length and H Altitude Area
Volcanic ash spread form several points. There are formulas in Gaussian-Box model which use to determine volcanic ash spread from initial points.
2.2.1 Volcanic Eruption Height
The hight of volcanic eruption is formed by:
H H ∆h (3)
Figure 3: Volcano’s Height
H is the highest volcano’s altitude. H Is volcano’s altitude, and ∆h is volcanic ash height.
Volcanic ash height ∆h determined by Sriram et al empirical formula
∆h 2,47 / H / ! 3
Is the amount of flux’s mountain, H is volcano’s altitued (m) and wind velocity on the top (m/s).
The wind velocity is calculated using formula
#$$%&' #((&' 4) Is wind velocity (m/s) on ) (m). is wind velocity (m/s) on Z (m) which the wind velocity will estimated. p is an exponential that adress increasing velocity exponentially based on height.
In case particulate volcanic ash, particulate precipitation velocity ( ) influence volcano’s altitude. To get more accurate the highest volcano’s altitude formula for plume base particle obtained by change H to H(x) yield [4]:
* + *– - . 5 - . Define period of times which particle stays on billow of smoke:
- . 0$
Subtitute 5 to 6 then yield:
* + *– + 12
$
This is plume highest altitude formula.
2.2.2 Downwind Distance (x) and Crosswind Distance (y) From the Volcano’s Top.
Suppose that volcanic ash position are Xs and Ys, and receptor area position are Xr and Yr, so downwind x trough plume movement line obtained from Catalano modification [2]:
x 45X7– X 8sin WD – 5Y7– Y 8cos WD 8)
WD is angle that show which way the wind blows. Crosswind distance y from the origin of plume yield by:
y 45X7– X 8cos WD – 5Y7– Y 8sin WD 9)
W
L
H
U
Z
X
Y
H ∆h
ISSN: 1992-8645 www.jatit.org E-ISSN: 1817-3195
474 The X-axis is positive while it direct to the east from the origin. And the W-axis is positive while it direct to the north. Angular angle WD was measured in clockwise from the north.
3.
DISCUSSION3.1 Modification of Mathematics Modelling
The model is developed by advection equation [5]:
J QC U%AC 10
J states the mass transfer rate, U% is the average flow velocity, A is cross-sectional area. And C is concentration volcanic ash flow rate.
The deployment model PM10 or Kelud’s volcanic ash was formed by conservation of mass. Mass transfer in this case stated by volume control using continuum principle and followed by Reynolds transport theory.
According to Reynold’s theory [8]:
H
H. I ∀
K1
I L. N O
K
PQQRQQS
TU1VK WXYZ[W\\$ WXY
0 11
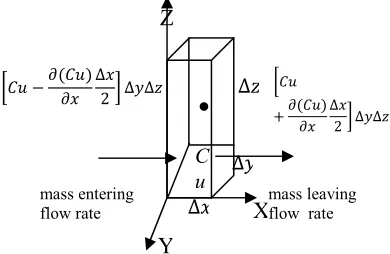
[image:3.612.96.291.447.574.2]The first integral states the mass flow rate in the volume control. And the second states net rate of mass flow leaving the surface control and diffusion is assumed to be zero.
Figure 4: Mass Transport Process
Equation 11 is simplified by convert the mass into concentration and therefore it obtains mass advection flow rate. This show the mass entering flow rate directed to X, Y, and Z axis respectively
]0 ^_ H _H+ ∆+2 ` ∆a∆b 12
]c ^_ 4H _Ha ∆a2 ` ∆+∆b 13
]d ^_e 4H _eHb ∆b2 ` ∆+∆a 14
Furthermore, mass advection flow rate that leave direct to X, Y, and Y – axis are:
]f0 ^_ H _H+ ∆+2 ` ∆a∆b 15
]fc ^_ H _Ha ∆a2 ` ∆+∆b 16
]fd ^_e H _eHb ∆b2 ` ∆+∆a 17
Meanwhile, the rate of particle concentration change in volume control is:
h f H_H. ∆+∆a∆b 18
Net mass leaving flow rate direct to X-axis is yield by last equation:
]f04 ]0 i_ H _H+ ∆+2 j ∆a∆b
4 i_ 4H _H+ ∆+2 j ∆a∆b
H _
H+ ∆+∆a∆b 19
The same approach is applied to determine net mass leaving flow rates direct to Y-axis and X-axis:
JKm4 Jm ∂ C
V
∂Y ∆X∆Y∆Z 20
JKq4 Jq ∂ C
W
∂Z ∆X∆Y∆Z 21 Net mass leaving flow rate is determined by (19), (20), and (21):
i∂ Cu∂x ∂ Cv∂y ∂ Cw∂z j ∆x∆y∆z 22
From (18), in accordance with law of conservation of mass in control volume (22) obtain:
H_
H. ∆+∆a∆b iH _H+ H _Ha H _eHb j ∆+∆a∆b 0 23
Then
∂C
∂t ∂ Cu∂x ∂ Cv∂y ∂ Cw∂z 0 24
By assuming that:
a) System is at steady state because system (the reasearch area) used in modelling is steady (did not move) so control volume is not
depend on time. Therefore wxw 0. b) Ash or PM10 is non-reactive.
c) The velocity of wind in X-axis is constant. Equation (24) could be solved by state boundary values. These boundaries are:
•
C u
∆+ ∆a
∆b
mass entering flow rate
mass leaving flow rate
X
Y
Z
^_ H _
ISSN: 1992-8645 www.jatit.org E-ISSN: 1817-3195
475 1. In case _ →∞ for +, a, b → 0, concentration
will reach unlimited point if point source close to 0. This boundary is needed in the scope of mathematical not in real condition where the source is reduced to a point.
2. In case _ → 0 for+, a, b →∞, concentration will close to 0 for unlimited distance.
3. Ash volcanic mass which spread before the wind are assumed to be constant and similar to the ash mass that emitted from the source. For x > 0, it is defined by:
I I I z_ + a b
∞ {| ∞ {| ∞ {| 25
Then, separate all variables in concentration equation to:
_ _̅ _′ ′
̅ ′
e e% e′
From (24) yield:
H
H. _̅ _′ H+ H ′ _̅ _′ H
Ha ̅ ′ _̅ _′ H
Hb e% e′ _̅ _′ 0
Then define average equation:
_̅ _′ ′
_̅_ ′ %_̅′ ′_′
_
26′_′ For % _′ % 0′ and similar condition for _ and
e_, we obtain new equation:
H
H+ _̅ Ha ̅_H ̅ Hb e%_H ̅ 4H+ ~H • H′_′
Ha ~ •′_′ H
Hb ~e • 27′_′
Right hand side indicates the average of turbulence effect on concentration. From molekular analog, we assume that:
u′C′
4ε€∂C
∂x v′C′
4ε•∂C
∂y w′C′
4ε‚∂C
∂zƒ„„ … „„ †
28
Equations (27) and (28) obtain:
∂
∂x u C ∂x v C∂ ∂x w%C∂ 4∂x∂ ε€∂C
∂x! 4∂y∂ ε•∂C ∂y!
4∂z∂ ε‚∂C
∂z! 29
General form in equation 29 is called Gauss equation and the solution is Gauss function. The description of analysis of Equation 29 is called Gaussian Plume’s model, which is:
_ ‡+{ exp Š4 i X
ε€!
Y ε•!
Z ε‚!j Œ
U 4x•Ž 30
Equation 31 is derived by substituting Equation 20 into equation 15.
Q I I I UKx41exp•4•‘X
2
εx’ ‘Y 2
εy’ ∞ 4∞ ∞ 4∞ ∞ 4∞ ‘Z 2
εz’” 4xU!• dx dy dz ~31•
Where
x ≡ X
ε€
y ≡ Y ~ε••
z ≡ Z
ε‚
Equation 31 is complicated therefore it can be simplified to
z‡+{ ˜
0 ~˜c• ˜d
I ™+š 4+̅4+ ! +
|
{|
I ™+š 4a 4a ! a
|
{|
I ™+š 4b̅4b ! b
|
{|
32
Suppose a x t, therefore integral
œ exp 4a x dx∞
• obtain
2a xdx dt
then
dx žŸ¡€.
If x Ÿ¡ then x √Ÿ. It yield
+ žŸ¡√£
¤ žŸ √Ÿ .
Therefore
I exp 4a x dx
∞
•
I e{ ¡€¡
dx
∞
•
I e{Ÿ 1
2a√tdt
∞
•
2¥ I e1 {Ÿt{ dt ∞
•
ISSN: 1992-8645 www.jatit.org E-ISSN: 1817-3195
476 According to Gamma function :
Γ n I e{€x¦{ dx, n § 0
∞
•
34
And
ΓŒ1
2• I e{€x { dx,
∞
•
Using another form of Γ N :
Γ N I +Y{ ™{0 +, |
•
And then substitute x y ↔ dx 2ydy;
x 0 → y 0; x ∞ → y ∞
it will obtain:
Γ n I y ¦{ e{•¡2ydy |
•
2 I y ¦{ e{•¡
dy 35
|
•
Since Γ # ' √π, equation 35 can be written by
I e{ ¡€¡dx |
•
1
2a ~√π• π2a 36 Hence, equation 34 , can be simplified to:
‡ 2³ ˜0 ~˜c• ˜d
Consequently
K Q
2π ε€ ~ε•• ε‚
37
By substituting equation 37 into equation 30 yield:
C Q
2π ε€ ~ε•• ε‚
exp Š4 i Xε
€!
Y ε•!
Z ε‚!j
U 4xŽ 38
Using Gauss normal distribution this equation can be stated by:
_ +, . 1
¶ 2³ ™+š i4 + 4 .
2¶ j 39
With X,Y and Z are :
· +– .; ¸ a– . ; ) b– e.
Equation 39 is developed to x, y, and z –axis direction and it is obtained:
_ +, a, b 2³z / ¶
0¶c¶d™+š Š4 i
· ¶0 !
¸ ¶c !
) ¶d !j
1
2Ž 40
For t=0, equation 28 can be expanded to be concentration as a function of time:
C x, y, z 2 Q
πU / σ€σ•σ‚exp Š4 i
x
σ€ !
y
σ• !
z
σ‚ !j
1
2Ž 41
Since the source of volcanic ash is determined by the altitude of mountain which has the highest point at H, therefore z in equation 41 is interfere with H consequently obtain:
C x, y, z Q
2πU / σ€σ•σ‚exp Š4 i
x
σ€ !
y
σ• !
z 4 H
σ‚ !j
1
2Ž 42
Particulate has particulate precipitation velocity (vŸ) which is influencing wind movement to x-axis. As a result, elements that contain z in equation 42 had affected by (vŸ) therefore
C x, y, z
Q
2πU / σ€σ•σ‚exp
¹ „ º „ » 4 ¼ ½ ½ ½ ¾ x
σ€ !
y
σ• !
¿ À
Á z 4 #H 4VŸu '!. x
σ‚ Â Ã Ä Å Æ Æ Æ Ç 1 2 ƒ „ … „ † 43
This equation is spreading volcanic ash mathematical modeling. Computer simulation program is developed according to this equation.
3.2 Computer Simulation
ISSN: 1992-8645 www.jatit.org E-ISSN: 1817-3195
477 The datas discover that the highest eruption reach 17,000 metres. In fact, other eruptions did not reach the same distance. Therefore, the simulation is created on 12,000 metres high and 17,000 metres high. The simulation is also deal with the differences in wind direction and velocities.
The simulation created with Matlab. GUI Matlab is made to help user use it.
3.2.1 Simulation of 14th February 2014 at 00.00 UTC on 12,000 and 17,000 m above Sea Level
At 12,000 metres high, the athmosphere is stable, wind velocity is constant to 50 knot and it is directly to the west. At 17,000 metres high, the atmosphere is unstable, the wind fluctuate. The velocity reaches 65 knot and directly to South West.
Figure 5 and 6 show the simulation result for 12,000 and 17,000 metres above sea level.
Figure 5: Simulation 14th February 2014 at 00.00
UTC on 12.000 mabove Sea Level
Figure 6: Simulation 14th February 2014 at 00.00
UTC 17,000 m above Sea Level
The Figure shows that in 0.00 UTC 14th February 2014 volcanic ash (PM10) spread in circles in 12,000 metres above sea level but directly to the south west in 17,000 metres above sea level. During the eruption, atmosphere was unstable. As a result, air in the upper and lower layer mixed which create a strong turbulence and updraft. Therefore, the volcanic ash fluctuated.
3.2.2 Simulation of 14th February 2014 at 12.00 UTC 12.000 and 17.000 metres above Sea Level
[image:6.612.94.521.325.724.2]On 12,000 metres above sea level, the wind was fluctuated. It directed to the west and the velocity was 35 knot. The atmosphere was unstable. Meanwhile, on 17,000 metres high the wind on steady state and the speed was 65 knot directed to the south west. The atmosphere on this altitude was stable
Figure 7: Simulation 14th February 2014 at 12.00
UTC 12,000 m above sea level
Figure 8: Simulation 14th February 2014 at 12.00
ISSN: 1992-8645 www.jatit.org E-ISSN: 1817-3195
478 Figure 7 and 8 show volcanic ash spreads simulation on Kelud eruption 14th February 2014 at 12 am. The ash (pm10) spread in ellips directed to the north through Jombang, Mojokerto, Lamongan, and Bojonegoro. Then it moved to the west approaching Middle Java, Yogyakarta, and Surakarta in 12,000 metres high. In 17,000 metres above sea level, it spread to Central Java and most of it toward Pasific Ocean.
4.
CONCLUSSIONPM10 spread or Kelud volcanic ash model is developed by advection equation and the model is created by conservation of mass. Mass transfer in this case stated by volume control using continuum principle and then followed by Reynolds transport theory.
The Simulation result shows that volcanic ash spread in ellips form at 12.00 UTS on 14th February 2014. The ash spread from north to the west on 12,000 metres above sea level. It spread to the south west and Pasific Ocean in higher amount on 17,000 metres above sea level.
REFRENCES:
[1] Ariyanto, “Efek Abu Vulkanik Bagi Kesehatan Masyarakat”,
http://124.81.108.71/kkp/bacaberita.php?milihn di=28, viewed 7th Apr 2015
[2] Catalano, “User’s Guide for RAM (Regulatory Air Models)”, 2nd ed., 1987
[3] http://vast.nilu.no/eruptions/mtkelut, “Large eruption of Mt. Kelut, in East Java, Indonesia, grounds air travel FLEXPART forecast for SO2 and total column of fine ash - 27 Feb 2014 at 15 UTC (NILU)”, viewed 18 Mar 2015.
[4] Heinson, R., J., Kabel, R., L. “Source and Control of Air Pollution”, 1999
[5] Jerald, L., Achooner, Zehnder, A. “Enviromnetal Modeling, Fate And Transport of Pollutans In Water, Air And Soil”, Departement of Civil and Enviromnetal Engineering the University of Lowa, Awiley-Interscience Publication, John Wiley and sons.INC. 1996
[6] Langmann, B. “On the Role of Climate Forcing by Volcanic Sulphate and Volcanic Ash”Advances in Meteorology, 2014, 1-17. [7] Mashuda, “Simulasi Pola Penyebaran
Particulate Matter 10 (PM 10) di Area Industri
PT Semen Gresik di Tuban” Unpublish Thesis, ITS Surabaya. 2011
[8] Munson, B. R., Young, D.F., Okishi, T.H. “Mekanika Fluida”, 4th ed, Erlangga, Jakarta.2004
[9] Nurhayati.“Pemrograman Dispersi Pencemaran Partikulat (PM-10) Dari Sumber Titik i Tunggal Kontinu Berdasarkan Persamaan Gauss”, Unpublish thesis. Sepuluh Nopember Institute of Technology Surabaya. 2000
![Figure 1: Dust Transport Process (yellow), Volcanic Ash (grey), and Radiation Effect [6]](https://thumb-us.123doks.com/thumbv2/123dok_us/8908993.958287/1.612.346.494.607.710/figure-dust-transport-process-yellow-volcanic-radiation-effect.webp)