ISSN: 1992-8645 www.jatit.org E-ISSN: 1817-3195
AN ALGORITHM OF DIGITAL MODULATION
IDENTIFICATION BASED ON INSTANTANEOUS
FEATURES
1
MINGWEI QIN, 2XIANGLU LI, 3YUANCHENG YAO
1,3
School of Information Engineering, Southwest University of Science and Technology, Mianyang, 62100, China
2
The Institute of Electronic Engineering, China Academy of Engineering Physics, Mianyang, 62100, China E-mail: 1 [email protected], 2 [email protected] , [email protected]
ABSTRACT
Automatic modulation identification plays an important role in non-cooperative communication systems. An improved approach, based on instantaneous features and binary tree classifier has been proposed for the classification of Medium Frequency (IF) digital signals at low signal-to-noise ratio (SNR) situation. Mean filter was applied to suppress the noise and five new characteristic parameters such as maa, maf, map, raf and
maa1, were extracted for the classifying. It is shown that the proposed algorithm has better performance than the traditional approaches. Theoretical arguments are verified via extensive simulations. Simulation results indicate that the correct classification probability (Pcc) with proposed algorithm has been improved
compared with the traditional method.
Keywords: Modulation Identification, Instantaneous Features, Parameter Optimization, Decision Classification
1.INTRODUCTION
Automatic digital communication signal recognition is a technique that recognizes the type of the received signals with some assumptions. It is widely used in military and civil domains, such as interference recognition, spectrum sensing, electronic confrontation, etc.
Generally, the methods for modulation type classification can be divided into two types: the statistical pattern recognition and the decision theory [1-2]. The statistical pattern recognition method suffers from less computational complexity compared with the decision theory, though it is sensitive to impairments like phase frequency offset. It can be divided into three main subsystems: the signal pre-processing subsystem, the feature extraction subsystem and the classifier subsystem. The former pre-processes the signal (e.g. noise reduction, carrier frequency estimation, symbol rate estimation, etc.), the second subsystem extracts the features (e.g. spectral characteristics, instantaneous characteristics, higher-order cumulants, etc.), and the last determines the membership of signal (e.g. neural networks, support vector machine (SVM), etc.) [3-10]. The method based on instantaneous features can be extracted easily and has strong practicality.
Many modulation classification techniques based upon instantaneous characteristics have been published in the literature. E.E. Azzoz and A.K. Nandi [11-13] solve the problem by using the instantaneous characteristics of IF modulation signals, but only works well at high signal-to-noise ratio (SNR). In order to improve the ability of noise reduction, wavelet de-noising was applied before extracting features, which needs decomposition signals firstly, then reconstructed signals with the proceed coefficients[14], but the processing is very complex and it is impossible for realizing in engineering.
ISSN: 1992-8645 www.jatit.org E-ISSN: 1817-3195
2.SIGNALMODEL
The channel noise is assumed to be additive white Gaussian noise (AWGN). The received IF signals (ASK\FSK\PSK) can be defined as follows.
For MASK signals
( )
( )
[
(
)]cos
MASK n s c
n
x
t
=
∑
a g t
−
nT
w t
+
n t
(1)Where g(t) is a pulse shaping function, Ts is a
symbol duration, wc is carrier frequency, an is the baseband signal(an=0,1,…M-1) ,and n(t) corresponds to a complex additive white Gaussian noise with zero mean and variance N0/2.
For MFSK signals
( )
( )
exp(
) (
) cos
MFSK
n s c
x
t
A
jw t g t
nT
w t
n t
=
−
+
(2)Where A is the unknown amplitude factor and wn can be defined as follows
{(2
1
)
,
1, 2,...,
}
n
w
∈
m
− −
M
∆
w m
=
M
(3)
Where
∆
w
is the frequency offset of FSK signals?For MPSK signals
( )
( )
exp(
) (
) exp(
) cos
MPSK
n s n c
x
t
A
j
ϕ
g t
nT
j
θ
w t
n t
=
−
+
(4)
Where θn is phase shift, and phase sequences defined as follows:
{
(2
1) /
,
0,1,...,
1
}
n
m
M m
M
ϕ
=
π
+
=
−
(5)3.MODULATIONRECOGNITIONMETHOD
A. Instantaneous features and noise Restriction
The analytical form z(t) of received signal x(t) through Hilbert transform is
( )
( )
( )
z t
=
x t
+
jH x t
(6)And H[x(t)] is
( )
1
x
( )
H x t
x
d
t
τ
τ
π
τ
+∞ −∞
=
∫
−
(7)z(t) can be expressed in polar coordinates
( )
( )
( )
j tz t
=
a t e
⋅
ϕ (8)The instantaneous amplitude a(t) is
[ ]
[ ]
[ ]
2 2
2 2
( ) Re ( ) Im ( )
( ) ( )
a t z t z t
x t H x t
= +
= + (9)
The instantaneous phase φ(t) is
[ ]
[ ]
[ ]
Im
( )
( )
arctan
Re
( )
( )
arctan
( )
z t
t
z t
H x t
x t
ϕ
=
=
(10)
The phase sequence contains the linear part, which is contributed by the carrier, and the nonlinear part, which is contributed by the baseband signal. The algorithms of phase unwrapping and linear programming are needed in estimating unwrapped instantaneous nonlinear phase [11].
The instantaneous frequency can be defined as follows
[ ]
[ ]
[ ]
[ ]
2( ) ( )
( ) arctan
( )
( ) ( ) ( ) ( )
( )
H x t
d t d
w t
dt dt x t
H x t x t x t H x t
a t
ϕ
= =
′ − ′
=
(11)
Where
[ ]
{
[ ]
}
( )
{ }
( )
( ) d ( )
H x t H x t
dt d
x t x t
dt
′ =
′ =
(12)
Due to using of the instantaneous features, the traditional modulation classification algorithms have poor anti-noise ability. De-noising can be done to improve the classification algorithms performance.
Mean filter is linear filter, which is widely used for the restorations of signals and images corrupted by noise. The author found that ripple is presented due to the use of Hilbert transform when extracting analytical form of original real signal. Using the mean filter can smooth the amplitude and inhibit the effecting of noise.
[image:2.612.323.527.336.479.2]ISSN: 1992-8645 www.jatit.org E-ISSN: 1817-3195
0 500 1000 1500 2000 2500 3000 3500 5
5.2
0 500 1000 1500 2000 2500 3000 3500 5
[image:3.612.90.285.72.216.2]5.2
Figure 1. Instantaneous phase of BPSK signal pre- and post filter(AWGN, ∞ dB)
0 500 1000 1500 2000 2500 3000 3500
-0.5 0 0.5 1 1.5
0 500 1000 1500 2000 2500 3000 3500
0 1 2
Figure 2. Instantaneous phase of 2FSK signal pre- and post filter(AWGN, 20dB)
B. Feature Extraction
The identification performance is poor at low SNR with the traditional method based on instantaneous features, and the expression of the characteristic parameters is extremely complex. For example, Fourier transform is applied when extracting the features, which has large calculation and will consume lots of logic resource in FPGA. In order to reduce the computational complexity, five characteristic parameters (maa , maf , map , raf , maa1) are used.
maa is the mean value of the absolute value of the normalized-centered instantaneous amplitude of the signal
( )
1
aa cn
s
m
a
i
N
=
∑
(13)Ns is the number of statistical samples, acn(i) is the value of the normalized-centered instantaneous amplitude, it can be defined as follows
( )
( )
( )
1
1
cn N
s i
a i
a
i
a i
N
=
=
−
∑
(14)maa is used to discriminate between 2ASK and 4ASK as one group and BPSK,QPSK,2FSK and 4FSK as the second group. The range of envelope fluctuation for ASK signals is large, while it’s small
for PSK signals, and FSK signals are constant envelope which has no amplitude information.
maf is the mean value of the absolute value of the normalized-centered instantaneous frequency, evaluated over the non-weak segments of the signal
( )
( )
1
n t
af N
a i a
m
f
i
c
>=
∑
(15)Where
φ
NL( )
i
is the value of the non-linear component of the instantaneous phase, c is the number of samples, and at is a threshold for an(i) below which the estimation of the instantaneous phase is very sensitive to the noise.( )
( )
( )
1
1
NNL
i s
i
i
i
N
φ
ψ
ψ
=
=
−
∑
(16)Where ψ(i) is the instantaneous phase of the signal, Ns is the number of samples, maf is used to discriminate between 2FSK and 4FSK.
map is the mean value of the absolute value of the normalized-centered instantaneous phase, evaluated over the non-weak segments of the signal
( )
( )
1
n t
ap NL
a i a
m
i
c
>φ
=
∑
(17)map is used to discriminate between BPSK and QPSK.
maa1 is the mean value of the absolute value of the secondary normalized-centered instantaneous amplitude of the signal
( )
1
1
aa cn
s
m
a
i
N
′
=
∑
(18)a'cn(i) is the value of the secondary normalized-centered instantaneous amplitude, and it is used to discriminate between 2ASK and 4ASK.
raf is the ratio of the square of the mean value to the standard deviation of the normalized-centered instantaneous frequency of the signal
2
af af
af
m
r
σ
=
(19)It is used to discriminate between 2FSK and 4FSK as one group and BPSK, QPSK as the second group.
C. Classifier
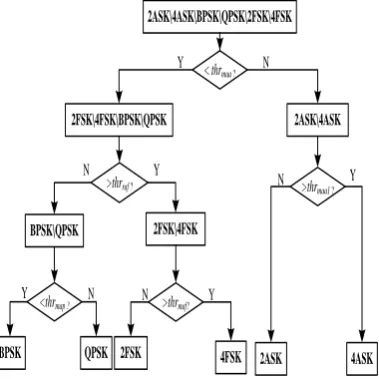
The proposed approach is used to identify 2ASK, 4ASK, 2FSK, 4FSK, BPSK and QPSK signals by applying the decision tree classifier. Threshold values are assumed to be thrmaa, thrmap, thrmaf,
[image:3.612.118.280.254.364.2]ISSN: 1992-8645 www.jatit.org E-ISSN: 1817-3195
divided into six stages as following. Figure 3 shows the flow chart of the recognition algorithm.
Step1 Do Hilbert transform of the received signal
x(t), obtain the orthogonal I/Q signals r, and then reduce noise by mean filter, go to step 2.
Step2 Extract maa, if maa>thrmaa, the modulation
type is 2ASK or 4ASK, and go to step 3. Otherwise the modulation type is BPSK, QPSK, 2FSK or 4FSK, and go to step 4.
Step3 Extract maa1, if maa1 >thrmaa1, the
modulation type is 4ASK.Otherwise the modulation type is 2ASK, and end the process.
Step4 Extract raf, if raf > thrraf, the modulation type is 2FSK or 4FSK, go to step 5.Otherwise the modulation type is BPSK or QPSK, and go to step 6.
Step5 Extract maf, if maf>thrmaf, the modulation type is 4FSK. Otherwise the modulation type is 2FSK, and end the process.
Step6 Extract map, if map>thrmap, the modulation
type is QPSK. Otherwise the modulation type is BPSK, and end the process.
2ASK\4ASK\BPSK\QPSK\2FSK\4FSK
< thrmaa ?
>thrraf ? >thrmaa1 ?
>thrmaf?
2FSK\4FSK\BPSK\QPSK 2ASK\4ASK
2FSK\4FSK
4FSK 2ASK 4ASK
2FSK BPSK\QPSK
Y N
Y
Y
Y N
N
N
<thrmap ?
BPSK QPSK
[image:4.612.327.503.183.703.2]Y N
Figure 3. Flow chart of the recognition algorithm
4.RESULTSANDDISCUSSION
In this section, a variety of simulation tests are carried to illustrate the performance of the proposed classification algorithms in Matlab. The pool of modulation consists of 2ASK, 4ASK, 2FSK, 4FSK, BPSK and QPSK signals. The symbol rate rb= 12.5KB/s, the carrier frequency fc=150 KHz, and the
sampling frequency fs=1200 KHz, AWGN is added.
[image:4.612.100.290.366.556.2]The number of the symbols in the test is set to 32. We evaluate the proposed algorithm via Monte Carlo experiments at different SNR from -4 dB to 24 dB.
Figure 4 shows the values of the characteristic parameter at different SNR, we can distinguish different signals clearly when the SNR is 0dB except
maa1. This is due to that bandwidth limitations of the ASK signals bring about great influence to the instantaneous envelope, and the secondary normalized-centered instantaneous amplitude further weakens the distinction between 2ASK and 4ASK.
-5 0 5 10 15 20 25
0 0.05 0.1 0.15 0.2 0.25 0.3 0.35 0.4 0.45
SNR/dB maa
ASK2 ASK4 FSK2 FSK4 BPSK QPSK
(a) characteristic parameter maa
-5 0 5 10 15 20 25
0 0.5 1 1.5 2 2.5
SNR/dB raf
FSK2 FSK4 BPSK QPSK
(b) characteristic parameter raf
-5 0 5 10 15 20 25
0.1 0.2 0.3 0.4 0.5 0.6 0.7 0.8
SNR/dB ma
f
FSK2 FSK4
(c) characteristic parameter maf
-5 0 5 10 15 20 25
0 0.05 0.1 0.15 0.2 0.25 0.3 0.35 0.4
SNR/dB ma
p
BPSK QPSK
ISSN: 1992-8645 www.jatit.org E-ISSN: 1817-3195
-5 0 5 10 15 20 25
0.1 0.2 0.3 0.4 0.5 0.6 0.7 0.8
SNR/dB maa
1
ASK2 ASK4
[image:5.612.94.294.73.220.2](e) characteristic parameter maa1
Figure 4. The curve of characteristic parameter with improved method
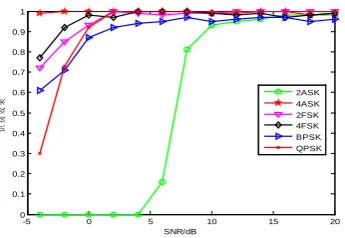
Figure 5 shows the correct classification probability Pcc from 100 Monte Carlo trials for each
modulation type with the proposed algorithm. The result presents that the correct classification probability Pcc is above 85% for SNR=0 dB except
2ASK signal. And when SNR=10dB,Pcc is above
90% for all signals.
Figure 6 shows the correct classification probability Pcc of the proposed algorithm and the
traditional algorithm. We note that the Pcc reaches to
96% for SNR=8 dB with the new algorithm, while the Pcc is only 75% with the traditional approaches.
The Pcc with the proposed method improves about 4
dB compared with the traditional algorithms.
-5 0 5 10 15 20
0 0.1 0.2 0.3 0.4 0.5 0.6 0.7 0.8 0.9 1
SNR/dB
识别效果
[image:5.612.111.284.419.538.2]2ASK 4ASK 2FSK 4FSK BPSK QPSK
Figure 5. Recognition performance with new method under different SNR for each signal
-5 0 5 10 15 20
0 0.2 0.4 0.6 0.8 1
SNR/dB
Pc
c
[image:5.612.112.281.578.692.2]the traditional algorithm the proposed algorithm
Figure 6. Recognition performance with different methods under different SNR
5.CONCLUSIONS
A new approach has been proposed for the automatic modulation classification of IF ASK\FSK\PSK signals at low SNR. It is based on mean-filter de-noising, instantaneous features and binary tree classifier. Firstly, mean filter has been applied to restrain noise. Then, five characteristic parameters (maa, maf, map, raf, maa1) are extracted. Lastly, signals are distinguished by binary tree classifier. Simulation results show that the correct classification probability can reach to 96% at SNR of 8dB, and the correct classification probability Pcc
with the proposed algorithm has been greatly improved at low SNR situation compared with the traditional methods.
ACKNOWLEDGEMENT
This work is supported by the National Natural Sciences Foundation of China and NASF Joint Funding under Grant 10876035 , the Foundation D030202 and the Foundation B3120133002.
REFERENCES
[1] O.A. Dobre, A.Abdi, Y. Bar-Ness and W. Su 2007 J. IET Commun. 2 137-156
[2] Sills J.A. 1999 Proc. Int. Conf. on Military
Commun. (Atlantic) vol 1 (Atlantic: IEEE) p 217
[3] Ataollah Ebrahimzadeh Shermeh and Reza Ghazalian 2010. J. Digital Signal Processing.
20 1748-1757
[4] Ataollah Ebrahimzadeh Shrme 2011 J. Expert
System with Applications. 38 6000-6006
[5] Ata Ebrahimzadeh and Reza Ghazalian 2011 J.
Artificial Intelligence. 24 50-59
[6] Ataollah Ebrahim Zadeh 2010 J. Expert Systems
with Applications. 37 5803
[7] E.avci and D.Avci 2008 J. Appl. Expert Systems
with Applications. 35 90-101
[8] A.Ebrahimzadeh and S.E. Mousavi 2011 J.
Applied Soft Computing. 11 428
[9] Maciej Pedzisz and Ali Mansour 2005 J. Digital
Signal Processing. 15 295-304
[10]A.Ebrahimzadeh and A. Ranjbar 2008 J.
Artificial Intelligence. 21 569-577
[11]E.E. Azzouz and A.K. Nandi 1995 J. Signal
Processing. 47 57-69
[12]A.K. Nandi and E.E. Azzouz 1995 J. Signal
Processing. 46 511-522
[13]A.K. Nandi and E.E. Azzouz 1997 J. Signal
Processing. 56 165-175
Hu You-qiang,Liu Juan and Tan Xiao-Heng 2010 J. The Journal of China Universities of